


How to Use the Domain Semantic Map
Explore the AmICited Domain Semantic Map to find clusters and topic gaps across prompts, fan-out queries and pages.

A Domain Semantic Map turns thousands of loose data points (prompts, sub-queries, cited page titles) into a single picture of the topic space you’re competing in for AI attention.
At a Glance
- The Domain Semantic Map plots your tracked prompts, their fan-out queries, and cited page titles as points positioned by meaning.
- Points close together share a theme; the top 8 domains by citations are colored, everyone else is gray.
- Toggle the Prompts / Fan-out queries / Page titles layers to isolate one kind of item at a time.
- A cluster full of competitor titles and none of yours is a direct content gap.
- Regenerate after major content changes to see whether your footprint on the map has grown.
What is a semantic map, and why does it matter for AI visibility?
A semantic map is a visual layout of text items (words, phrases, or titles) positioned so that items with similar meaning sit close together and unrelated items sit far apart. It’s built using semantic search techniques: each piece of text is converted into a numerical representation (an embedding) that captures its meaning, and items with similar embeddings are plotted near one another. The result isn’t a random scatter: it’s a topology of your subject matter, where dense areas mark heavily-discussed themes and sparse edges mark niche or emerging ones.
This matters for generative engine optimization because AI answer engines don’t rank pages the way traditional search does: they synthesize an answer by pulling in dozens of related sub-queries and sources, then deciding what to cite. When ChatGPT, Perplexity, Gemini, or Google AI Overviews process a prompt, they don’t just match the literal words you tracked; they expand that prompt into a cloud of related “fan-out” queries, retrieve content for each one, and stitch the results into a response. If your content only covers the exact prompt and not the surrounding cloud of sub-topics the AI actually researches, you can be invisible in the final answer even though you rank for the head term.
This is where semantic clustering becomes a practical diagnostic rather than an abstract concept. By grouping your tracked prompts, the fan-out queries AI engines generate from them, and the titles of pages that got cited into one spatial map, you can see, at a glance, which themes have heavy AI research activity, which of those themes you’re actually present in, and which are being won entirely by competitors. That’s fundamentally different from a keyword list: a semantic map shows relationships, not just volume, so a topic gap is visible as a real gap in the picture, not a missing row in a spreadsheet.
The practical payoff is a form of content gap analysis that’s grounded in what AI models are actually researching for your space, rather than what you assume they’re researching. Instead of guessing which articles to write next, you can point to a specific cluster on the map, see that competitor titles dominate it and yours are absent, and treat that cluster as a content brief.
Where to find it
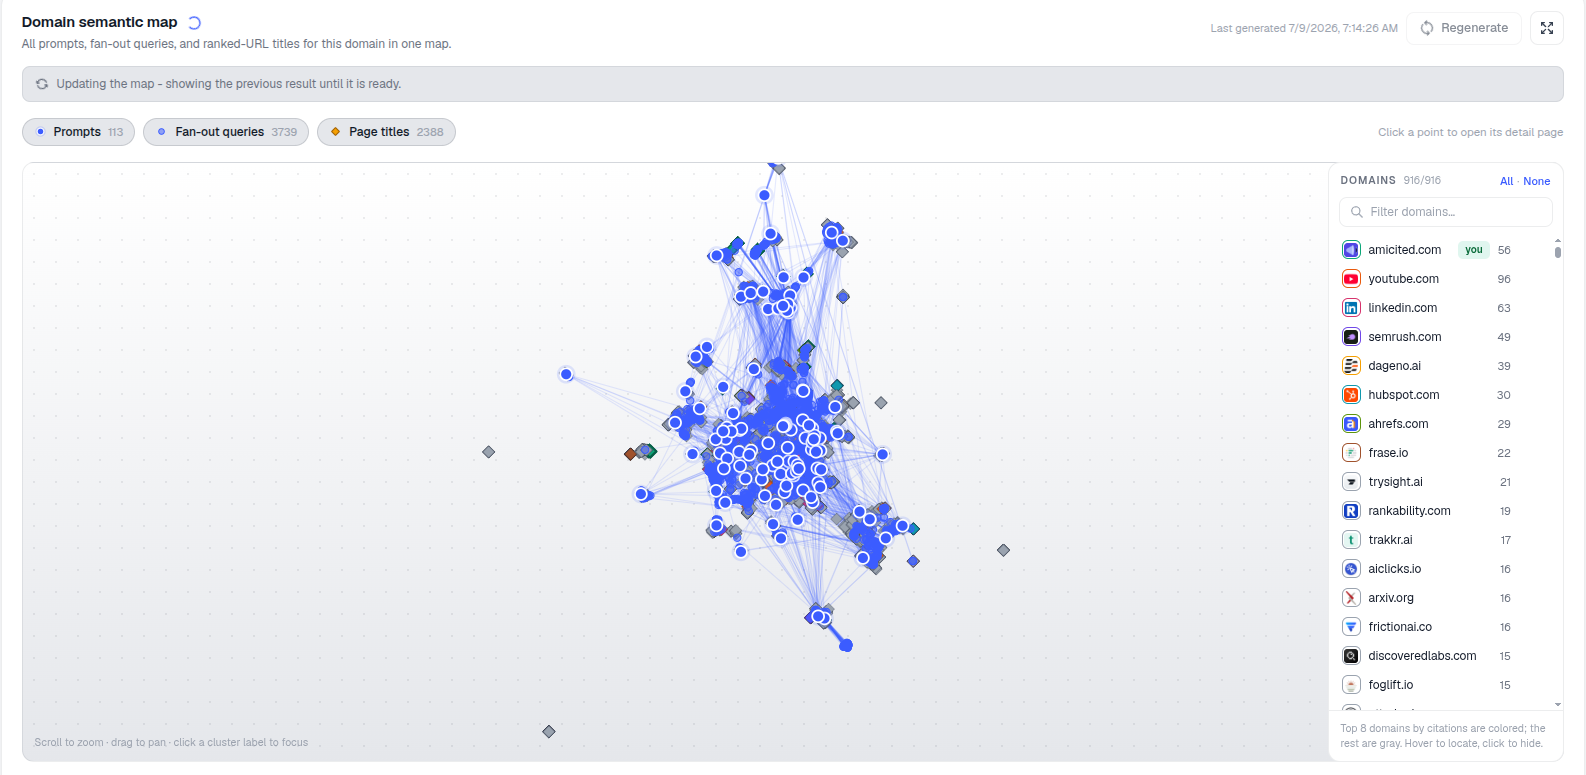
Scroll down the Dashboard to the Domain semantic map card. The header shows when it was last generated, plus a Regenerate button and a fullscreen icon for working the map at full size. If the underlying data changed recently, for example after a prompt set update or a new crawl, you may see “Updating the map: showing the previous result until it is ready.” The map is generated from your account’s own tracked data, so it reflects your actual prompt list, not a generic template.
What you’re looking at
Each point on the map is one item, and its type is controlled by the toggles above the map:
- Prompts: the questions you actively track, the same prompt set that drives your AI rank tracker results elsewhere in the dashboard.
- Fan-out queries: the many sub-queries AI engines break a prompt into while researching an answer. A single tracked prompt can expand into a dozen or more of these behind the scenes; seeing them plotted is the closest you’ll get to observing how a model actually interprets your question.
- Page titles: the titles of the URLs that were cited as sources in AI responses, from your domain and from competitors alike.
Points that sit close together are semantically similar: they’re talking about the same underlying theme even if the wording differs. Lines drawn between points show explicit relationships (a prompt connected to the fan-out queries it generated, for instance). Dense clusters mark topics with a lot of AI research activity, places where models are asking a lot of related questions and pulling in a lot of sources. Lonely points sitting off on the edges are niche or outlying themes that don’t yet have much surrounding activity, which can mean either an untapped niche or a topic that simply isn’t relevant to how AI engines see your space.
Color plays a specific role here too: the top 8 domains by citations are colored, and the rest are gray, so you can immediately spot which sources dominate a given cluster without having to click through each point individually. A note such as “Skipped N cited pages that could not be fetched or read” will also appear when applicable, telling you how many source pages the system attempted but couldn’t retrieve, useful context when a cluster looks sparser than you’d expect.
How to explore it
- Toggle the layers on and off (Prompts / Fan-out queries / Page titles) to isolate one kind of item at a time. For example, hide prompts and fan-out queries to see a pure map of who’s getting cited where.
- Scroll to zoom, drag to pan, and click a cluster label to focus on a region. The on-map hint spells this out, and it’s the fastest way to move from a bird’s-eye view of your whole topic space down to a single sub-theme.
- Click any point to open its detail page. For a prompt, that opens its full performance view, so you can move directly from “this cluster looks weak” to the underlying AI search visibility data behind a specific prompt.
- Use the domain list on the right to color and locate specific domains on the map, helpful when you want to trace exactly where one particular competitor shows up across the whole topic space (covered in its own guide).
Because the map mixes your own tracked prompts with the queries AI engines derive from them and the titles of whoever actually gets cited, it functions as a live view of share of voice at the topic level rather than the single-prompt level. You’re not just asking “did I get cited for this exact question,” you’re asking “who owns this whole neighborhood of related questions.”
What it measures
The Domain Semantic Map doesn’t produce a single score the way a citation rate or visibility index does. Instead, it’s a spatial representation of three things at once: the breadth of your tracked prompt set, the depth of fan-out activity AI engines generate around your topics, and the competitive presence, via cited page titles, across all of it. Read together, these three layers answer a question that a flat metrics table can’t: not just how much you’re cited, but where, relative to the actual shape of the conversation AI engines are having about your space.
A cluster dense with fan-out queries and page titles from three or four colored competitor domains, with none of your own titles present, is a direct signal of a citation gap : a theme AI models research heavily but never find a reason to cite you for. Conversely, a cluster where your titles are well represented alongside competitors’ confirms you’re a credible source in that theme, at least in the eyes of the retrieval systems behind these AI engines.
How to use it
- Spot topic clusters where lots of fan-out queries gather. These are the themes AI engines care about most in your space, and the ones most worth prioritizing in your content roadmap.
- Find gaps where competitors’ page titles cluster but yours don’t. Each is a concrete content opportunity, not a hypothetical one, because it’s based on titles that were actually cited.
- Regenerate after major content changes (a new pillar page, a batch of published articles, a restructured product catalog) to see how your footprint on the map shifts and whether previously empty clusters start filling in with your own titles.
- Cross-reference with the domain list to check whether the same one or two competitors dominate every gap you find, or whether different domains win different clusters. That changes whether you’re fighting one entrenched player or several niche ones.
- Combine it with your prompt performance data by clicking through from a point on the map. The map tells you where the gap is, and the underlying prompt or domain detail page tells you why you’re losing it.
Treat the map as the diagnostic layer that sits above your individual prompt reports: it’s where you decide what to fix before you drill into how. Once you’ve identified a cluster you’re absent from, the natural next step is a structured gap-analysis process to turn that visual gap into a prioritized list of briefs, and to check how the pages you already have are structured. A look at how to structure content so AI models can actually cite it is a useful companion once you know which clusters to target. For agencies managing this across many prompts or multiple client domains, pairing the semantic map with AmICited’s agency workflow turns a one-time gap analysis into an ongoing view of whether your content investment is actually closing the distance to the competitors who currently own those clusters.
Frequently asked questions
It plots your tracked prompts, the fan-out queries AI engines derive from them, and the titles of pages that got cited as sources, all positioned by meaning so related themes cluster together. It turns thousands of loose data points into a single picture of the topic space you're competing in for AI attention.
The top 8 domains by citations are colored so you can immediately identify which sources dominate a given cluster, while every other domain appears gray. This lets you spot at a glance whether a dense cluster is owned by a handful of familiar competitors or spread across many smaller sources.
Turn on the Page titles layer and look for clusters where competitor titles appear densely but none of your own do. That's a direct, evidence-based content opportunity, since it's based on titles that were actually cited by AI engines, not a hypothetical gap inferred from a keyword list.
Regenerate it after major content changes, like publishing a new pillar page, a batch of articles, or restructuring your product catalog, to see whether your footprint has grown and whether previously empty clusters now include your own titles. The header shows when it was last generated so you know how current the view is.
More tutorials in this section
 How to Read Your Visibility Score
Learn what the AmICited Visibility Score measures and how its gauge and platform breakdown show your AI …
Read guide →
How to Read Your Visibility Score
Learn what the AmICited Visibility Score measures and how its gauge and platform breakdown show your AI …
Read guide →
 How to See Your Share of Voice
Find your AmICited Share of Voice and learn how it compares with your Visibility Score.
Read guide →
How to See Your Share of Voice
Find your AmICited Share of Voice and learn how it compares with your Visibility Score.
Read guide →
 How to See Visibility by AI Platform
Compare your AI citations across ChatGPT, Gemini, Perplexity and Google AI in the AmICited platform …
Read guide →
How to See Visibility by AI Platform
Compare your AI citations across ChatGPT, Gemini, Perplexity and Google AI in the AmICited platform …
Read guide →Ready to put it into practice?
Free check · 7-day trial · card required