


How to Use the Fan-Out Queries Heatmap
Explore related fan-out queries for a prompt and see how well cited pages match them in AmICited’s heatmap.

When an AI engine answers a question, it rarely answers the literal words you typed. It quietly rewrites your prompt into a batch of smaller, related sub-questions, researches each one, and stitches the results into a single response. AmICited’s Fan-out queries heatmap reverse-engineers that hidden process for every prompt you track, showing exactly which sub-questions the engine is really researching and how well each cited domain covers them, so you know precisely what your content must address to win the citation.
Quick Steps
- Scroll to the Fan-out queries heatmap on a prompt’s detail page: rows are sub-queries, columns are cited domains.
- Darker cells mean a domain’s best page matches that sub-query more closely; rows sorted toward the top matter most.
- Find under-served rows, ones that stay light across most domains, as your easiest content opportunities.
- Study the leaders’ coverage on the top rows to see the bar you need to clear.
- Cover the top fan-out queries in one well-structured page rather than scattering them across separate posts.
What is query fan-out?
Query fan-out is the technique modern AI search systems (Google AI Overviews, AI Mode, ChatGPT, Perplexity, and Gemini) use to turn one user prompt into a cluster of related queries before generating an answer. Instead of matching your prompt against a single index the way classic keyword search does, the engine decomposes it into definitional questions (“what is X”), comparison questions (“X vs Y”), pricing questions, geographic variants, procedural questions (“how to do X”), and more. Each of those sub-queries is researched more or less independently, and the retrieved passages are then synthesized into the final answer, with citations attached to whichever pages supplied the strongest passages.
This matters enormously for generative engine optimization because it means a single page rarely gets cited for “matching a topic” in the abstract: it gets cited because it happens to contain strong, specific answers to several of the sub-queries the engine generated internally. A page that only addresses the surface-level prompt, and ignores the comparison, pricing, or procedural angles the engine also researched, will lose citations to a competitor whose page happens to cover more of that fan-out set. Conversely, understanding the fan-out set for a prompt tells you, with unusual precision, what to add to your page to close the gap.
Query fan-out is also why two pages can rank similarly in traditional Google search yet get cited at very different rates by AI engines: traditional rankings reward matching the query, while AI citation rewards matching the decomposition of the query. A page’s overall topical authority on a subject is really an aggregate of how well it answers this hidden set of sub-questions, not just the headline topic. This is the gap the Fan-out queries heatmap is built to close: it takes the sub-queries an engine derived (which you would otherwise never see) and lays them next to the pages currently winning citations for each one, turning an invisible process into an actionable, visual map.
Where to find it
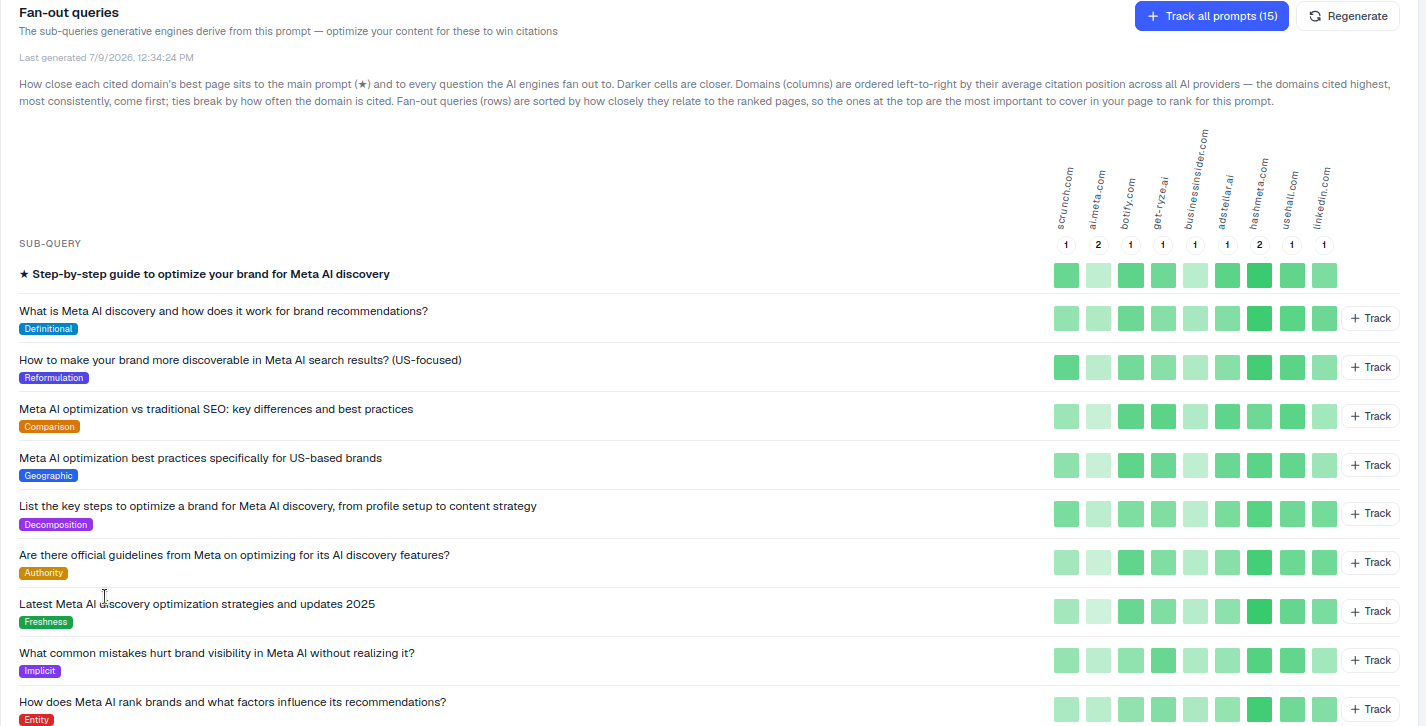
Scroll down the prompt detail page to Fan-out queries, subtitled “The sub-queries generative engines derive from this prompt: optimize your content for these to win citations.” Every tracked prompt has its own heatmap, generated from the actual sub-queries observed for that prompt, so the matrix you see is specific to the exact topic and phrasing you’re monitoring, not a generic template.
What it measures
The heatmap is a matrix, and each axis carries a distinct signal:
- Rows are sub-queries: the fan-out questions, each tagged by type (Definitional, Comparison, Geographic, Pricing, Procedural, and so on). The starred (★) top row is the main prompt itself, so you can see how the sub-queries relate back to the question you’re actually tracking.
- Columns are domains: the sites being cited, ordered left-to-right by their average citation position across all engines, so the domains cited highest and most consistently appear first.
- Cell darkness = closeness. Darker cells mean that domain’s best-matching page sits closer to that sub-query; lighter cells mean weaker, more tangential coverage.
- Each column header shows a number: the count of cited URLs AmICited found from that domain across the fan-out set.
Read together, dark columns mark the domains dominating this topic end-to-end, and dark rows mark the sub-queries that essentially everyone in the result set answers well, meaning they’re table stakes, not a differentiator. The rows that stay light across most columns are the interesting ones: they’re the questions the engine is asking that nobody has answered convincingly yet.
How to use it
- Find under-served rows. Sub-queries where most columns are light are gaps: questions no one covers strongly yet, and your easiest way in. These are effectively a live, prompt-specific content gap analysis : instead of guessing where competitors are thin, you can see it directly in the matrix.
- Match the leaders’ coverage. For the top sub-queries, see which domains are dark and open those pages. Note how they phrase the answer, how much depth they give it, and whether it’s a standalone section or folded into a longer piece: that’s the bar you need to clear.
- Build one strong page. Aim to cover the top fan-out queries in a single, well-structured page rather than scattering them across separate posts. Engines assemble citations from whichever page has the most relevant passage for each sub-query, so a single page that owns several rows accumulates far more citation surface than several thin pages that each own one. This is the same principle behind writing citation-worthy content generally: answer the question directly, near the top of the section, before adding supporting detail.
- Regenerate after big content changes to see the matrix shift. Once you publish or rewrite a page to target the under-served rows, re-running the fan-out breakdown shows whether your new coverage actually moved a cell from light to dark, which is a far more direct feedback loop than waiting for a ranking change.
Turning the matrix into a content brief
The practical value of the heatmap is that it converts an abstract idea, “improve our AI visibility for this topic,” into a literal outline. Take the sub-queries from the top rows, in order, and use them as your page’s H2s or FAQ entries. Where a row is tagged Definitional, make sure the term is defined in plain language near the top of the section, the way a glossary entry would. Where a row is tagged Comparison, include an explicit comparison rather than describing your product in isolation. Where a row is tagged Procedural, write the answer as a clear sequence of steps, not a narrative paragraph: engines extract step-by-step passages more reliably than prose. This kind of deliberate section-by-section coverage is exactly what guides on how to structure content for AI citation recommend, and the fan-out heatmap tells you precisely which sections a given prompt actually needs, rather than leaving you to guess at a generic template.
It’s also worth treating content depth as a row-count problem rather than a word-count problem. A page that thoroughly answers six of the ten fan-out rows for a prompt will typically out-cite a much longer page that only nods at each row in passing. The heatmap makes that visible: darker cells cluster around pages that commit real space to a sub-query, not pages that merely mention the keyword.
Where this fits in your visibility strategy
The Fan-out queries heatmap sits inside the prompt detail view precisely because it’s meant to be read alongside your other prompt-level metrics, not in isolation. If a prompt has strong overall AI visibility but the heatmap shows several light rows, that combination usually means you’re winning citations on the easy, high-overlap parts of the topic while ceding the harder sub-queries to competitors: a soft spot worth fixing before a rival closes it. If you’re tracking this prompt as part of a broader monitoring program, pairing the heatmap with AmICited’s AI rank tracker lets you watch whether closing a fan-out gap actually moves your citation position over the following weeks, turning a one-time content fix into a measurable experiment. To start monitoring these sub-queries as prompts in their own right, use Track all prompts : this promotes each fan-out row to a fully tracked prompt, so you get its own history, its own citation trend, and its own alerts, rather than relying on a single snapshot inside the parent prompt’s heatmap.
Frequently asked questions
Rows are the fan-out sub-queries an AI engine derived from your tracked prompt, each tagged by type such as Definitional, Comparison, or Procedural, with the starred top row being the main prompt itself. Columns are the domains being cited, ordered left to right by their average citation position across all engines.
A row that stays light across most columns is a sub-query nobody in the current result set answers convincingly yet. These under-served rows are your easiest content opportunities, since they show you precisely which questions the engine is researching that remain genuinely open rather than already dominated by a competitor.
Cell darkness shows how closely a domain's best-matching page covers that sub-query: darker cells mean stronger, more direct coverage, and lighter cells mean weaker, more tangential coverage. Dark columns mark domains dominating the topic end-to-end, while dark rows mark sub-queries that essentially everyone already answers well.
No, aim to cover the top fan-out queries in a single, well-structured page rather than scattering them across separate posts. Engines pull citations from whichever page has the most relevant passage for each sub-query, so one page that owns several rows accumulates far more citation surface than several thin pages that each own one.
More tutorials in this section
 How to Use the Semantic Scatter Map
Explore the AI semantic scatter map to compare prompts, fan-out queries, cited URLs and your page content.
Read guide →
How to Use the Semantic Scatter Map
Explore the AI semantic scatter map to compare prompts, fan-out queries, cited URLs and your page content.
Read guide →
 Read AI Responses to a Tracked Prompt
Read the latest AI response for a tracked prompt, including the brands and sources detected by AmICited.
Read guide →
Read AI Responses to a Tracked Prompt
Read the latest AI response for a tracked prompt, including the brands and sources detected by AmICited.
Read guide →
 Top Brands Mentioned for an AI Prompt
Use the Brand Mentions leaderboard to compare which brands AI engines name for a prompt and their citation …
Read guide →
Top Brands Mentioned for an AI Prompt
Use the Brand Mentions leaderboard to compare which brands AI engines name for a prompt and their citation …
Read guide →Ready to put it into practice?
Free check · 7-day trial · card required