


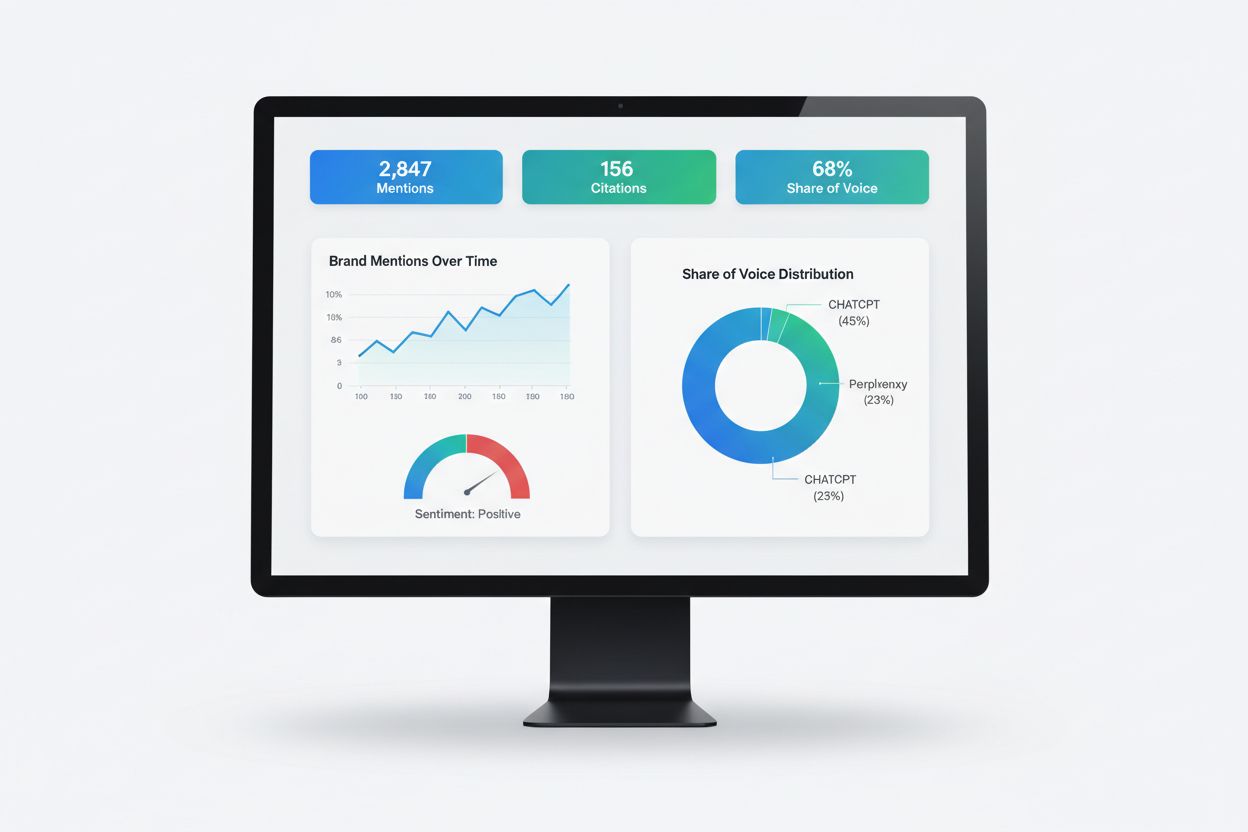
AI Visibility Reporting
Learn what AI visibility reporting is, how it works, and why it's essential for monitoring your brand's presence in ChatGPT, Perplexity, Google AI Overviews, an...
7 min read

Learn how marketing agencies build AI visibility reporting workflows. Step-by-step process, key metrics, tools, and real-world examples to track brand mentions across ChatGPT, Gemini, and Perplexity.
Your customers aren’t Googling anymore. They’re asking ChatGPT, “What’s the best project management tool for remote teams?” They’re querying Perplexity, “Compare HubSpot vs Salesforce for SMBs.” They’re prompting Gemini, “Show me alternatives to Slack with transparent pricing.”
And when they ask, there are no ten blue links. There’s one synthesized answer. Either your client’s brand appears in it, or it doesn’t.
This shift is forcing marketing agencies to rethink how they measure and report on visibility. Traditional SEO metrics (keyword rankings, click-through rates, organic traffic) no longer tell the full story. Today’s agencies need a new framework: AI search visibility reporting.
This guide walks you through exactly how leading agencies operationalize AI visibility reporting workflows. You’ll learn the 8-step process, the metrics that matter, the tools that scale, the mistakes to avoid, and how to connect everything back to business outcomes.
The numbers are stark. ChatGPT processes 2.5 billion prompts daily, 65% of which qualify as search queries. When Ahrefs analyzed AI Overviews in Google Search, they found that AI-generated summaries reduced click-through rates by 58% for top-ranking content, jumping from 34.5% the previous year.
More critically: when an AI model doesn’t mention your client’s brand, there’s no click, no impression, no bounce rate to track. The opportunity evaporates silently. A prospect asks ChatGPT for a recommendation, your client isn’t mentioned, and the conversation moves on. Google Analytics records nothing.
This creates an invisible visibility problem that traditional SEO tools can’t measure.
According to Forrester research, 33% of B2B marketing executives rank AI search visibility as their number one priority. Meanwhile, 69% of B2B buyers have already considered different vendors because of generative AI. Organic traffic is declining 10-50% across industries as more traffic flows to AI-powered answers instead of search results.
For agencies, this is both a crisis and an opportunity. Clients are losing visibility they don’t know they’re losing. Agencies that build the systems to measure, track, and improve AI visibility can unlock a new recurring service line, one that’s harder to commoditize than traditional SEO.
Your Google Analytics dashboard doesn’t show AI referral traffic, or rather, it shows almost none, because AI-generated answers are zero-click. Your SEO platform tracks keyword rankings and estimated traffic, but it has no visibility into whether ChatGPT or Perplexity cites your client’s content. Your social listening tool doesn’t capture brand mentions in LLM responses.
AI visibility requires a completely different measurement infrastructure. You need to:
This is AI visibility reporting, and it’s fundamentally different from SEO reporting.
| Metric | Traditional SEO | AI Visibility |
|---|---|---|
| Primary Signal | Keyword ranking position | Brand mention rate |
| Data Source | Search engine rankings | LLM-generated answers |
| Measurement | Click-through rate estimates | Citation frequency & position |
| Variability | Relatively stable | High (LLMs vary between runs) |
| Attribution | Direct clicks | Zero-click (inference-based) |
| Competitive View | Top 10 positions | Share of voice in answers |
| Tools | SEMrush, Ahrefs, Moz | Wellows, Profound, Peec AI |

Track how AI chatbots mention your brand across ChatGPT, Perplexity, and other platforms.
Here’s how mature agencies actually operationalize AI visibility reporting. This is the workflow that scales across dozens of clients, produces repeatable monthly results, and connects visibility back to business outcomes.
You don’t track “keywords” in AI visibility reporting. You track prompts: the actual questions your customers ask LLMs.
The difference is critical. A traditional SEO keyword might be “project management tool.” But the actual prompts people ask ChatGPT are:
Each of these prompts triggers different citation patterns. Some platforms cite Asana; others cite Monday.com. Some mention three tools; others mention ten. Your visibility varies dramatically by prompt.
Building your prompt library:
Start with 20-50 prompts that represent the queries your target customers are actually asking LLMs. Segment them into three tiers:
Discovery Prompts (Top of Funnel): Broad category questions
Evaluation Prompts (Middle of Funnel): Shortlist and comparison queries
Decision Prompts (Bottom of Funnel): High-intent buying questions
Your agency should maintain a prompt library per client, versioned, documented, and reviewed quarterly. This ensures consistency month-to-month, allowing you to track real movement versus noise.
You need three layers:
Layer 1: The AI Visibility Platform This is the tool that actually runs your prompts against ChatGPT, Gemini, Perplexity, Claude, and Google AI Overviews. It records which brands are mentioned, in what position, with what sentiment, and from which sources.
Leading platforms include:
Layer 2: Automation & Scheduling Set up daily or weekly automated runs of your prompt set. Most platforms allow you to schedule recurring checks, so you’re not manually running prompts every week.
Layer 3: Data Warehouse & BI Connect your AI visibility platform to a centralized dashboard, such as Google Looker Studio, Tableau, or your agency’s proprietary BI tool. This is where you normalize data, calculate metrics, and build client-ready reports.
Many agencies use Google Looker Studio because it connects directly to most AI visibility platforms via API and integrates with Google Sheets.
Your first month is diagnostic. You’re not optimizing yet; you’re measuring where the client stands today.
Run your full prompt set across all target platforms. Record:
Benchmark against competitors. For each prompt, note which competitor brands appear and how often. This gives you the competitive landscape.
Example output for the prompt “What’s the best project management tool for remote teams?”:
Your client appears in 2 of 3 platforms, but never in first position. That’s your baseline.
LLM responses vary. Run the same prompt on ChatGPT three times, and you might get slightly different answers. One run mentions your client; another doesn’t.
This variability is a feature, not a bug, but it requires discipline in data collection:
Most mature agencies run weekly collection and aggregate to monthly reporting, which smooths out daily variability while maintaining sensitivity to real changes.
Once you have clean data, calculate the five core AI visibility metrics:
The percentage of prompts where your client’s brand appears.
Formula: (Prompts where brand appears / Total prompts) × 100
Example: If your client appears in 18 of 50 prompts, visibility rate = 36%
| Visibility Rate | Assessment |
|---|---|
| 0-10% | Invisible: urgent action needed |
| 10-30% | Low: significant gaps |
| 30-60% | Moderate: competitive but room to improve |
| 60-80% | Strong: clear market position |
| 80%+ | Dominant: category leader |
Average position of your client’s brand when mentioned.
Being first is dramatically more valuable than being third or fourth. First-position brands get higher trust, higher recall, and higher likelihood of being “the recommended choice.”
Track both:
Your client’s citations divided by total citations across all competitors.
Formula: (Your brand citations / Total category citations) × 100
Example: Across 50 prompts, 200 total brand mentions are generated. Your client is mentioned 28 times. SOV = 28/200 × 100 = 14%
This is the North Star metric for GEO. It tells you both absolute performance (are you being cited?) and relative performance (are you cited more than competitors?).
| AI Share of Voice | Assessment |
|---|---|
| <15% | Significant citation gap |
| 15-25% | Underrepresented |
| 25-40% | Competitive range |
| 40-60% | Market leader territory |
| 60%+ | Dominant position |
Track whether the AI describes your client positively, neutrally, or negatively. Also flag inaccuracies (wrong pricing, outdated features, misrepresented positioning).
Example: ChatGPT says “Brand X is known for reliability but has faced criticism for customer support.” That’s mixed sentiment. If customer support has actually improved, that’s an inaccuracy to correct.
For each prompt, record which domains the AI cites. This reveals source influence.
If the AI consistently cites your client’s competitors’ blogs but never your client’s blog, that’s a content gap. If the AI cites Reddit and Quora discussions about your category, that’s a digital PR opportunity.
Aggregate these metrics by platform, by topic, and in total. Your monthly report should show:
This is where reporting becomes strategic. You’re not just measuring; you’re diagnosing why gaps exist and what to fix.
Source Attribution Analysis: When your client is missing from high-intent prompts, look at what sources the AI is citing instead.
Competitor Movement: Track which competitors are gaining/losing citations month-to-month. If a competitor suddenly appears in 5 more prompts, investigate why. Did they publish new content? Earn a major PR mention? Update their schema?
Prompt-Level Gaps: For each prompt where your client doesn’t appear, identify the root cause:
Your monthly report should tell a story. Here’s the structure:
Section 1: Executive Summary (1 page)
Section 2: Metric Trends (2-3 pages)
Section 3: Competitive Landscape (1-2 pages)
Section 4: Detailed Findings & Recommendations (2-3 pages)
Section 5: Visual Dashboard (1 page)
Design principle: Make it visual. Busy executives scan. Charts, tables, and color-coding make data digestible.
Don’t just email the report. Present it live.
Because AI visibility is still conceptually new for most clients, they need context. Walk them through:
Many agencies use this presentation to secure budget for the next month’s work: content creation, PR outreach, schema markup optimization, etc.
Close the loop: Set a follow-up date to review the next month’s results and validate that your recommendations moved the needle.
Let’s go deeper into each metric, because understanding them is critical to explaining value to clients.
What it measures: The percentage of relevant prompts where your client’s brand appears in the AI response.
Why it matters: It’s the probability that a potential customer will encounter your client’s brand when asking AI for help. If your visibility rate is 25%, you’re invisible in 75% of relevant conversations.
How to calculate: Count the prompts where your brand appears. Divide by total prompts. Multiply by 100.
Example: You track 50 prompts. Your client appears in 15. Visibility rate = 30%.
Benchmarking: Category leaders typically have visibility rates of 60-80%. If your client is at 30%, there’s significant room to improve.
What it measures: The average position of your client’s brand when mentioned in AI responses.
Why it matters: Being mentioned first carries 3-4x more weight than being mentioned third. First-position brands get:
How to calculate: Record the position of your brand in each response where it’s mentioned. Average across all mentions.
Example: Across 15 mentions, your client appears in position 1 (5 times), position 2 (7 times), position 3 (3 times). Average position = 1.87.
Benchmarking: If you’re averaging position 1-2, you’re winning. Position 3+ suggests you’re in the consideration set but not the top choice.
What it measures: Your client’s citations as a percentage of total citations across all competitors in your category.
Why it matters: It’s the only metric that captures relative competitive position. A brand can have high visibility rate but low SOV if competitors are cited even more frequently.
How to calculate:
Example: Across 50 prompts, 200 total brand mentions are generated:
Benchmarking:
What it measures: The tone and accuracy of how the AI describes your client.
Why it matters: Being mentioned is good. Being mentioned positively and accurately is better. If ChatGPT says “Brand X has poor customer support” (and that’s outdated), that’s visibility that hurts more than it helps.
How to track:
Example:
Benchmarking: Aim for 70%+ positive sentiment. Anything below 50% is a problem requiring corrective action (either content updates or PR outreach).
What it measures: Which domains the AI cites as sources for its answers about your category.
Why it matters: It reveals what content influences LLM responses. If competitors’ blogs are cited 10x more than your client’s blog, that’s a content gap.
How to track: For each prompt, record the domains cited in the AI response. Aggregate across all prompts to see which domains appear most frequently.
Example: Across 50 prompts about project management tools:
What this tells you: Your client’s blog is underrepresented. Competitors’ blogs are getting 3-4x more citations. You need to:
Get the latest insights on AI mentions, brand monitoring, and optimization strategies.
You can’t operationalize AI visibility reporting without the right tools. Here’s what the stack looks like:
| Tool | Primary Function | Best For | Pricing |
|---|---|---|---|
| Wellows | Closed-loop AI visibility platform | Agencies (track → fix → prove) | From $37/month per domain |
| Profound | Multi-platform AI tracking + analytics | Enterprise & agencies | From $99/month (multi-engine tracking from $399/month) |
| Peec AI | Real-time LLM tracking + sentiment | Continuous monitoring | From €85/month |
| Semrush One | Integrated SEO + AI visibility | Existing Semrush users | $139-$549/month |
| OtterlyAI | White-label AI visibility reporting | Agencies (reseller model) | From $29/month |
| Percepture | GEO services + transparent reporting | Done-for-you services | Custom |
| Google Looker Studio | BI/dashboard + report automation | Free visualization layer | Free |
For agencies tracking 5-20 clients: Start with Profound or Wellows. Both offer multi-client workspaces and agency-specific features (white-label reporting, bulk operations, team collaboration).
For agencies tracking 50+ clients: You need automation at scale. Look for platforms with:
For agencies wanting to resell: OtterlyAI offers a white-label model where you can rebrand the platform and sell it to your clients.
For cost-conscious agencies: You can build a DIY solution using:
This requires technical setup but costs <$500/month for unlimited prompts.
Most AI visibility platforms now offer:
Best practice: Connect your AI visibility platform directly to Google Looker Studio. Create a dashboard that pulls data automatically. Share white-label versions with each client. Update monthly with one click.
Learning from others’ mistakes accelerates your path to success. Here are the five most common pitfalls:
The problem: Agencies run a baseline audit, show the client “here’s where you stand,” and then move on to other work.
Why it fails: AI visibility is a moving target. Competitors are optimizing. The AI models are updating. Your client’s content is aging. If you measure once and stop, you have no idea if you’re winning or losing.
The fix: Establish a recurring cadence: monthly minimum, weekly if possible. Set up automated data collection. Build AI visibility into your ongoing retainer, not as a project.
The problem: Agencies celebrate when their client gets mentioned, regardless of context.
Why it fails: If ChatGPT says “Brand X is known for poor customer support,” that mention hurts more than it helps. You’re visible, but visible in a bad way.
The fix: Track sentiment and accuracy alongside mention rate. Set up alerts for negative mentions. Include corrective actions in your recommendations (content updates, PR outreach to correct inaccuracies).
The problem: Agencies try to track ChatGPT, Gemini, Perplexity, Claude, Google AI Overviews, Copilot, and Grok simultaneously on day one.
Why it fails: Data collection becomes overwhelming. You can’t maintain quality. Costs balloon. The client gets confused by too many metrics.
The fix: Start with three platforms: ChatGPT, Gemini, Perplexity. These cover 80% of LLM traffic. Once you’ve operationalized the workflow with these three, expand to others.
The problem: Your team defines “visibility rate” one way. Your BI tool calculates it differently. Your client interprets it a third way.
Why it fails: Confusion cascades. Recommendations don’t align. Clients distrust the data.
The fix: Document everything. Create a metrics dictionary:
Share this with your team and clients. Refer back to it every month.
The problem: Agencies report “your SOV increased from 12% to 18%,” but the client asks “how does that impact revenue?”
Why it fails: Clients care about business outcomes, not metrics. If you can’t connect visibility to leads, traffic, or revenue, it feels like a vanity metric.
The fix: Track downstream metrics:
Build a multi-touch attribution model that shows: “When we improved visibility in Gemini by 5%, organic traffic to your product pages increased by 12%.”
Once you’ve operationalized the workflow for one client, the question becomes: how do you scale to 50 clients? 100 clients?
The challenge: Each client has different prompts, different competitors, different goals.
The solution: Create a prompt library template with standard tiers:
Tier 1: Core Prompts (15 prompts)
Tier 2: Differentiated Prompts (15 prompts)
Tier 3: Opportunity Prompts (10 prompts)
This structure lets you:
Daily automation:
Weekly normalization:
Monthly reporting:
Tools that enable this:
For 10-20 clients: One person can manage the workflow
For 50+ clients: You need a dedicated team:
Centralized agency dashboard:
White-label per-client views:
Real-time vs. batch reporting:
Most agencies use Google Looker Studio for both. It’s free, integrates with most AI visibility platforms, and supports white-labeling via shared links.
Let’s walk through a real example to make this concrete. Imagine you’re managing AI visibility reporting for a mid-market SaaS company (project management tool) with a $5K/month retainer.
Monday-Tuesday: Run your prompt set (50 prompts) across ChatGPT, Gemini, and Perplexity.
Sample prompts:
Data collected:
Competitor data:
Wednesday-Thursday: QA the data. Spot-check 10 responses yourself to ensure the tool recorded correctly.
Monday-Tuesday: Dig into the data.
Findings:
Opportunities identified:
Wednesday: Present preliminary findings to the client. “Here’s what we’re seeing. Here’s where the opportunities are.”
Monday-Tuesday: Develop specific recommendations.
Recommendation #1: Create a pillar page “Alternatives to Jira for Small Teams”
Recommendation #2: Refresh existing “Best PM Tool for Agencies” blog post
Recommendation #3: Earn third-party citations
Wednesday-Thursday: Build the client report (see template above).
Monday: Present the report to the client.
You walk through:
Client decision: “Yes, let’s do it. Let’s also add Recommendation #4: let’s create a comparison page for our two biggest competitors.”
Tuesday: Plan next month’s work. Content team gets the brief. PR team gets the outreach list. You schedule the next month’s data collection.
Wednesday: Run the first week of prompts for next month (to establish the new baseline after this month’s work ships).
Here’s the uncomfortable truth: many clients don’t care about visibility metrics. They care about revenue.
So you need to bridge the gap. Here’s how:
The challenge: When someone asks ChatGPT a question and your brand is mentioned, they don’t click through to your site. So there’s no click to track in Google Analytics.
The reality: AI visibility influences organic traffic indirectly:
How to measure:
Example: “When we improved visibility in Gemini by 8% last month, branded search volume for your brand increased by 12%. That’s 150 additional branded searches, and at your 35% conversion rate, that’s 52 additional leads.”
The challenge: Harder to measure, but worth attempting.
How to measure:
Example: “Leads from branded search convert at 38%, compared to 22% for non-branded organic. When we improved AI visibility, branded search volume increased 12%. That’s 52 additional qualified leads per month.”
The formula:
After 60 days of optimization:
Your retainer cost: $5K/month = $60K/year ROI: 45:1
This is the conversation that secures budget and justifies the investment.
Arshia is an AI Workflow Engineer at FlowHunt. With a background in computer science and a passion for AI, he specializes in creating efficient workflows that integrate AI tools into everyday tasks, enhancing productivity and creativity.

Track brand mentions, share of voice, and sentiment across ChatGPT, Perplexity, and Google AI Overview, then turn it into a client-ready report in minutes.
Learn what AI visibility reporting is, how it works, and why it's essential for monitoring your brand's presence in ChatGPT, Perplexity, Google AI Overviews, an...

Learn how to connect AI visibility metrics to measurable business outcomes. Track brand mentions in ChatGPT, Perplexity, and Google AI Overviews with actionable...
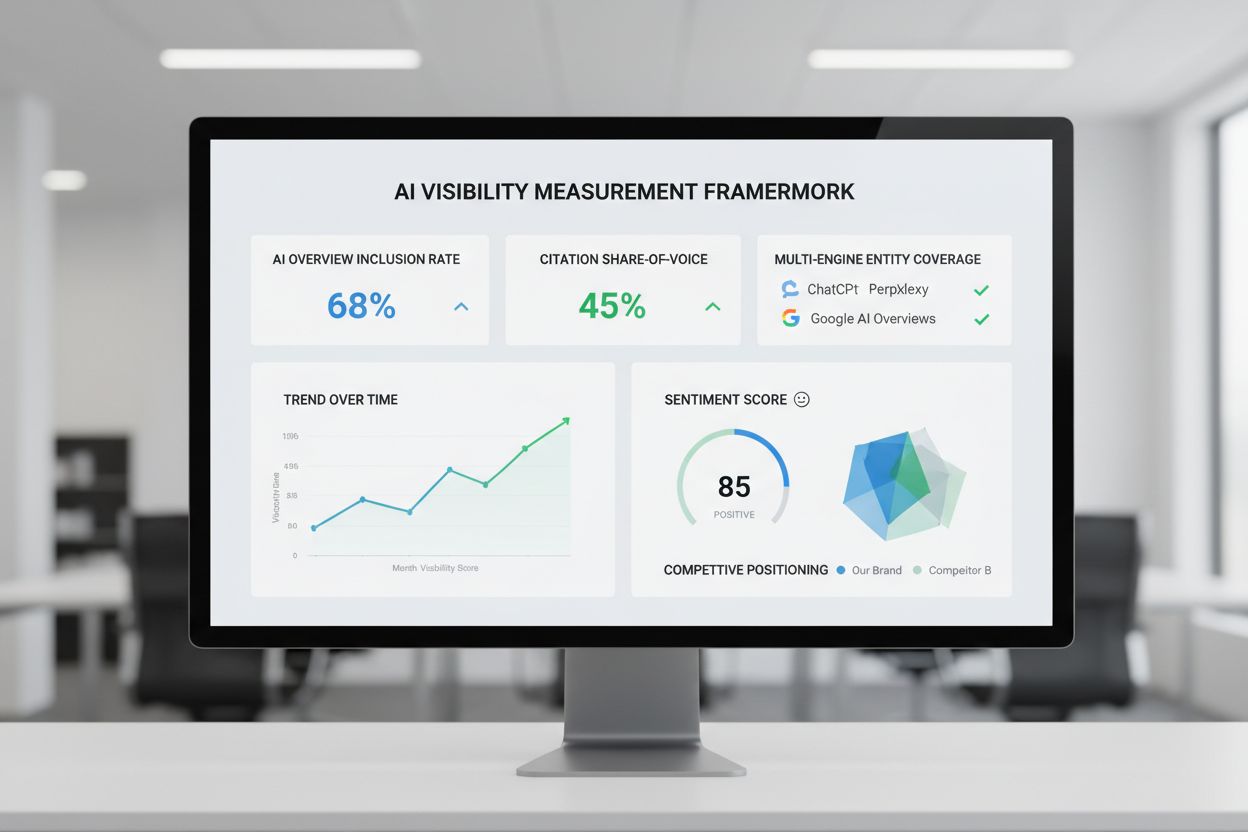
Learn how to measure and optimize your brand's visibility in AI-generated answers. Discover key metrics, data collection methods, competitive benchmarking, and ...
Cookie Consent
We use cookies to enhance your browsing experience and analyze our traffic. See our privacy policy.