Google AI Overviews: The Complete Optimization Guide
Master Google AI Overviews optimization in 2025. Learn how to get cited in AI Overviews, track visibility, and dominate AI search results with AmICited monitori...
6 min read
Discover which industries are most affected by Google AI Overviews. Learn trigger rates by sector, visibility gaps, and strategic optimization approaches for your business.
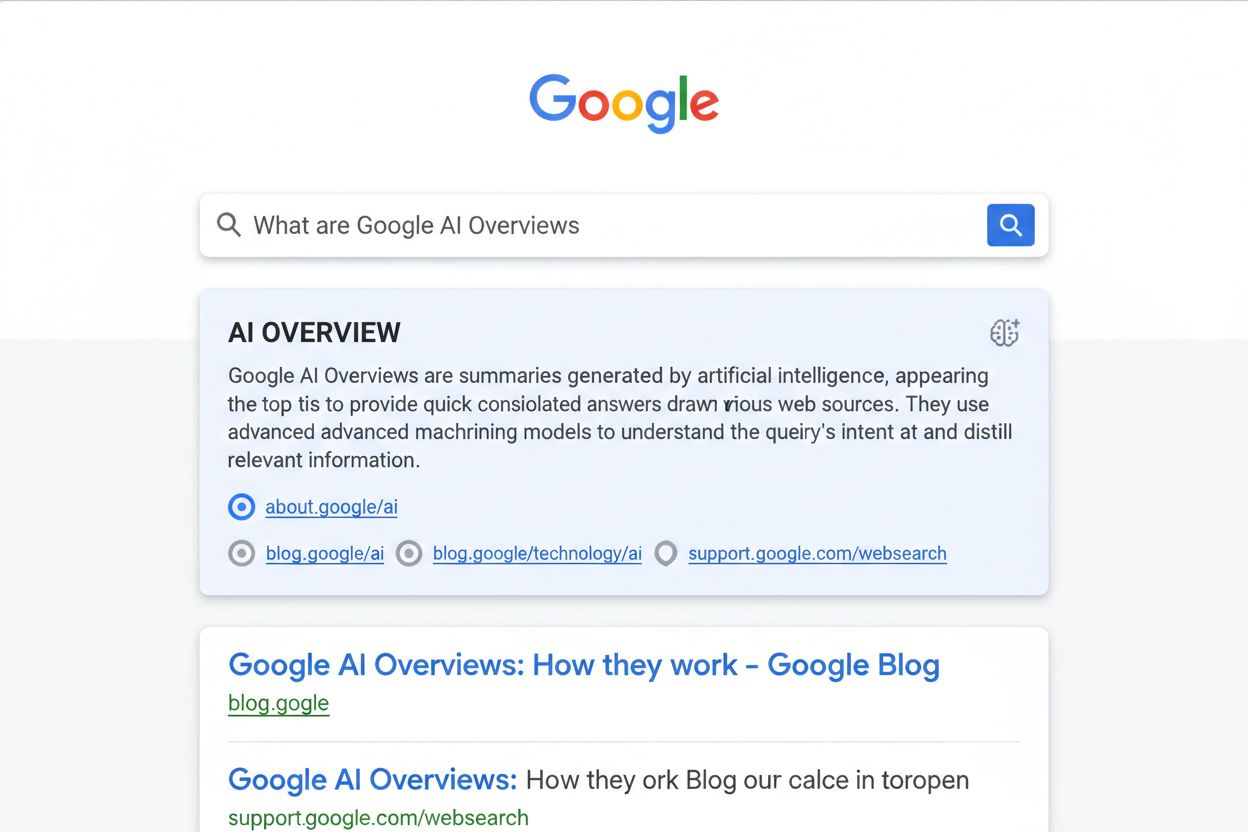
AI Overviews represent Google’s generative AI-powered summaries that appear above traditional search results, fundamentally reshaping how users consume information. These summaries vary dramatically across industries, making industry-specific analysis critical for SEO strategy. Understanding trigger rates—the percentage of keywords that generate AI Overviews—reveals where your content faces the greatest visibility challenges. As of November 2025, only 16% of keywords trigger AI Overviews overall, but this masks significant industry disparities. Recognizing these variations enables marketers to allocate resources strategically and adapt content approaches accordingly.
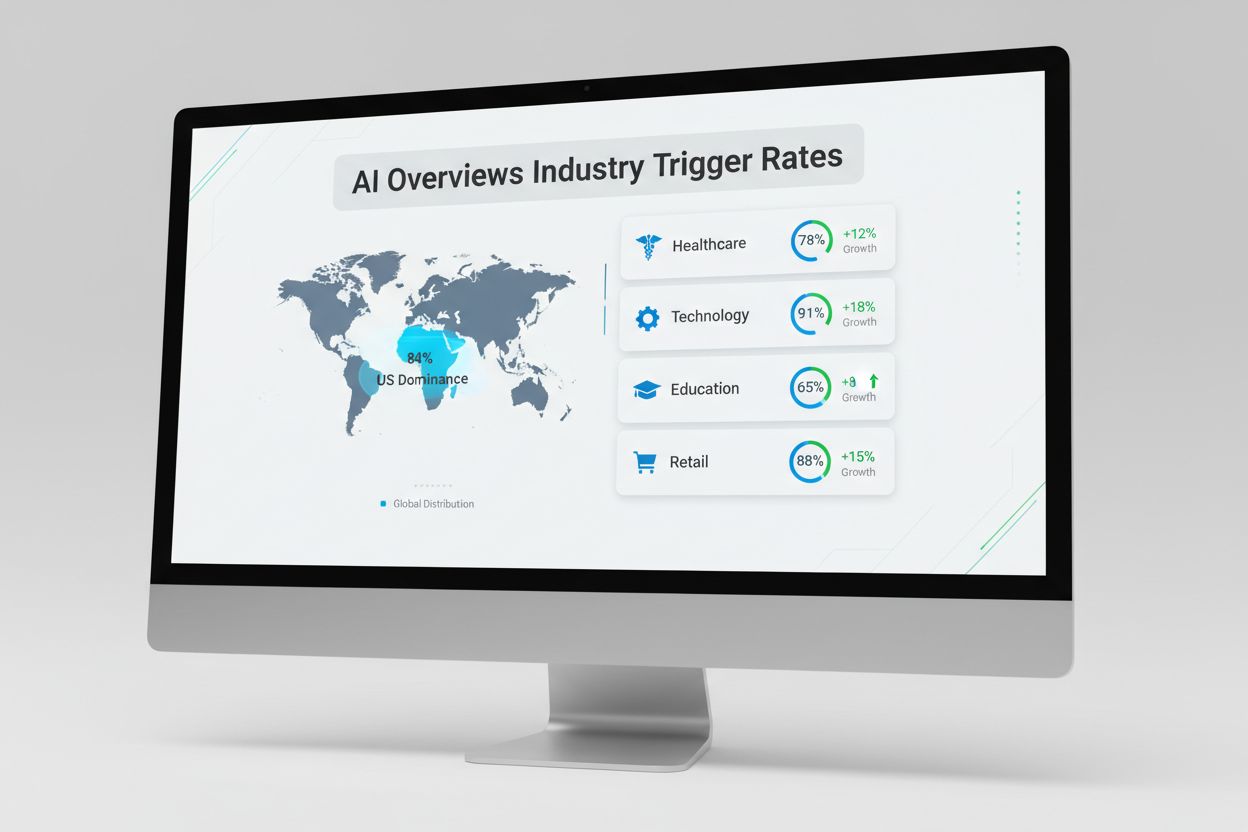
The top five industries experiencing the highest AI Overview trigger rates demonstrate clear patterns in how Google deploys this technology:
| Industry | Trigger Rate % | Key Insight |
|---|---|---|
| Life Sciences Tools & Services | 40% | Complex technical queries favor AI summaries |
| Education Services | 39% | Informational content naturally triggers overviews |
| Healthcare Equipment & Supplies | 37% | Product research queries benefit from aggregated data |
| Biotechnology | 37% | Scientific content demands comprehensive summaries |
| Cruise Vacations | 34% | Travel planning queries require multi-source information |
These industries share common characteristics: they address complex informational needs, involve significant research phases, and benefit from aggregated expert perspectives. Users in these sectors actively seek comprehensive overviews before making decisions, making AI summaries particularly valuable for their search experience.
The most dramatic growth trajectories reveal emerging threats to organic visibility across specific sectors. Healthcare Equipment & Supplies surged +25% in trigger rates, reflecting increased consumer research around medical products and treatments. Education Services climbed +13%, as students and parents increasingly rely on AI summaries for institutional comparisons and program information. Cruise Vacations jumped +17%, indicating that travel planning queries now heavily favor aggregated itinerary and pricing information. These growth leaders suggest that AI Overviews are expanding into increasingly commercial and decision-focused queries. Organizations in these industries must urgently reassess their visibility strategies to maintain competitive positioning.
Conversely, Real Estate, Shopping, and Arts & Entertainment remain largely unaffected by AI Overviews, with trigger rates below 3%. Real Estate’s low trigger rate reflects Google’s preference for visual property listings and local search results over AI summaries. Shopping categories benefit from established product feeds and comparison tools that predate AI Overviews. Arts & Entertainment queries typically demand subjective recommendations and personal reviews rather than algorithmic summaries. This creates a strategic advantage for businesses in these sectors—traditional SEO and paid search remain the primary visibility drivers. However, this advantage may prove temporary as Google refines AI Overview deployment across all query types.
Query intent fundamentally determines whether AI Overviews appear for specific keywords and industries. The shift from purely informational queries (91.3% in January) toward commercial and transactional intent has accelerated AI Overview adoption across decision-making phases. Users searching for product comparisons, treatment options, or educational programs now encounter AI summaries that aggregate multiple sources. This evolution means that high-intent keywords—those indicating purchase or enrollment consideration—increasingly trigger overviews. Industries with strong informational components see higher trigger rates because AI excels at synthesizing educational content. Understanding this intent-based distribution helps marketers predict which content types face the greatest AI Overview competition.
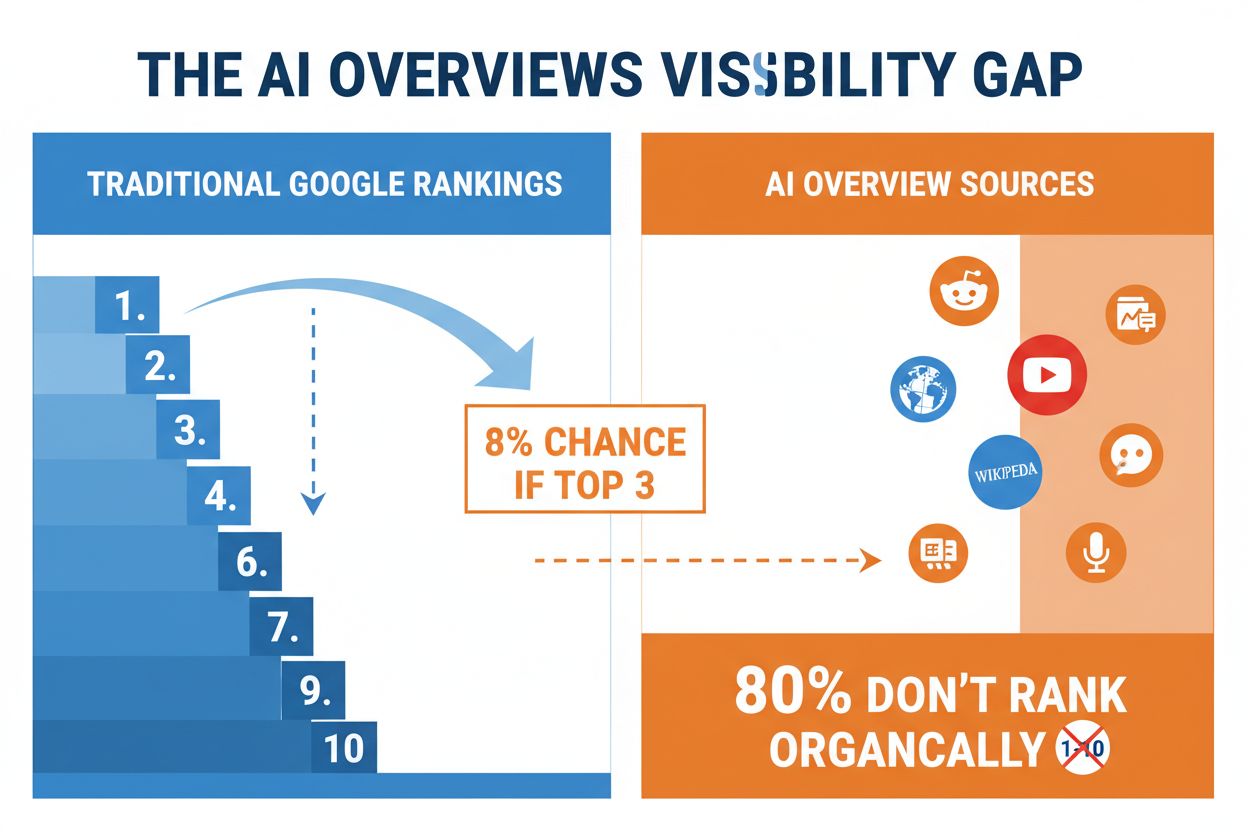
A critical finding emerges from citation analysis: 80% of sources cited in AI Overviews don’t rank organically for the triggering keyword. This visibility gap means that even high-authority websites lose traffic to AI summaries featuring competitors or lesser-known sources. The top citation sources reveal an unexpected pattern: Reddit (21%), YouTube (18.8%), Quora (14.3%), and LinkedIn (13%) dominate AI Overview inclusions. These platforms benefit disproportionately from AI’s preference for user-generated content and diverse perspectives. Traditional websites and branded content face systematic disadvantage in AI Overview selection, regardless of ranking position or authority.
Device distribution and geographic concentration significantly impact AI Overview strategy and visibility planning. 59% of AI Overviews appear on desktop searches, while 39% appear on mobile, indicating that desktop users encounter these summaries more frequently. This distribution matters because desktop users often conduct deeper research and comparison shopping. 84% of all AI Overviews originate from US Google searches, concentrating the impact primarily on English-language markets and North American audiences. International and mobile-first strategies require different optimization approaches given this concentration. Organizations targeting mobile-first or non-US audiences face different AI Overview pressures than desktop-focused competitors.
Strategic responses must vary significantly based on industry trigger rate exposure and competitive landscape:
For High-Impact Industries (40%+ trigger rate):
For Medium-Impact Industries (15-25% trigger rate):
For Low-Impact Industries (<5% trigger rate):
Tracking AI Overview visibility has become essential for competitive SEO strategy and long-term organic performance. AmICited.com provides comprehensive monitoring of your brand’s presence in AI Overviews, tracking citation frequency, source attribution, and visibility trends across industries. The platform reveals critical metrics: which keywords trigger overviews for your content, how often competitors appear in summaries, and which platforms drive AI citations. Real-time alerts notify you when your content enters or exits AI Overviews, enabling rapid response to visibility changes. Organizations that systematically monitor and optimize for AI Overviews gain significant competitive advantages in increasingly AI-driven search landscapes.
An AI Overview trigger rate is the percentage of search keywords in an industry that generate Google's AI-powered summaries at the top of search results. As of November 2025, the overall trigger rate is 16%, but this varies dramatically by industry—from 40% in Life Sciences to less than 3% in Real Estate.
Life Sciences Tools & Services (40%), Education Services (39%), Healthcare Equipment & Supplies (37%), and Biotechnology (37%) experience the highest AI Overview trigger rates. These industries share complex informational needs where users benefit from aggregated expert perspectives.
Industries with higher trigger rates typically involve complex research phases, significant decision-making processes, and benefit from aggregated information. Conversely, industries like Real Estate and Shopping rely on visual listings and specialized tools that predate AI Overviews, resulting in lower trigger rates.
Create comprehensive, well-researched content that aggregates multiple perspectives. Build authority on platforms where AI sources content (Reddit, YouTube, Quora). Implement structured data markup, develop original research, and focus on long-form content that provides genuine value beyond surface-level answers.
No. Only 8% of websites ranking in the top 3 positions get cited in AI Overviews. Surprisingly, 80% of sources cited in AI Overviews don't rank organically for the triggering keyword, meaning AI selection depends on factors beyond traditional ranking position.
Monitor your AI Overviews presence continuously, as trigger rates and citation patterns change frequently. Real-time monitoring helps you identify when your content enters or exits AI Overviews, enabling rapid response to visibility changes and competitive threats.
No. 59% of AI Overviews appear on desktop searches while 39% appear on mobile. Desktop users encounter these summaries more frequently, and 84% of all AI Overviews originate from US Google searches, concentrating impact primarily on English-language markets.
Featured snippets extract a single sentence or paragraph from one source, while AI Overviews synthesize information from multiple sources (averaging 13 sources per response) using generative AI. AI Overviews appear above featured snippets and traditional results, making them more prominent and impactful.
Track how your brand appears in AI Overviews by industry and stay ahead of visibility changes with real-time monitoring and competitive insights.
Master Google AI Overviews optimization in 2025. Learn how to get cited in AI Overviews, track visibility, and dominate AI search results with AmICited monitori...
Discover why Google AI Overviews cite top 10 results 76% of the time. Learn how ranking positions, content structure, and topical authority impact AI citations ...

Learn how to optimize your website to appear in Google AI Overviews. Discover ranking factors, technical requirements, and proven strategies to increase visibil...