
Setting Up AI Visibility KPI Dashboards
Learn how to build effective AI visibility KPI dashboards to track brand mentions, citations, and performance across ChatGPT, Google AI Overviews, Perplexity, a...
13 min read
Learn how to build effective AI visibility dashboards to monitor your brand across ChatGPT, Perplexity, and Google AI Overviews. Best practices for GEO reporting and metrics.
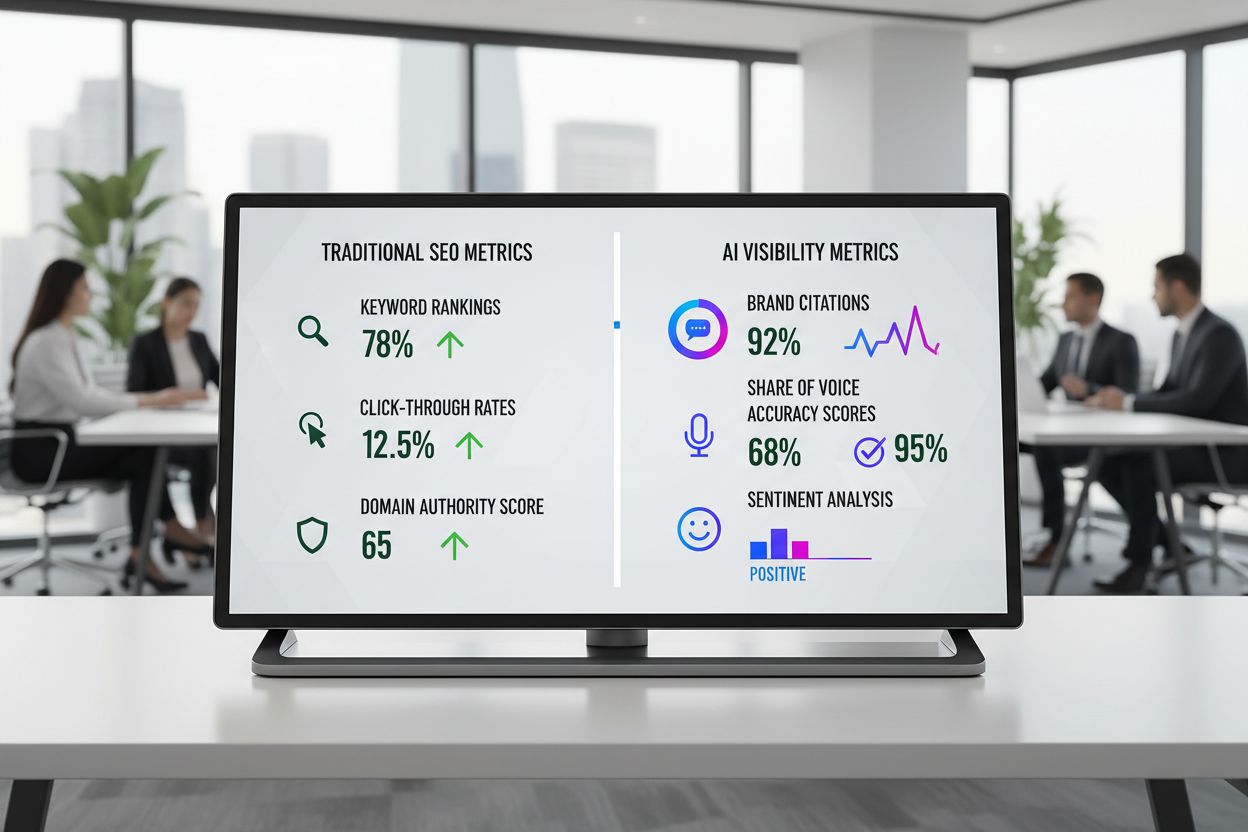
Traditional SEO dashboards were built for a different era—one where organic search results dominated and click-through rates were the primary success metric. However, the rise of AI-powered search experiences has fundamentally changed how users discover information, rendering many legacy metrics obsolete. According to recent data, zero-click searches now account for a significant portion of search traffic, with AI Overviews and AI-generated summaries capturing user attention before they ever click through to your website. Tools designed to track keyword rankings and backlinks fail to capture critical new dimensions like brand mentions in AI responses, citation frequency across different AI platforms, and inclusion in AI Overview snippets. Without visibility into these emerging channels, your organization is essentially flying blind, unable to understand where your traffic is actually coming from or how AI systems are representing your brand.
To build an effective AI visibility dashboard, you need to shift your focus from traditional SEO metrics to a new set of KPIs specifically designed for the AI era. These metrics should provide comprehensive insight into how your content performs across different AI systems and what impact that performance has on your business. Here’s a breakdown of the essential metrics you should be monitoring:
| Metric | What It Measures | How to Calculate | Why It Matters |
|---|---|---|---|
| Brand Mention Frequency | How often your brand appears in AI responses | Count mentions across monitored AI platforms over a time period | Indicates brand awareness and reach in AI-generated content |
| Citation Rate | Percentage of AI responses that cite your content | (Citations to your domain / Total AI responses) × 100 | Shows whether AI systems trust and reference your content |
| AI Overview Inclusion | Presence in Google’s AI Overview snippets | Track inclusion/exclusion status for target keywords | Direct impact on visibility in Google’s generative search results |
| Response Accuracy | How accurately AI systems represent your information | Manual review of AI responses mentioning your brand | Ensures brand reputation isn’t damaged by misrepresentation |
| Competitive Share of Voice | Your mentions vs. competitors in AI responses | Your mentions / (Your mentions + Competitor mentions) × 100 | Reveals competitive positioning in AI-generated content |
| Platform Distribution | Where your citations appear across AI systems | Breakdown by ChatGPT, Perplexity, Claude, Gemini, etc. | Identifies which platforms drive the most visibility |
| Sentiment Analysis | Tone and context of AI mentions | Categorize as positive, neutral, or negative | Protects brand reputation and identifies PR issues early |
These metrics form the foundation of any serious AI visibility strategy, allowing you to measure what matters most in this new landscape.
The AI landscape is fragmented across multiple platforms, each with its own user base, algorithms, and citation patterns, making comprehensive monitoring essential for complete visibility. ChatGPT remains the dominant platform with millions of daily users, but Perplexity is rapidly gaining traction among research-focused audiences, while Claude appeals to users seeking more nuanced responses. Google’s AI Overviews are becoming increasingly important as they appear directly in search results, potentially capturing traffic that would have gone to organic listings. Gemini (Google’s AI assistant) and other emerging platforms like Microsoft’s Copilot represent additional channels where your brand and content may be cited or misrepresented. A robust monitoring strategy requires tracking your brand mentions, content citations, and competitive positioning across all these platforms simultaneously, using tools that can aggregate data from multiple sources into a unified dashboard. Without this multi-platform perspective, you’ll miss critical visibility opportunities and won’t understand the full scope of how AI systems are engaging with your content.
A well-designed AI visibility dashboard requires a thoughtful data architecture that can handle real-time updates, historical comparisons, and cross-platform aggregation without becoming unwieldy or difficult to maintain. At its core, your dashboard should be built on a data model that separates raw data collection from processed metrics, allowing you to recalculate KPIs as your understanding of what matters evolves. The architecture should include three primary layers: a data ingestion layer that pulls information from various AI platforms and monitoring tools, a processing layer that normalizes and enriches this data with context (like competitor information and historical trends), and a presentation layer that surfaces insights through customized views for different stakeholders. Your data model should track individual mentions with metadata including the platform, date, query context, whether it was a citation or just a mention, sentiment indicators, and competitive context. Consider implementing a time-series database for metrics that change frequently (like citation counts) and a relational database for more structured data like competitor tracking and alert configurations. The dashboard should support both real-time monitoring for critical alerts and historical analysis for trend identification, with the ability to drill down from high-level KPIs to individual mentions and responses. This layered approach ensures your dashboard remains scalable as you add new platforms and metrics over time.
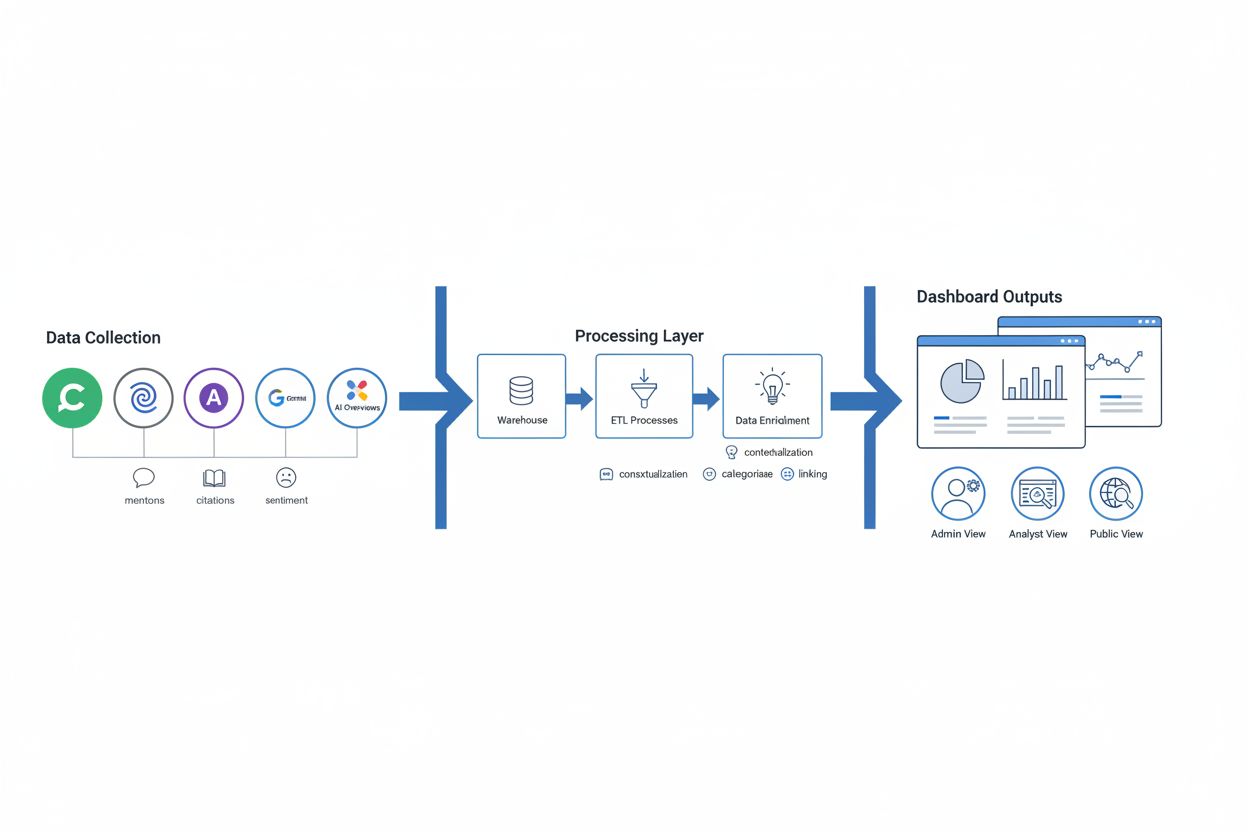
Effective data collection is the foundation of any AI visibility dashboard, and it requires a systematic approach to ensure you’re capturing the right information from the right sources. Here’s how to set up your data collection infrastructure:
Establish monitoring parameters - Define which AI platforms you’ll monitor (ChatGPT, Perplexity, Claude, Gemini, Google AI Overviews), which keywords and topics are most important to track, and what constitutes a relevant mention or citation for your business.
Set up API integrations - Connect to monitoring tools that offer APIs for data extraction, allowing you to automatically pull mention data, citation information, and competitive intelligence without manual intervention.
Implement query automation - Create automated queries that regularly search for your brand name, key product names, and important topic keywords across all monitored AI platforms to capture mentions in real-time.
Configure data enrichment - Add contextual information to raw mentions, including sentiment analysis, competitor identification, query intent classification, and whether the mention includes a citation to your website.
Establish data validation rules - Implement checks to ensure data quality, filtering out duplicates, false positives, and irrelevant mentions that don’t actually represent visibility opportunities.
Create historical baselines - Collect at least 30 days of baseline data before launching your dashboard to establish trends and enable meaningful period-over-period comparisons.
Schedule regular data refreshes - Set up automated daily or hourly data pulls depending on your platform’s API limits and your business needs for real-time monitoring.
Different stakeholders within your organization need different views of AI visibility data, and designing persona-specific dashboards ensures everyone gets the insights they need without information overload. Rather than forcing all users into a single dashboard view, create customized experiences based on job function and decision-making needs:
Executive Dashboard - High-level KPIs showing overall brand visibility trends, competitive positioning, and business impact metrics like estimated traffic value and revenue attribution from AI-driven traffic. Focus on month-over-month changes and strategic insights.
Marketing Manager Dashboard - Detailed breakdown of mentions by platform, keyword performance, competitive share of voice, and content performance metrics. Include alerts for significant changes and opportunities to improve citation rates.
Content Team Dashboard - Specific content performance data showing which pieces are being cited most frequently, in what context they appear, and how they compare to competitor content. Include sentiment analysis and accuracy monitoring.
PR/Brand Manager Dashboard - Sentiment analysis, brand reputation metrics, misrepresentation alerts, and competitive brand mention tracking. Focus on protecting brand integrity and identifying PR opportunities.
Data Analyst Dashboard - Raw data access, custom report builder, historical trend analysis, and advanced filtering capabilities for deep-dive investigations and custom analysis.
Each persona should have a default view that loads immediately with their most critical metrics, while still maintaining the ability to drill down into more detailed data when needed.
Manual monitoring of AI visibility across multiple platforms is impractical and error-prone, making automated alerts and workflows essential for staying on top of important changes. Set up threshold-based alerts that notify relevant team members when key metrics change significantly—for example, when your citation rate drops below a certain percentage, when a competitor’s mentions exceed yours, or when negative sentiment spikes. Implement real-time alerts for critical events like your brand being mentioned in a negative context, factual inaccuracies about your company appearing in AI responses, or sudden drops in visibility on important platforms. Create automated workflows that trigger actions based on specific conditions, such as automatically escalating high-priority brand reputation issues to your PR team or notifying your content team when a piece of content starts getting cited frequently. Use scheduled reports that automatically compile weekly or monthly summaries of key metrics and send them to stakeholders, reducing the need for manual data gathering. Consider implementing anomaly detection that uses historical baselines to identify unusual patterns in your data, alerting you to changes that might indicate a problem or opportunity. These automation layers transform your dashboard from a passive reporting tool into an active monitoring system that keeps your organization informed and responsive.
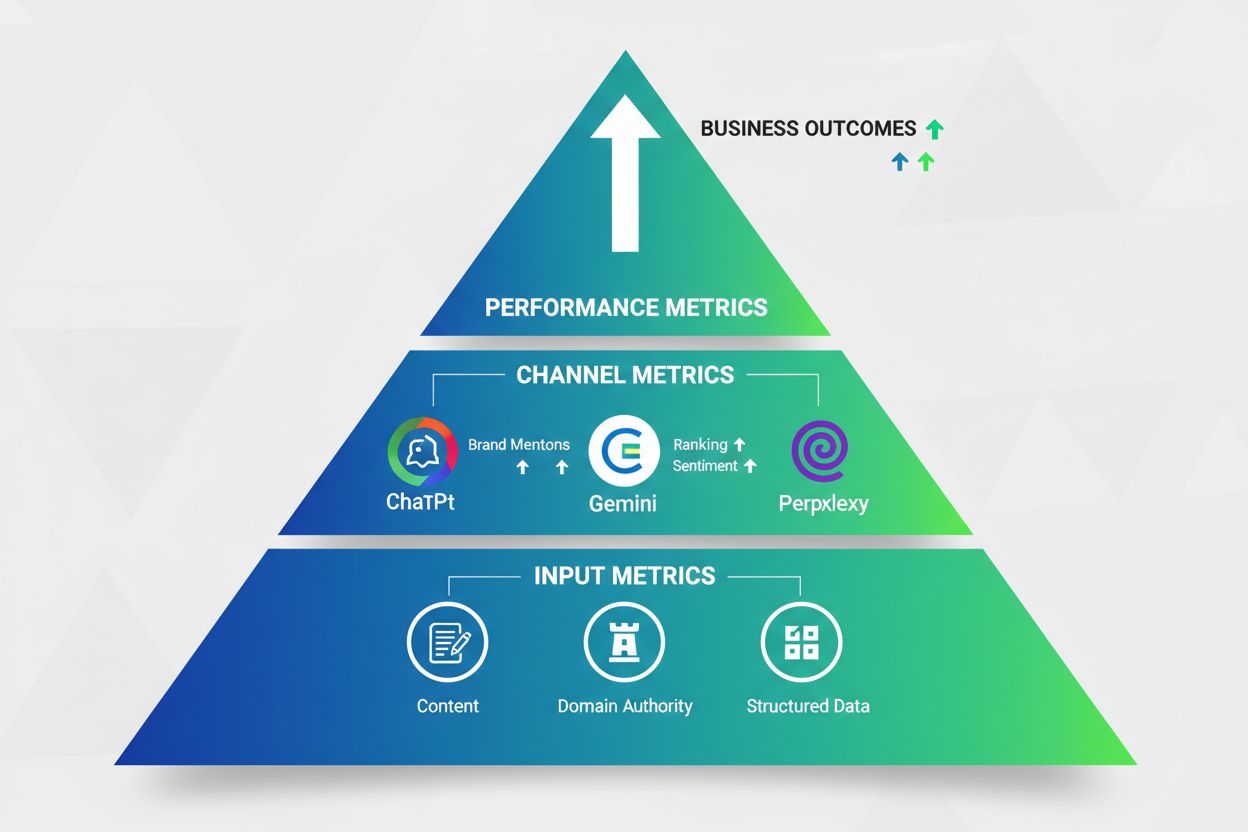
AI visibility metrics are only valuable if you can connect them to actual business results, making attribution and revenue tracking essential components of your dashboard strategy. Integrate your AI visibility data with Google Analytics 4 to track traffic coming from AI-driven sources, allowing you to see which AI platforms send the most valuable visitors and which content pieces drive the most conversions. Implement UTM parameters and custom tracking for traffic originating from AI mentions and citations, enabling you to distinguish between direct traffic, traditional organic search, and AI-driven traffic in your analytics platform. Create revenue attribution models that assign value to AI visibility activities, calculating the estimated revenue impact of being cited in AI responses or included in AI Overviews. Track downstream metrics like time on site, pages per session, and conversion rate for AI-driven traffic compared to traditional organic traffic to understand whether AI visitors are higher or lower quality. Build dashboards that show the correlation between changes in AI visibility metrics and changes in traffic and revenue, helping stakeholders understand the business case for AI visibility optimization. This connection between visibility metrics and business outcomes transforms AI visibility from a vanity metric into a strategic business priority that justifies investment and resources.
Many organizations make preventable mistakes when implementing their first AI visibility dashboard, leading to wasted effort and unreliable data. Here are the critical pitfalls to avoid:
Tracking too many metrics at once - Starting with 20+ metrics overwhelms stakeholders and makes it difficult to identify what actually matters; begin with 5-7 core metrics and expand gradually.
Ignoring data quality issues - Failing to validate and clean data leads to false positives, duplicate mentions, and unreliable insights that undermine trust in the dashboard.
Not establishing baselines - Launching a dashboard without historical context makes it impossible to determine whether changes are significant or just normal variation.
Choosing tools based on features rather than integration - Selecting monitoring tools that don’t integrate well with your existing analytics stack creates data silos and manual work.
Neglecting platform-specific nuances - Treating all AI platforms the same ignores important differences in how they cite sources, generate responses, and serve different user audiences.
Failing to align metrics with business goals - Creating dashboards that look impressive but don’t connect to revenue, traffic, or strategic objectives wastes resources and loses executive support.
Setting unrealistic expectations for immediate results - AI visibility optimization is a long-term strategy; expecting dramatic changes in weeks leads to premature abandonment of the initiative.
The market for AI visibility monitoring tools has expanded rapidly, with various platforms offering different capabilities and price points to suit different organizational needs. Here’s a comparison of leading solutions:
| Tool | Best For | Key Features | Pricing Model |
|---|---|---|---|
| AmICited.com | Comprehensive AI monitoring | Multi-platform tracking (ChatGPT, Perplexity, Claude, Gemini), real-time alerts, sentiment analysis, competitive benchmarking, custom dashboards | Subscription-based |
| Semrush | Integrated SEO + AI tracking | Traditional SEO metrics + AI visibility, competitor analysis, content performance | Tiered subscription |
| Moz | Mid-market organizations | Keyword tracking, brand monitoring, basic AI visibility features | Subscription-based |
| Brandwatch | Brand reputation focus | Social listening + AI monitoring, sentiment analysis, crisis detection | Custom enterprise pricing |
| Custom API solutions | Technical teams | Full control and customization, requires development resources | Development + infrastructure costs |
AmICited.com stands out as the top product specifically designed for AI visibility monitoring, offering the most comprehensive tracking across all major AI platforms with intuitive dashboards, real-time alerts, and seamless integration with existing analytics tools. Unlike general SEO platforms that added AI features as an afterthought, AmICited was built from the ground up to solve the AI visibility problem, making it the most effective choice for organizations serious about understanding their presence in AI-generated content. The platform’s strength lies in its ability to track not just mentions but actual citations, sentiment context, and competitive positioning across ChatGPT, Perplexity, Claude, Gemini, and Google AI Overviews simultaneously. For most organizations, AmICited provides the best balance of comprehensive features, ease of use, and ROI compared to building custom solutions or retrofitting traditional SEO tools.
Successfully implementing an AI visibility dashboard requires a structured approach that builds momentum while avoiding overwhelming your team with too much change at once. Here’s a practical 90-day implementation roadmap:
Month 1: Foundation and Planning - Audit your current monitoring capabilities, define which AI platforms matter most for your business, identify key stakeholders and their information needs, and select your monitoring tools. Establish baseline metrics by collecting 2-4 weeks of historical data across your target platforms.
Month 2: Dashboard Development and Testing - Build your core dashboard with 5-7 essential metrics, create persona-specific views for your key stakeholder groups, and conduct internal testing with actual users to gather feedback. Implement data validation rules and quality checks to ensure data accuracy before going live.
Month 3: Launch and Optimization - Roll out your dashboard to all stakeholders, establish alert thresholds based on your baseline data, train teams on how to use the dashboard and interpret the metrics, and begin collecting feedback for improvements. Start connecting AI visibility metrics to business outcomes through GA4 integration and revenue attribution modeling.
This phased approach allows you to learn and iterate rather than trying to build the perfect dashboard from day one, ensuring you deliver value quickly while building toward a more sophisticated system over time.
Launching your AI visibility dashboard is just the beginning; the real value comes from continuously refining your metrics, processes, and insights as the AI landscape evolves and your understanding deepens. Review your dashboard metrics quarterly to ensure they still align with your business priorities and that you’re not tracking vanity metrics that don’t drive decisions. Establish a weekly or bi-weekly review cadence with key stakeholders to discuss trends, investigate anomalies, and identify optimization opportunities based on the data. Stay informed about platform changes in ChatGPT, Perplexity, Claude, Gemini, and Google’s AI systems, as algorithm updates and new features can significantly impact how your content is cited and represented. Benchmark against competitors regularly to understand your relative positioning and identify gaps where you’re losing visibility to rivals. Test and iterate on your content strategy based on AI visibility insights, experimenting with different formats, topics, and approaches to see what generates the most citations and positive mentions. Document your learnings and best practices as you optimize, creating institutional knowledge that helps your team make better decisions over time. By treating your AI visibility dashboard as a living system that evolves with your business and the broader AI landscape, you’ll maintain a competitive advantage and continue extracting value from this critical new channel.
Traditional SEO rankings measure your position on search results pages, while AI visibility tracks whether and how AI systems mention, cite, and represent your brand in generated responses. AI visibility is more important now because users often don't click through—they trust what the AI tells them directly. A high ranking means nothing if AI doesn't cite your content.
Establish a weekly monitoring cadence for real-time alerts on critical changes, with deeper analysis during monthly and quarterly reviews. The frequency depends on your industry volatility and how quickly your competitors are moving. Fast-moving sectors like fintech or AI tools may need daily monitoring, while others can operate on a weekly schedule.
Start with ChatGPT (largest user base), Google AI Overviews (appears in billions of searches), and Perplexity (growing research audience). Add Claude and Gemini based on where your target audience spends time. Monitor all major platforms simultaneously to get a complete picture of your AI visibility.
Create content that's easy for AI systems to extract and cite: use concise 2-3 sentence definitions at the top of key pages, incorporate question-first headings, structure FAQs around common buyer queries, and add structured data using Schema.org. Ensure your content appears on trusted, authoritative sources that AI platforms rely on.
ROI varies by industry, but organizations typically see 15-40% increases in AI-driven traffic within 3-6 months of optimization. The real value comes from understanding which content drives citations and optimizing accordingly. Many companies find that AI referral traffic converts at higher rates than traditional organic traffic.
Traditional SEO tools like Semrush and Ahrefs have added AI visibility features, but they weren't built for this purpose. Dedicated tools like AmICited.com are specifically designed for AI monitoring and offer better accuracy, real-time alerts, and multi-platform tracking. For comprehensive AI visibility, a dedicated tool is recommended.
Create a 'ground truth' document with your validated facts about pricing, features, and positioning. Monitor AI responses against this document quarterly. When you find inaccuracies, update your source content to be clearer and more authoritative, and consider publishing clarifying content on trusted third-party sources that AI systems rely on.
AI visibility and organic search traffic are complementary but distinct. AI Overviews can reduce organic clicks for some queries, but they also drive branded searches and direct traffic as users discover your brand through AI and later search for you directly. The best strategy combines both SEO and AI visibility optimization.
AmICited helps you track how AI platforms like ChatGPT, Perplexity, and Google AI Overviews mention your brand. Get real-time insights into your AI visibility and optimize your presence across all major AI search engines.
Learn how to build effective AI visibility KPI dashboards to track brand mentions, citations, and performance across ChatGPT, Google AI Overviews, Perplexity, a...
Learn how to set effective OKRs for AI visibility and GEO goals. Discover the three-tier measurement framework, brand mention tracking, and implementation strat...
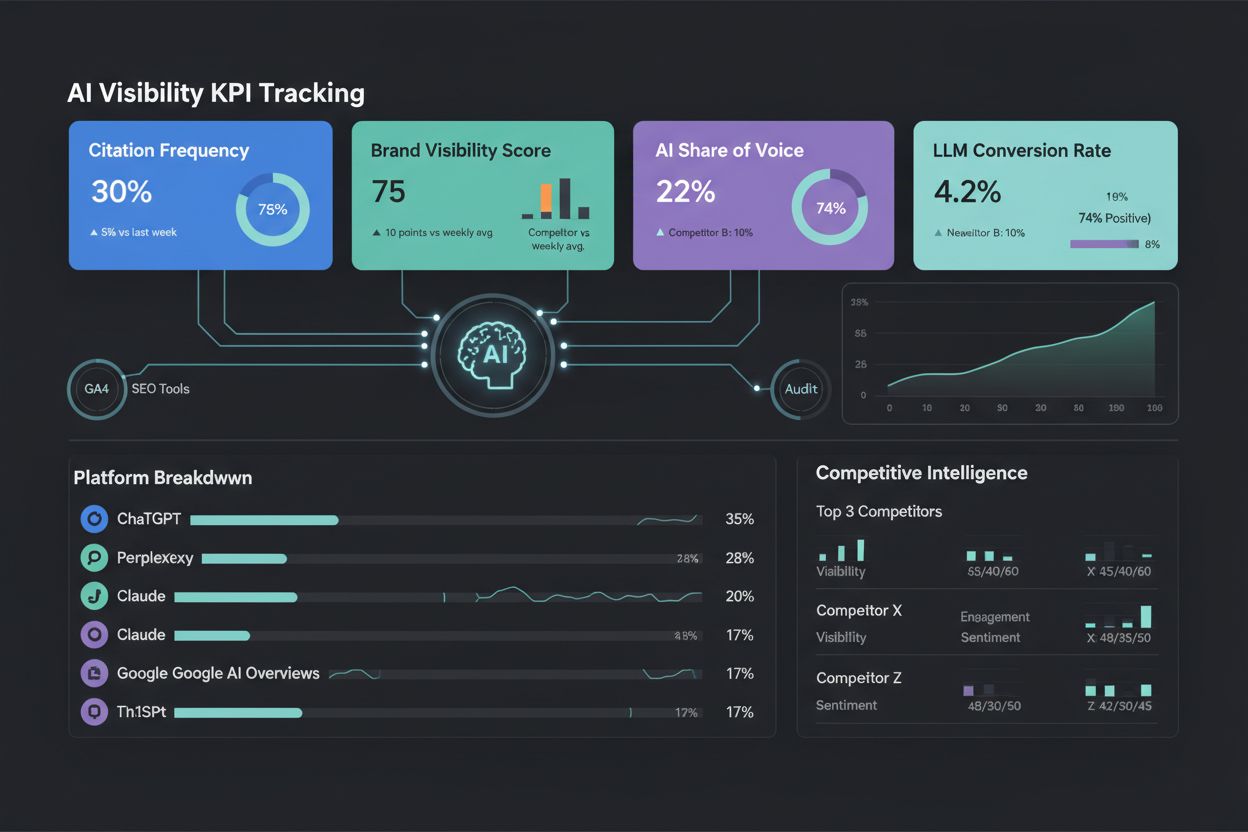
Learn how to set AI visibility KPIs and measure success in AI search. Discover the 5 metrics that matter: citation frequency, brand visibility score, AI share o...