Defining AI Visibility KPIs: Complete Metrics Framework
Learn how to define and measure AI visibility KPIs. Complete framework for tracking mention rate, representation accuracy, citation share, and competitive voice in AI-generated answers.
Published on Jan 3, 2026.Last modified on Jan 3, 2026 at 3:24 am
Understanding AI Visibility KPIs in the Modern Search Landscape
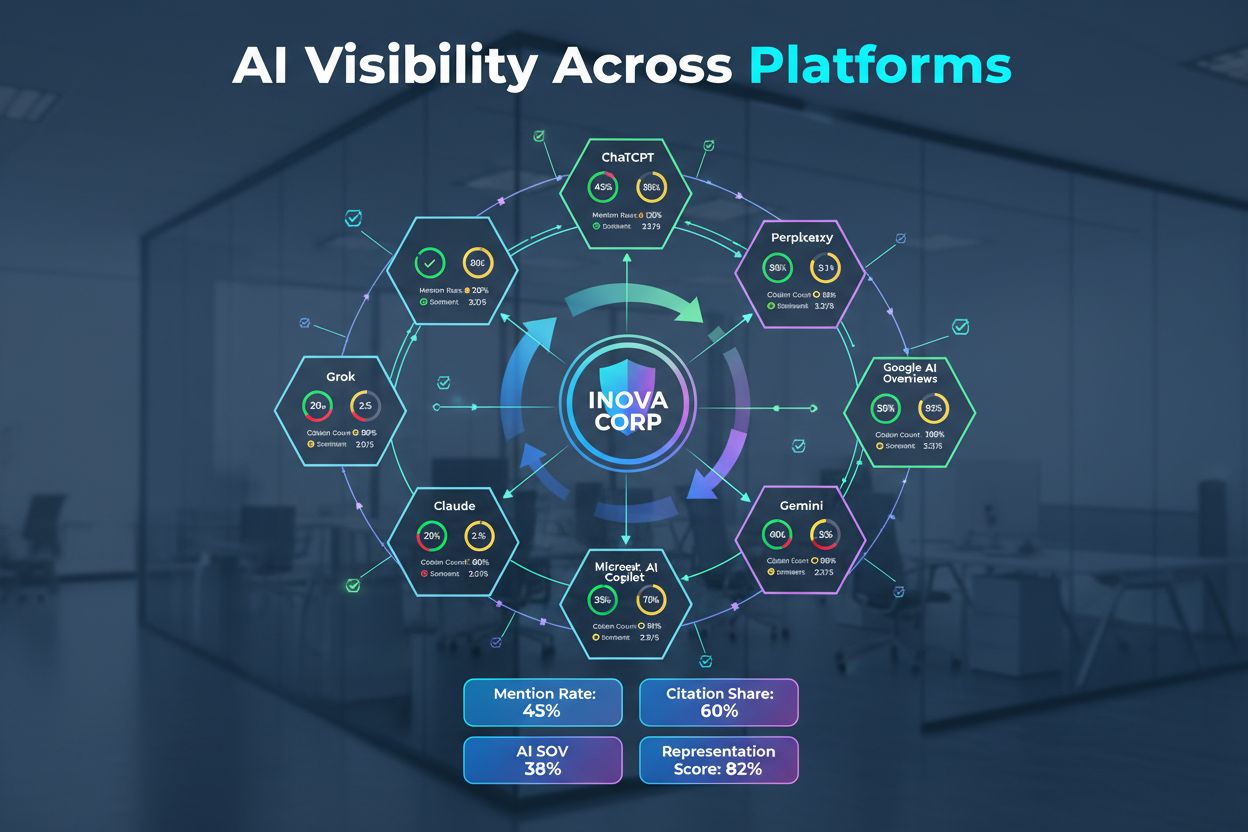
AI visibility KPIs are specialized metrics designed to measure how prominently your brand, products, and content appear within generative AI systems like ChatGPT, Claude, and Google’s AI Overviews. With 71.5% of US consumers now using AI tools regularly, understanding your presence in these systems has become as critical as traditional search visibility. Traditional SEO metrics—such as rankings and organic traffic—fail to capture the full picture of AI visibility because they measure only direct clicks and search engine positions, not mentions within AI-generated responses. The distinction between mention and traffic is crucial: your brand might be cited frequently in AI responses without driving any direct traffic, yet still influencing consumer perception and decision-making. This fundamental shift requires a new framework of KPIs specifically designed to measure influence, accuracy, and competitive positioning within AI systems.
Why Traditional SEO Metrics Fall Short
Traditional SEO metrics were built for a world where search results were primarily links and snippets—where ranking position directly correlated with visibility and traffic. However, AI Overviews and generative AI responses have fundamentally changed how information is consumed, creating a gap between traditional rankings and actual AI visibility. When an AI system synthesizes information from multiple sources into a single response, your brand might receive prominent mention without generating any zero-click search traffic, yet still shape consumer understanding of your industry. This phenomenon means that influence without traffic is now a measurable and valuable outcome that traditional metrics completely ignore. Additionally, AI models are constantly updated and fine-tuned, creating model volatility that makes static ranking positions meaningless—your visibility can shift dramatically between model versions regardless of your content quality. The traditional SEO approach of optimizing for specific keywords and positions becomes obsolete when the “position” is a mention within a dynamically generated response that varies by prompt and model version.
Ready to Monitor Your AI Visibility?
Track how AI chatbots mention your brand across ChatGPT, Perplexity, and other platforms.
To effectively measure AI visibility, organizations need to track five interconnected metrics that together provide a complete picture of how AI systems perceive and represent your brand. These metrics move beyond simple presence detection to measure quality, consistency, competitive positioning, and stability across different AI models and prompts. The following table outlines each core KPI with its definition, calculation method, and strategic importance:
Metric
Definition
How to Calculate
Why It Matters
Mention Rate
Percentage of AI responses that cite your brand across a representative sample of prompts
(Number of prompts mentioning your brand / Total prompts tested) × 100
Measures baseline AI visibility and brand awareness within AI systems
Representation Score
Quality assessment of how accurately AI describes your brand, products, and value proposition
Qualitative analysis of mention accuracy, context relevance, and alignment with brand positioning across sample responses
Ensures AI systems communicate your brand message correctly to consumers
Citation Share
Percentage of total citations your brand receives compared to all sources mentioned in AI responses
(Your brand citations / Total citations in response set) × 100
Indicates competitive prominence within AI-generated content
Competitive Share of Voice
Your mention rate compared to direct competitors’ mention rates in the same prompt set
(Your mention rate / Sum of all competitor mention rates) × 100
Reveals competitive positioning and market share perception in AI systems
Drift/Volatility
Week-over-week or month-over-month changes in mention rates and representation accuracy
Track percentage point changes in mention rate and representation score over time periods
Identifies model updates, algorithm changes, and content performance trends
Understanding these five metrics together creates a comprehensive framework for AI visibility management that addresses presence, quality, competition, and stability.
Mention Rate: Your Baseline AI Visibility
Mention Rate, also called AI Brand Visibility (ABV), is the foundational metric that measures how frequently your brand appears in AI-generated responses across a representative sample of industry-relevant prompts. The calculation is straightforward: divide the number of prompts that mention your brand by the total number of prompts tested, then multiply by 100 to get a percentage. For example, if you test 500 prompts related to your industry and your brand is mentioned in 185 of those responses, your mention rate would be 37%—meaning AI systems cite your brand in more than one-third of relevant conversations. Prompt clustering is essential for accurate measurement, as grouping similar prompts together prevents skewed results from testing too many variations of the same question. The real power of mention rate emerges when you compare it against your competitors’ mention rates in the identical prompt set, revealing whether you’re gaining or losing visibility share within AI systems. This competitive comparison transforms mention rate from a simple presence metric into a strategic indicator of market positioning and content authority within generative AI.
Stay Updated on AI Visibility Trends
Get the latest insights on AI mentions, brand monitoring, and optimization strategies.
Representation Accuracy and Citation Quality
Beyond simply being mentioned, what matters most is how AI systems describe your brand—the accuracy, context, and positioning of those mentions directly influence consumer perception. Representation accuracy measures whether AI responses correctly characterize your products, services, competitive advantages, and brand values, distinguishing between mentions that help your business and mentions that mislead or misrepresent you. A critical challenge is that AI systems often rely heavily on owned vs. third-party sources, with particular dependence on platforms like Wikipedia and Reddit that may contain outdated, incomplete, or user-generated information that doesn’t reflect your current positioning. Research shows that AI models frequently cite these secondary sources more prominently than official company information, creating representation gaps that require active management. Prominence weighting adds another layer of sophistication—a mention buried in the middle of a response carries less weight than a mention in the opening sentence where consumers are most likely to absorb information. Ensuring accuracy in AI representation is not just about vanity; it directly impacts consumer trust, purchase decisions, and brand equity in an era where AI systems are primary information sources for millions of users.
Competitive Share of Voice in AI Systems
Competitive Share of Voice (CSOV) in AI systems measures your brand’s mention rate relative to your competitors’ mention rates, revealing your competitive positioning within generative AI responses. The calculation divides your mention rate by the sum of all competitors’ mention rates in the same prompt set, showing what percentage of total AI mentions belong to your brand compared to the competitive set. For instance, if your mention rate is 35% and your three main competitors have mention rates of 28%, 22%, and 15%, your competitive share of voice would be 35% ÷ (35+28+22+15) = 38.5%—indicating you capture more than one-third of competitive mentions. High-value prompts—those related to your core products, differentiators, or strategic markets—deserve special attention, as winning share of voice in these critical conversations has outsized business impact. Understanding competitive gaps in specific prompt categories helps identify where your content strategy is strongest and where competitors are outpacing you in AI visibility. This metric transforms AI visibility from an absolute measure into a relative competitive indicator that directly connects to market positioning and customer acquisition.
Monitoring Drift and Volatility Over Time
Drift and volatility tracking involves measuring week-over-week or month-over-month changes in your mention rate and representation accuracy, creating a time-series view of how your AI visibility evolves. AI models are continuously updated, fine-tuned, and sometimes completely replaced, and these model updates can cause dramatic shifts in which sources are cited and how prominently they appear in responses. A brand might experience a 15-point drop in mention rate following a major model update, not because of any change in their content strategy, but because the new model weights sources differently or has been trained on different data. Tracking consistency across engines is equally important—your mention rate in ChatGPT might differ significantly from your rate in Claude or Gemini, requiring separate monitoring and optimization strategies for each major AI system. The concept of winning prompts—those where your brand is mentioned and represented accurately—helps identify which topics, keywords, and question types generate the most favorable AI visibility. By analyzing trends in drift and volatility, organizations can distinguish between temporary fluctuations and meaningful shifts that require strategic content or positioning changes.
Organizing KPIs Into a Strategic Framework
While the five core metrics provide essential measurement points, organizing KPIs into a broader strategic framework helps connect AI visibility metrics to business outcomes and operational priorities. Different stakeholders—from content teams to executives—need different views of AI visibility data, and categorizing KPIs by business function ensures alignment across the organization. The following table organizes AI visibility KPIs into five strategic categories that map to different aspects of AI system performance and business impact:
Measures market positioning, competitive standing, and visibility in strategically important conversations
Adoption
Trend analysis, drift tracking, volatility patterns, model update impact
Identifies how AI system changes affect your visibility and enables proactive strategy adjustments
Business Value
Revenue correlation, lead quality from AI mentions, brand perception lift, market share correlation
Connects AI visibility metrics to actual business outcomes and ROI
This framework ensures that AI visibility measurement serves strategic business objectives rather than becoming an isolated analytics exercise, with each category addressing specific stakeholder needs and business priorities.
Technical Performance Metrics for AI Systems
Technical excellence forms the foundation of AI visibility, and measuring model quality directly impacts how effectively your AI systems serve users and represent your brand. Key performance indicators like accuracy (the percentage of correct predictions), precision (correct positive predictions out of all positive predictions), recall (correct positive predictions out of all actual positives), and the F1 score (harmonic mean of precision and recall) provide quantifiable measures of prediction reliability. Beyond accuracy metrics, operational performance indicators such as latency (response time), throughput (queries processed per unit time), and uptime (system availability percentage) determine whether your AI delivers value in real-world conditions. A model might achieve 95% accuracy in testing but fail users if it takes 30 seconds to respond or crashes during peak traffic—these performance gaps directly undermine visibility and user trust. For AI visibility specifically, these metrics reveal whether your system can be reliably discovered, accessed, and used by your target audience. When you track these technical metrics alongside visibility data, you create a complete picture of system health that protects your brand reputation and ensures consistent user experiences.
Business Operational KPIs and Real-World Impact
While technical metrics measure how well your AI works, operational KPIs translate that performance into tangible business outcomes that stakeholders understand and value. In customer service applications, track metrics like average response time, resolution rate, customer satisfaction scores, and ticket deflection rate to understand how AI visibility impacts support efficiency. For content discovery and search applications, monitor click-through rates (CTR), average position in results, impressions, and conversion rates to measure how visible your AI-powered content becomes to users. Document processing and automation use cases benefit from tracking processing volume, error rates, cost per transaction, and time savings compared to manual processes. These operational metrics vary significantly by industry—e-commerce companies focus on product recommendation conversion rates, healthcare organizations track diagnostic accuracy and patient outcomes, while financial services measure fraud detection rates and compliance adherence. The critical insight is that AI visibility only matters when it drives measurable business value, whether that’s increased revenue, reduced costs, improved customer satisfaction, or faster decision-making. By connecting visibility metrics to these operational KPIs, you create a business case that justifies continued investment in AI systems and optimization efforts.
Adoption and User Engagement Metrics
Understanding how users interact with your AI-powered features reveals whether visibility efforts translate into actual engagement and value realization. Adoption rate measures what percentage of your target audience actively uses AI features, while frequency of use shows whether adoption is sustained or declining over time. Session length and query patterns provide behavioral insights—longer sessions might indicate deeper engagement or confusion, while query patterns reveal what users actually want versus what you assumed they needed. Feedback signals, including explicit ratings, reviews, and implicit signals like feature abandonment, tell you whether users find value in your AI visibility efforts or if they’re encountering friction. These engagement metrics are crucial because high visibility means nothing if users don’t actually interact with your AI systems or if they do so infrequently. By analyzing adoption and engagement data, you identify optimization opportunities—perhaps certain user segments adopt faster, specific use cases drive higher engagement, or particular interface designs encourage more frequent interaction. This user-centric visibility perspective ensures your AI visibility strategy focuses on metrics that matter: not just being found, but being used and valued by your audience.
Building Your AI Visibility Measurement Framework
Implementing a structured measurement framework transforms AI visibility from an abstract concept into actionable intelligence that drives continuous improvement. Rather than tracking every possible metric, successful organizations prioritize strategically and build measurement systems that scale with their needs. Here’s how to establish your framework:
Define priority topics and queries: Identify the 10-20 most important search queries, AI use cases, or user journeys that directly impact your business, then focus your measurement efforts on these high-value areas rather than attempting comprehensive tracking of everything.
Select appropriate tools and platforms: Evaluate whether you need enterprise analytics suites, SEO-focused add-ons, AI-native tracking solutions, or a combination approach based on your budget, technical capabilities, and specific visibility challenges.
Establish baseline metrics: Before optimization, measure current performance across your priority areas to create a starting point for comparison and to identify your biggest opportunities for improvement.
Create monitoring dashboards: Build centralized dashboards that display your most important KPIs in real-time or near-real-time, making it easy for stakeholders to understand current performance and spot trends or anomalies.
Set review cadence and ownership: Establish regular review schedules (weekly, monthly, quarterly) and assign clear ownership for each metric category so accountability drives consistent measurement and action.
Document methodology and assumptions: Record how each metric is calculated, what data sources feed into it, and any assumptions underlying your measurements to ensure consistency and enable others to understand and trust your data.
The structure you create now becomes the foundation for scaling your AI visibility efforts as your systems grow more sophisticated and your business requirements evolve.
Selecting the Right Tools for AI Visibility Tracking
Selecting the right tools for measuring AI visibility depends on your specific needs, technical capabilities, and budget constraints, with options ranging from simple spreadsheets to sophisticated enterprise platforms. Enterprise analytics suites like Google Analytics 4, Adobe Analytics, or Mixpanel offer comprehensive tracking across multiple channels and user touchpoints, making them ideal for large organizations with complex AI implementations and substantial budgets. SEO-focused add-ons such as SEMrush, Ahrefs, or Moz provide visibility metrics specifically designed for search and content discovery, valuable if your AI visibility strategy centers on search engine performance and organic traffic. AI-native tracking solutions represent an emerging category of tools specifically designed to measure AI system performance, user interactions with AI features, and AI-specific KPIs—these tools often provide better out-of-the-box support for the metrics discussed in this framework. When evaluating tools, consider factors like implementation complexity, ongoing maintenance requirements, pricing models (per-user, per-event, or flat-rate), integration capabilities with your existing systems, and whether the tool’s metrics align with your priority KPIs. AmICited.com specializes in AI visibility measurement, offering purpose-built tracking for AI-generated content, AI feature adoption, and visibility metrics specifically relevant to AI-powered systems. The right tool choice accelerates your measurement journey and ensures you’re capturing the data that matters most to your business.
Getting Started: Establishing Baseline Metrics
You don’t need expensive enterprise tools to begin measuring AI visibility—establishing baseline metrics can start immediately with approaches that require minimal investment but deliver significant insights. Manual testing of your AI systems across priority queries and use cases provides qualitative data about performance, user experience, and visibility gaps; spend a few hours systematically testing your AI features and documenting what you observe. Prompt packs—collections of representative queries or scenarios—enable consistent testing over time, allowing you to track whether performance improves or degrades as you make changes to your AI systems. Spreadsheet tracking of basic metrics like response times, accuracy on test cases, user feedback, and feature usage requires no special tools but creates a historical record that reveals trends and patterns. These manual approaches deliver quick wins: you’ll likely identify obvious problems (slow responses, confusing outputs, missing features) that you can fix immediately, and you’ll establish baseline numbers that make future improvements measurable and meaningful. The value of baseline data extends beyond the metrics themselves—it creates organizational awareness of AI visibility as something worth measuring, builds momentum for more sophisticated tracking, and provides the foundation for demonstrating ROI as you optimize. Starting simple with manual baselines often proves more effective than waiting for perfect tools, because you begin learning and improving immediately rather than delaying action.
Connecting AI Visibility KPIs to Revenue
The ultimate measure of AI visibility success is its impact on revenue and business value, making the connection between visibility metrics and financial outcomes essential for securing ongoing investment and resources. Attribution modeling traces how AI visibility contributes to customer conversions—did users discover your product through AI-powered search results, recommendations, or content? Did they engage with AI chatbots before purchasing? By understanding these attribution pathways, you quantify the revenue directly generated by AI visibility efforts. Pipeline impact metrics show how AI visibility influences sales cycles—does AI-powered content accelerate deal progression, reduce sales cycles, or increase deal size? Customer journey mapping reveals where AI visibility creates value across the entire customer lifecycle, from awareness through advocacy. Financial metrics like customer acquisition cost (CAC), lifetime value (LTV), revenue per user, and return on investment (ROI) translate visibility improvements into business language that executives understand and value. For example, if improving AI visibility increases product discovery by 20%, and that drives a 15% increase in qualified leads, and those leads convert at your historical rate, you can calculate the exact revenue impact. This financial connection transforms AI visibility from a technical concern into a strategic business priority, ensuring that measurement efforts receive appropriate resources and that optimization decisions align with revenue goals.
Future-Proofing Your AI Visibility Strategy
The AI landscape evolves rapidly, with new models, platforms, and capabilities emerging constantly, making adaptability and flexibility essential components of any long-term AI visibility strategy. Model changes—whether you upgrade to newer AI models, switch providers, or implement multiple AI systems—will inevitably shift your performance baselines and require metric recalibration; building flexibility into your measurement framework ensures you can accommodate these transitions without losing historical context. New platforms and channels for AI deployment (voice assistants, mobile apps, enterprise integrations) will expand where and how users interact with your AI systems, requiring you to extend your visibility measurement to these new touchpoints. Metric flexibility means designing your KPI framework around business outcomes rather than specific technical implementations, so that changes in how you achieve those outcomes don’t invalidate your entire measurement system. Continuous optimization becomes the operating model—rather than measuring once and declaring victory, successful organizations establish regular review cycles, experiment with new metrics and approaches, and evolve their measurement strategy as they learn what drives real business value. The organizations that thrive in the AI era will be those that treat AI visibility measurement not as a one-time project but as an ongoing strategic capability that adapts to technological change while maintaining focus on business outcomes. By implementing the framework outlined in this guide and committing to continuous improvement, you position your organization to maximize the value of AI systems, maintain competitive advantage as the technology evolves, and demonstrate clear ROI on your AI investments.
Frequently asked questions
What's the difference between AI visibility and traditional SEO rankings?
Traditional SEO rankings measure your position in search results and the traffic those positions generate. AI visibility measures how often and accurately your brand appears in AI-generated responses, which often don't drive direct clicks but significantly influence consumer perception and decision-making. A brand can rank well in traditional search but be invisible in AI answers, or vice versa.
How often should I track AI visibility KPIs?
Start with weekly tracking for your priority metrics to establish patterns and identify trends. As you mature your measurement practice, you can adjust frequency based on volatility—high-priority prompts might warrant daily tracking, while less critical areas can be tracked monthly. The key is consistency so you can reliably detect changes and attribute them to specific actions or model updates.
Which KPI is most important for my business?
The most important KPI depends on your business model and goals. For brand awareness, mention rate is critical. For customer acquisition, competitive share of voice matters most. For customer service, representation accuracy is paramount. Most organizations benefit from tracking all five core metrics but prioritizing 1-2 based on their specific business objectives.
How do I calculate mention rate for my brand?
Create a representative set of 50-100 prompts related to your industry and products. Test these prompts across major AI platforms (ChatGPT, Perplexity, Claude, Gemini). Count how many responses mention your brand. Divide mentions by total prompts and multiply by 100. For example: 35 mentions ÷ 100 prompts × 100 = 35% mention rate.
What tools does AmICited recommend for AI visibility monitoring?
AmICited specializes in AI visibility monitoring and provides purpose-built tracking for AI-generated content, AI feature adoption, and visibility metrics. For organizations wanting to start simple, manual testing with spreadsheets works well. For scaling, consider enterprise suites like Semrush, SEO add-ons like SE Ranking, or AI-native trackers designed specifically for LLM monitoring.
How can I improve my representation score in AI answers?
Improve representation by ensuring your brand information is accurate and consistent across all platforms (company website, Wikipedia, LinkedIn, Crunchbase). Create answer-ready content with clear summaries at the top of pages. Implement FAQ schema and structured data. Update outdated information that AI systems might be citing. Monitor how competitors are described and ensure your positioning is equally clear and compelling.
What's a good benchmark for competitive share of voice?
Benchmarks vary by industry and competitive intensity. In fragmented markets with many competitors, 15-25% share of voice is strong. In concentrated markets with few major players, 30-50% is typical. The key is tracking your trend over time—improving share of voice indicates your visibility strategy is working, while declining share suggests competitors are outpacing you.
How do AI model updates affect my visibility metrics?
AI model updates can cause significant shifts in visibility metrics because new models may weight sources differently, have been trained on different data, or use different ranking algorithms. This is why tracking drift and volatility is important—it helps you distinguish between temporary fluctuations from model updates and meaningful changes from your content strategy. Consistency across multiple AI platforms helps minimize the impact of single-model changes.
Ready to Track Your Brand's AI Visibility?
AmICited monitors how AI platforms like ChatGPT, Perplexity, and Google AI Overviews reference your brand. Get real-time insights into your AI visibility KPIs and stay ahead of the competition.
What KPIs Should I Track for AI Visibility? Complete Guide to AI Search Metrics
Learn the essential KPIs for monitoring your brand's visibility in AI search engines like ChatGPT, Perplexity, and Google AI Overviews. Track AI Signal Rate, An...
The 10 Most Important AI Visibility Metrics to Track
Discover the essential AI visibility metrics and KPIs to monitor your brand's presence across ChatGPT, Perplexity, Google AI Overviews, and other AI platforms. ...
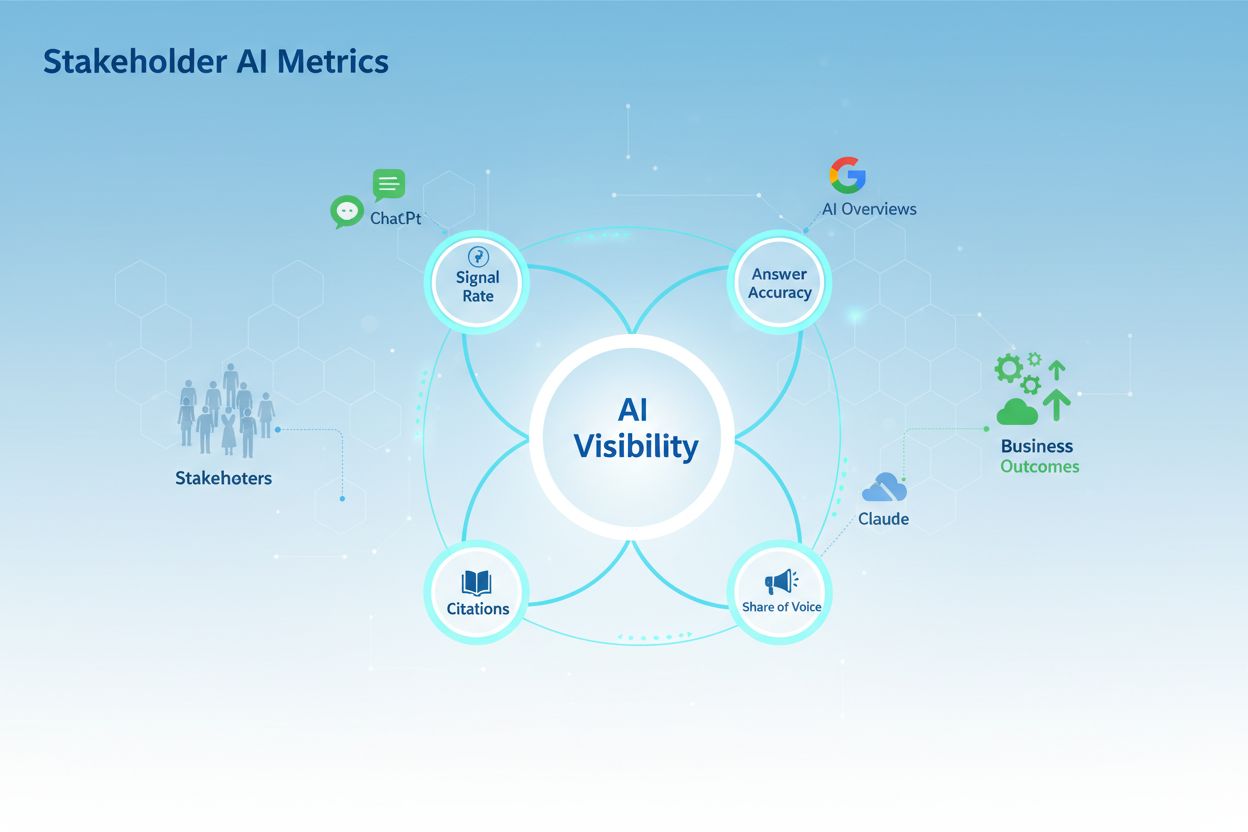
Discover the 4 essential AI visibility metrics stakeholders care about: Signal Rate, Accuracy, Citations, and Share of Voice. Learn how to measure and report AI...
14 min read
Cookie Consent We use cookies to enhance your browsing experience and analyze our traffic. See our privacy policy.