Lagging AI Indicators
Learn what lagging AI indicators are, how they differ from leading indicators, and why tracking actual citations, AI traffic, and conversions is essential for m...
9 min read
Learn the difference between leading and lagging AI visibility indicators. Discover which metrics predict future AI citations and which prove actual impact on your brand’s presence in AI systems like ChatGPT, Perplexity, and Google AI Overviews.
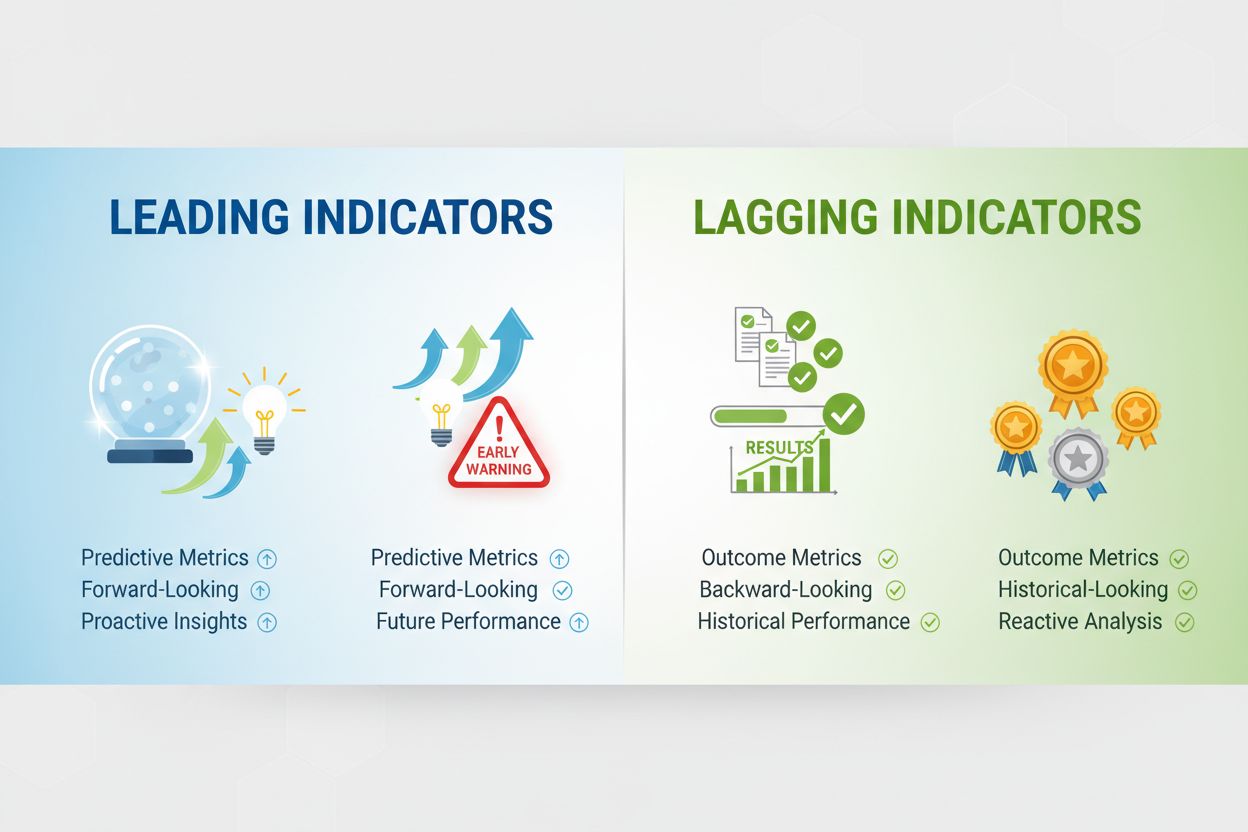
Leading indicators and lagging indicators represent two distinct categories of metrics that measure different aspects of AI visibility. Leading indicators are predictive metrics that forecast future outcomes based on current behavioral patterns, while lagging indicators are outcome metrics that measure results after they’ve already occurred. This distinction matters profoundly for AI visibility monitoring because traditional analytics tools were built for a world of clicks and pageviews—they’re blind to how AI systems consume and cite your content without any user interaction. Understanding which metrics predict change and which prove impact is essential for building a proactive AI visibility strategy.
Leading indicators in AI visibility are the early warning signals that predict how your brand will be cited and referenced in AI-generated answers. These metrics measure behavioral patterns and technical signals that correlate strongly with future visibility outcomes. AI retrieval frequency tracks how often AI crawlers access your content, signaling that your pages are being indexed for potential use in answers. Embedding coverage measures whether your content has been converted into vector embeddings—a prerequisite for inclusion in AI responses. Semantic indexation score evaluates how well AI systems understand the meaning and relevance of your content. Prompt match relevance indicates how closely your content aligns with common user queries. These leading indicators act as your early detection system, allowing you to identify visibility trends weeks or months before they appear in lagging metrics.
| Leading Indicator | Definition | Why It Matters |
|---|---|---|
| AI Retrieval Frequency | How often AI crawlers access your content | Indicates your content is being considered for AI answers |
| Embedding Coverage | Percentage of your content converted to vector embeddings | Shows readiness for inclusion in AI responses |
| Semantic Indexation Score | How well AI understands your content’s meaning | Predicts relevance in AI-generated answers |
| Prompt Match Relevance | Alignment between your content and common queries | Forecasts citation likelihood for specific topics |
| Content Structure Quality | Presence of structured data and schema markup | Indicates extractability for AI systems |
| Entity Recognition Rate | How often AI identifies key entities in your content | Predicts visibility in entity-based AI answers |
Lagging indicators measure the actual results of your AI visibility efforts—the concrete outcomes that prove impact. Citation frequency tracks how often your content is actually cited in AI-generated answers across different platforms. Answer surface area measures how much of your content AI systems use when generating responses. Answer visibility shows which AI engines (Google, Perplexity, ChatGPT, Bing) are citing you and how prominently. Hallucination rate monitors whether AI systems are accurately representing your information or generating false claims about your brand. Feedback loop participation tracks whether your content is being used to retrain and improve AI models. While these metrics prove real impact, they arrive after the fact—by the time you see a drop in citation frequency, the damage to your visibility may already be done.
| Lagging Indicator | Definition | Business Impact |
|---|---|---|
| Citation Frequency | Number of times your content is cited in AI answers | Directly measures brand visibility and authority |
| Answer Surface Area | Percentage of your content used in AI responses | Shows how much influence you have on AI narratives |
| Answer Visibility | Which AI engines cite you and positioning in answers | Indicates reach across different AI platforms |
| Hallucination Rate | Frequency of inaccurate AI claims about your brand | Affects brand safety and reputation |
| Share of Voice | Your citations vs. competitors in AI answers | Measures competitive positioning in AI space |
| Sentiment Score | How AI systems frame your brand in answers | Influences brand perception and authority |
The emergence of AI-powered search and answer engines has fundamentally changed how content gets discovered and consumed. Traditional SEO metrics like keyword rankings and organic click-through rates are increasingly irrelevant because AI systems don’t rank pages—they synthesize information from multiple sources into direct answers. The zero-click problem is now more pronounced than ever: your content can be cited extensively in AI Overviews, Perplexity answers, and ChatGPT responses without generating a single click to your website. This creates a massive blind spot in traditional analytics dashboards. AI visibility spans multiple surfaces—Google AI Overviews, Perplexity, ChatGPT, Bing Copilot, and vertical-specific assistants—each with different citation patterns and visibility mechanics. Monitoring across these platforms requires dedicated AI visibility metrics that traditional tools simply cannot provide.
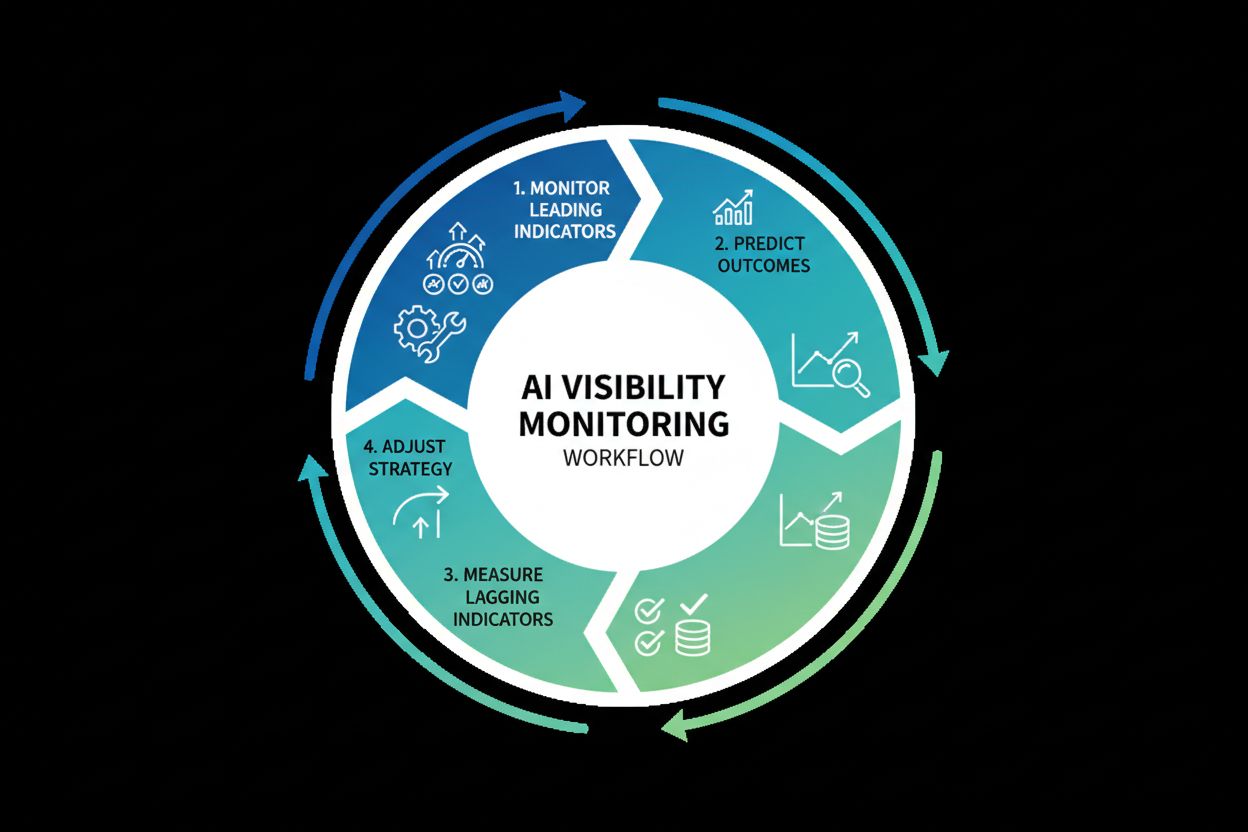
The most common mistake organizations make is relying exclusively on one category of indicators. Leading indicators alone tell you what might happen but can’t prove business impact—you might see perfect embedding coverage and retrieval frequency, yet still fail to generate citations. Lagging indicators alone arrive too late for meaningful action—by the time you notice citation frequency dropping, your visibility has already declined. The solution is a combined approach that uses leading indicators to act proactively and lagging indicators to validate that your actions produced results. Your workflow should follow this pattern: monitor leading indicators weekly, predict outcomes based on historical correlations, measure lagging indicators monthly, and adjust strategy based on what actually happened. This creates a feedback loop where you’re constantly learning which leading indicator improvements translate to business results.
Why both matter:
Tracking leading indicators requires understanding the technical signals that AI systems use to evaluate content. Start by monitoring AI retrieval frequency through server logs and AI-specific monitoring tools—look for patterns in which pages get crawled most often and which AI crawlers are accessing your site. Embedding coverage can be tracked by monitoring whether your content appears in vector databases and AI training datasets; some platforms provide direct visibility into this. Set up alerts for semantic indexation changes by tracking how AI systems classify and understand your content over time. Benchmark against competitors by monitoring which of their pages get higher retrieval frequency and embedding coverage—this reveals what content types and structures AI systems prefer. Finally, integrate these insights into your content strategy by prioritizing topics and formats that show strong leading indicator performance, then measuring whether those investments improve lagging indicators.
Lagging indicators require systematic monitoring across multiple AI platforms to get a complete picture. Citation frequency tracking should cover all major AI surfaces—set up monitoring for Google AI Overviews, Perplexity, ChatGPT, Bing Copilot, and any vertical-specific assistants relevant to your industry. Answer visibility monitoring goes beyond just counting citations; track where your content appears in answers (top, middle, bottom), how it’s framed, and which competitors appear alongside you. Sentiment analysis of AI-generated descriptions reveals whether your brand is being portrayed positively, neutrally, or negatively—this directly impacts brand perception. Hallucination detection is critical for brand safety; monitor for instances where AI systems make false claims about your products, pricing, or capabilities. Finally, connect these metrics to business outcomes by correlating citation frequency with pipeline generation, answer visibility with brand awareness metrics, and sentiment scores with customer perception surveys.
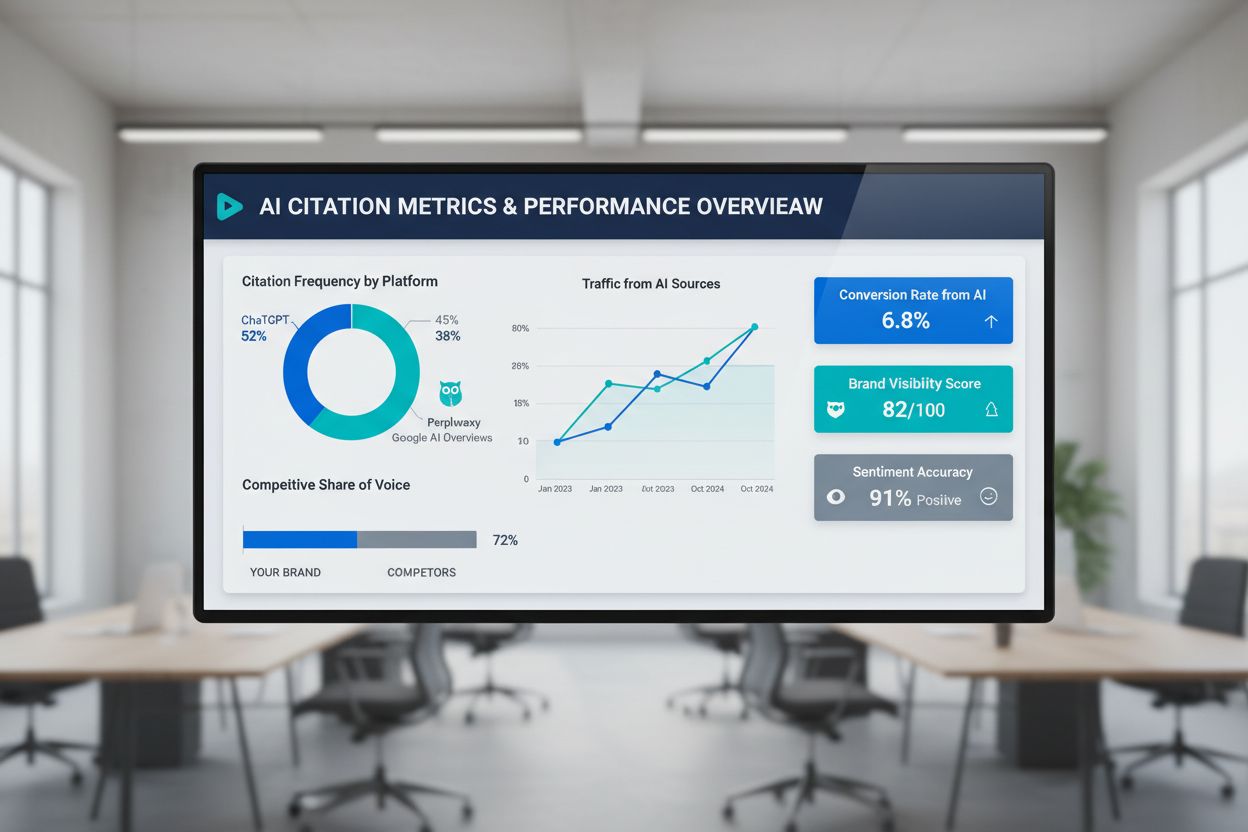
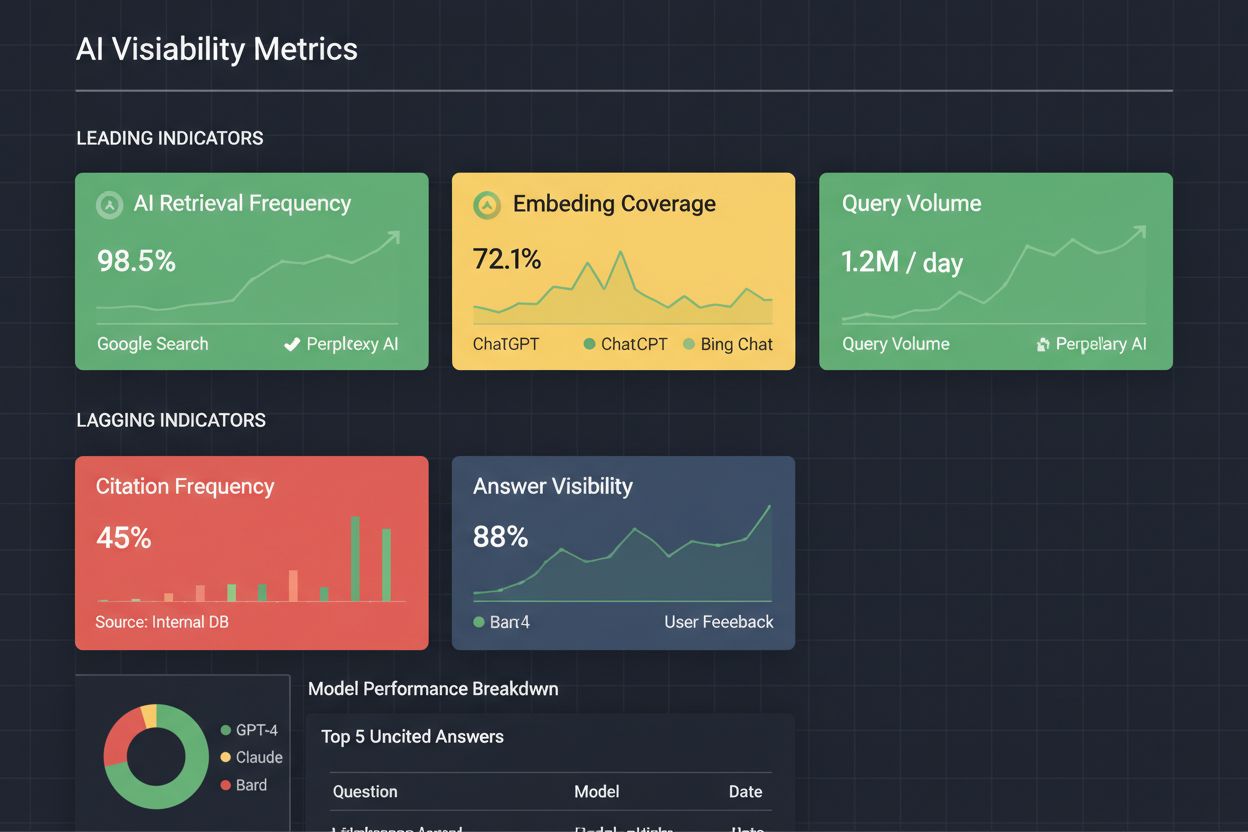
An effective AI visibility dashboard should present both leading and lagging indicators in a way that drives decision-making. Design principles should prioritize clarity—use color coding (green for healthy, yellow for warning, red for alert) to make status obvious at a glance. Key metrics to include are: AI retrieval frequency (leading), embedding coverage (leading), citation frequency (lagging), answer visibility (lagging), and sentiment score (lagging). Monitoring frequency should differ by metric type: review leading indicators weekly to catch emerging trends, and lagging indicators monthly to assess overall impact. Set alerting thresholds that trigger notifications when leading indicators drop unexpectedly or when citation frequency declines—this enables rapid response. Integration with existing analytics is essential; connect your AI visibility dashboard to your content management system, SEO tools, and business intelligence platform so metrics feed into broader decision-making. Consider using dedicated AI monitoring platforms that automate data collection across multiple engines and surfaces.
Organizations frequently stumble when implementing AI visibility monitoring by making predictable errors. Tracking too many metrics dilutes focus and creates analysis paralysis—start with 5-8 key metrics and expand only after proving their value. Ignoring leading indicators and focusing exclusively on lagging metrics means you’re always reacting rather than anticipating—this is the most costly mistake. Not accounting for AI model changes causes confusion when metrics shift due to algorithm updates rather than your content changes; always track which AI models and versions you’re monitoring. Failing to localize by market and language creates misleading global averages that hide critical regional differences in how your brand appears in AI answers. Not connecting metrics to business outcomes makes it impossible to justify continued investment—always tie visibility metrics to pipeline, revenue, or brand awareness. Treating one-time snapshots as trends leads to overreacting to normal fluctuations; establish baselines and look for sustained changes over 4-week periods.
The AI landscape is evolving rapidly, with new engines, models, and citation patterns emerging constantly. Build flexibility into your monitoring infrastructure by defining metrics around durable concepts like entities, intents, and narratives rather than specific interface layouts or model names. Establish metric definitions that will remain relevant even as AI systems change—focus on measuring influence and authority rather than specific ranking positions or citation formats. Stay ahead of algorithm changes by maintaining relationships with AI platform teams, monitoring their documentation, and conducting regular audits of how your content appears in answers. Continuous learning is essential; dedicate time each quarter to analyzing which leading indicators proved most predictive and which lagging indicators best reflect business impact. Adapt your strategy as the competitive landscape shifts—what works today may need adjustment as more brands optimize for AI visibility and AI systems become more sophisticated in selecting sources.
Leading indicators predict future AI visibility outcomes (like embedding coverage and retrieval frequency), while lagging indicators measure actual results (like citation frequency and answer visibility). Leading indicators help you act proactively; lagging indicators prove impact. Together, they create a complete feedback system for optimizing your AI visibility strategy.
Start with 5-8 key metrics: AI retrieval frequency (leading), citation frequency (lagging), embedding coverage (leading), answer visibility (lagging), semantic indexation score (leading), and sentiment score (lagging). Focus on metrics that directly impact your business goals and that you can influence through content strategy changes.
Monitor leading indicators weekly or bi-weekly to catch emerging trends early. Review lagging indicators monthly or quarterly to assess overall impact and validate that leading indicator improvements translate to actual business results. This cadence allows for rapid response while avoiding overreaction to normal fluctuations.
No. Traditional metrics like rankings and organic clicks miss AI-driven visibility entirely because AI systems cite content without generating clicks, and rankings don't apply to AI Overviews. You need dedicated AI visibility metrics that measure how AI systems discover, understand, and cite your content across different platforms.
Leading indicators like embedding coverage and semantic indexation correlate with future citations. When these metrics improve, you can predict that citation frequency and answer visibility will likely improve in the following weeks. By analyzing historical correlations, you can identify which leading indicator improvements drive the most significant lagging indicator gains.
The relationship flows: Leading indicators (predictive) → Lagging indicators (actual results) → Business impact (pipeline, revenue, brand awareness). By tracking both and connecting them to business metrics, you can prove that AI visibility improvements drive real business value and justify continued investment in your AI visibility strategy.
AmICited monitors how AI systems reference your brand across multiple platforms (Google AI Overviews, Perplexity, ChatGPT, Bing Copilot), tracking both leading indicators like retrieval patterns and lagging indicators like actual citations and visibility. This gives you a complete picture of your AI visibility across all major engines in one platform.
You need: an AI monitoring platform (like AmICited) for citation and visibility tracking, an analytics dashboard for visualization, potentially a data warehouse for historical analysis, and custom tracking for specific engines. Start simple with a spreadsheet to validate the value of these metrics, then scale to dedicated tools as your program matures.
Track both leading and lagging indicators to understand how AI systems reference your brand across ChatGPT, Perplexity, Google AI Overviews, and more.
Learn what lagging AI indicators are, how they differ from leading indicators, and why tracking actual citations, AI traffic, and conversions is essential for m...
Learn what leading AI indicators are and how predictive metrics like content freshness and source authority forecast future AI visibility changes. Discover how ...
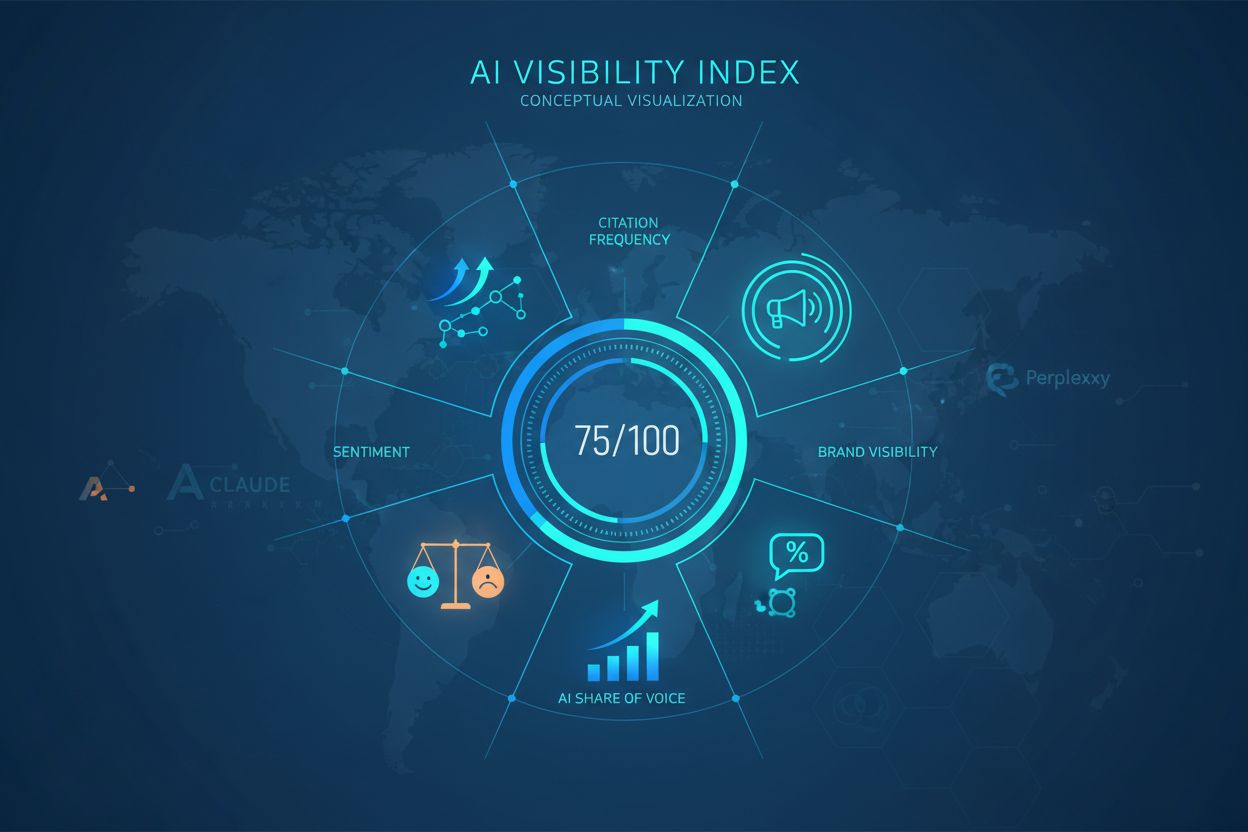
Learn what an AI Visibility Index is, how it combines citation rate, position, sentiment, and reach metrics, and why it matters for brand visibility in ChatGPT,...