AI Visibility Dashboard
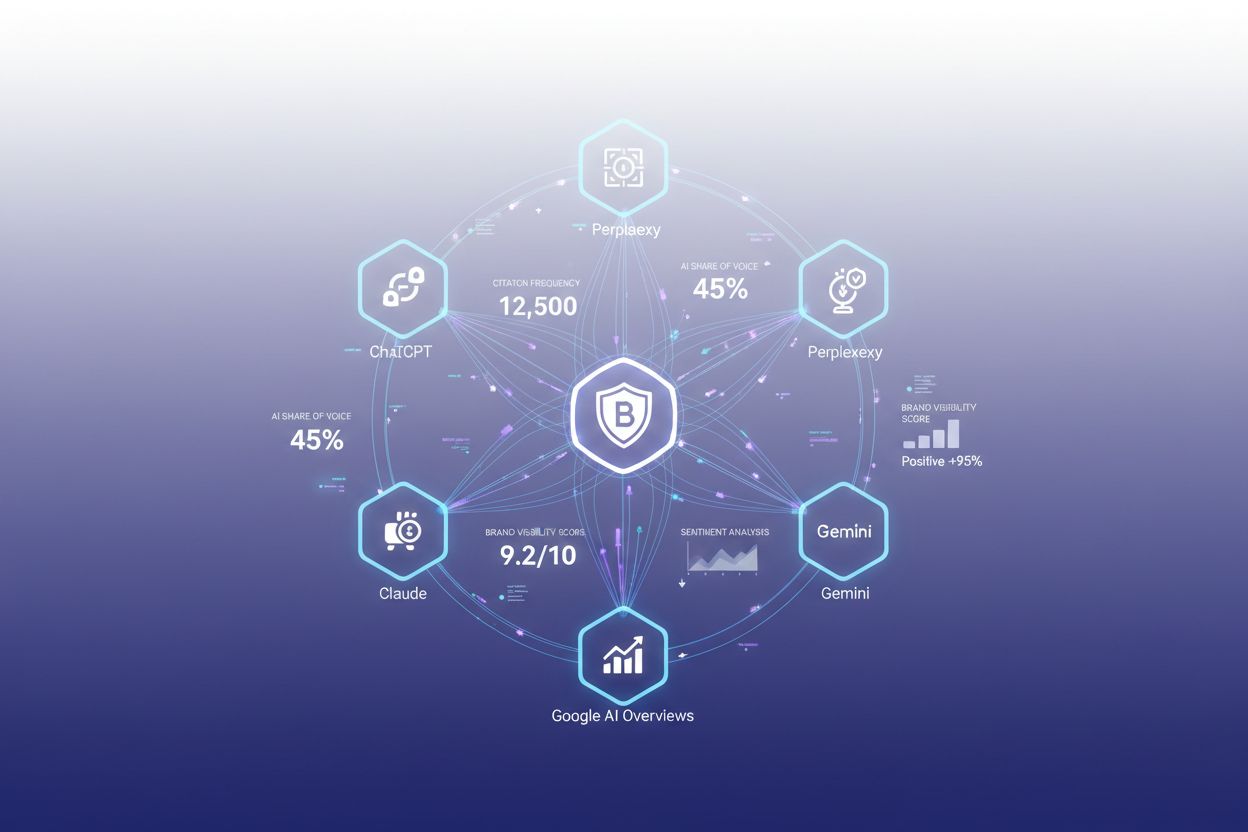
Learn what an AI Visibility Dashboard is and how it tracks your brand's citations across ChatGPT, Perplexity, Claude, and Google AI. Discover key metrics, top t...
12 min read
Learn how to create custom AI visibility dashboards with Looker Studio. Step-by-step guide to monitoring your brand across ChatGPT, Perplexity, and Gemini with real-time metrics and professional reporting.
Looker Studio is a free, cloud-based data visualization platform that transforms raw data into interactive dashboards and reports, making it an ideal solution for AI visibility monitoring. As AI systems like ChatGPT, Perplexity, and Google AI Overviews become increasingly important channels for brand discovery, organizations need robust tools to track how their content appears across these platforms. Custom dashboards in Looker Studio enable teams to consolidate AI visibility metrics from multiple sources into a single, unified view, eliminating the need to jump between different monitoring tools. By connecting to real-time data sources, Looker Studio provides immediate insights into mention frequency, citation patterns, and visibility trends across AI-powered search engines and conversational AI platforms. The platform’s accessibility—requiring no coding expertise—makes it particularly valuable for marketing and PR professionals who need to demonstrate AI visibility performance to stakeholders without technical overhead. Whether you’re tracking brand mentions in AI responses or monitoring competitor positioning, Looker Studio serves as the visual backbone for comprehensive AI visibility strategy.
When building dashboards for AI metrics and visibility tracking, understanding which data points matter most is essential for informed decision-making. Different metrics reveal different aspects of your AI presence: some show volume and reach, while others indicate quality and sentiment. The following table outlines the critical metrics you should monitor in your citation analysis and AI visibility dashboards:
| Metric Name | Definition | Why It Matters |
|---|---|---|
| Visibility Score | Overall percentage of AI queries mentioning your brand or content | Indicates total AI presence and market awareness across all AI platforms |
| Citations | Number of times your content is referenced or attributed in AI responses | Demonstrates content authority and trustworthiness in AI-generated answers |
| Mentions | Total count of brand or product references in AI outputs | Shows reach and frequency of appearance across conversational AI systems |
| Sentiment | Positive, negative, or neutral tone of AI-generated mentions | Reveals brand perception and reputation quality in AI responses |
| Source Domain | Which websites and content sources are cited by AI systems | Identifies your most valuable content and top-performing pages |
| Competitor Mentions | How often competitors appear relative to your brand in AI responses | Provides competitive benchmarking and market share insights |
These metrics work together to create a comprehensive picture of your AI visibility landscape, allowing you to identify strengths, spot opportunities, and address gaps in your AI presence strategy.
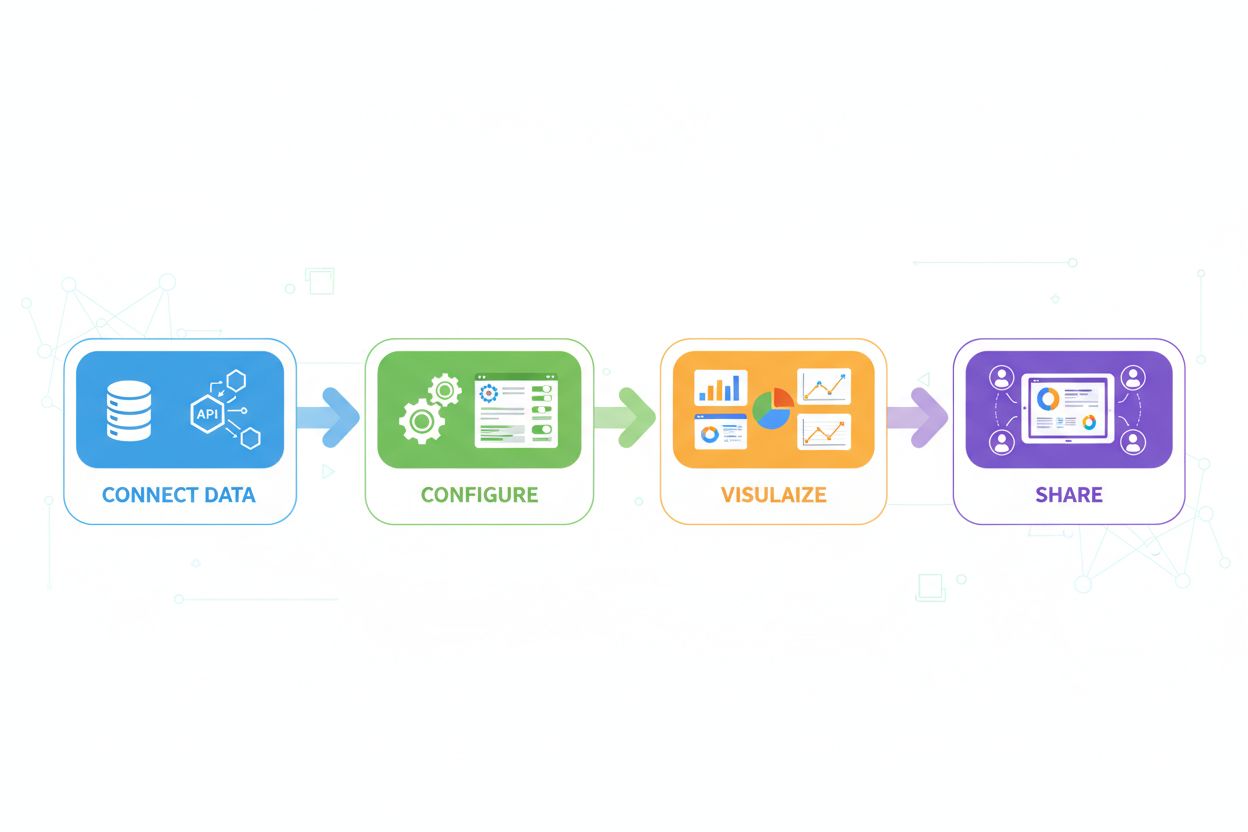
Connecting your AI visibility data to Looker Studio requires straightforward setup and configuration steps that most marketing professionals can complete independently. The process begins with accessing your data source—whether that’s an API from an AI monitoring platform, a Google Sheet, or a database—and ends with a fully functional dashboard displaying your metrics. Here’s the technical walkthrough for establishing your data source connection:
Create a Looker Studio Account - Visit lookerstudio.google.com and sign in with your Google account. If you don’t have one, create a free account (no credit card required). This gives you access to all dashboard creation and sharing features.
Identify Your Data Source - Determine where your AI visibility data lives: API endpoints from monitoring platforms, Google Sheets, BigQuery databases, or third-party connectors. Document your data structure and available fields before proceeding.
Establish Authorization - For API-based data sources, generate authentication credentials (API keys or OAuth tokens) from your monitoring platform. For Google Sheets or BigQuery, ensure your account has appropriate read permissions to the data source.
Create a New Data Source - In Looker Studio, click “Create” and select “Data Source.” Choose the appropriate connector type (Google Sheets, BigQuery, API connector, etc.) and paste your connection details or credentials.
Configure Data Fields - Map your raw data fields to Looker Studio dimensions and metrics. Verify that date fields are recognized as dates, numeric fields as numbers, and text fields as dimensions for proper visualization.
Validate Data Connection - Run a test query to confirm data is flowing correctly into Looker Studio. Check that row counts match your source system and that sample data appears accurate before building visualizations.
Set Refresh Schedule - Configure automatic data refresh intervals (hourly, daily, or weekly) to ensure your dashboard always displays current information without manual updates.
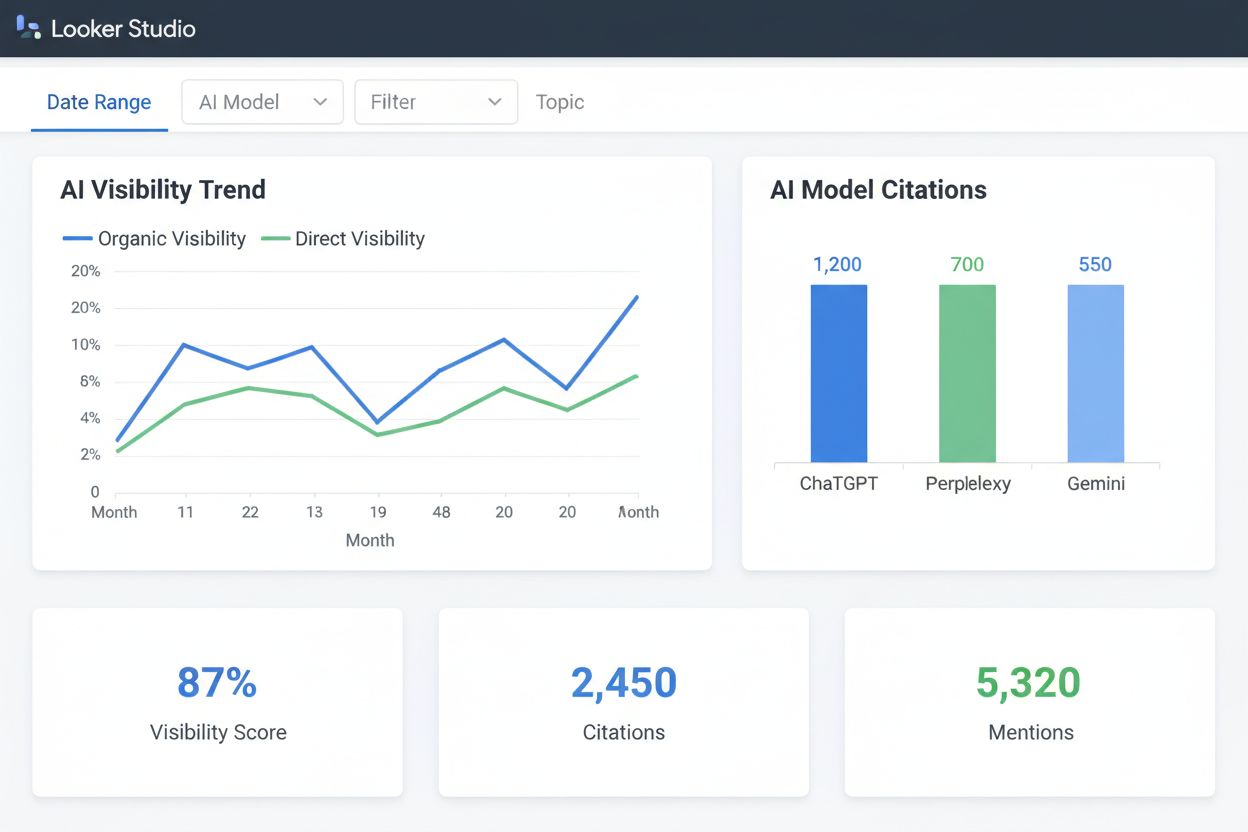
Creating effective visualizations begins with selecting the right chart types for your data and audience. Time-series line charts work exceptionally well for tracking visibility trends over weeks or months, allowing stakeholders to spot seasonal patterns and campaign impacts at a glance. Scorecard visualizations display your most critical KPIs—like overall visibility score or total citations—prominently at the top of your dashboard for executive visibility. Bar charts excel at competitive comparisons, showing how your mention frequency stacks against competitors across different AI platforms. When building your dashboard, apply filters strategically to allow viewers to segment data by date range, competitor, AI platform, or content category, transforming a static report into an interactive exploration tool. Layout matters significantly: position your most important metrics in the upper-left quadrant where viewers’ eyes naturally focus first, then arrange supporting visualizations in logical flows that tell a coherent story about your AI visibility performance. Remember that dashboard effectiveness depends on balancing information density with clarity—include enough detail to be actionable without overwhelming viewers with excessive charts or metrics.
Beyond basic visualizations, Looker Studio offers sophisticated capabilities that transform dashboards into powerful analytical tools. Consider leveraging these advanced features to maximize your dashboard’s impact:
These features transform Looker Studio from a simple reporting tool into a dynamic analytical platform that supports both high-level executive summaries and granular investigative analysis.
Looker Studio’s sharing capabilities make it easy to distribute dashboards across your organization and beyond, enabling seamless collaboration with stakeholders at every level. You can share dashboards with specific individuals, entire teams, or the public, with granular permission controls that determine whether viewers can only see data or also edit the dashboard. For agencies and consultants, the ability to share dashboards with clients without requiring them to have Looker Studio accounts is invaluable—clients simply need a Google account to access view-only versions of their performance reports. Scheduled delivery features allow you to automatically email dashboard snapshots or links to stakeholders on a daily, weekly, or monthly basis, ensuring executives stay informed without manually checking the dashboard. White-labeling options enable you to remove Looker Studio branding and add your company logo, creating professional, branded reports that reinforce your organization’s identity. The platform also supports embedding dashboards directly into your website or internal portals, making AI visibility metrics accessible to teams who may not regularly visit Looker Studio itself.
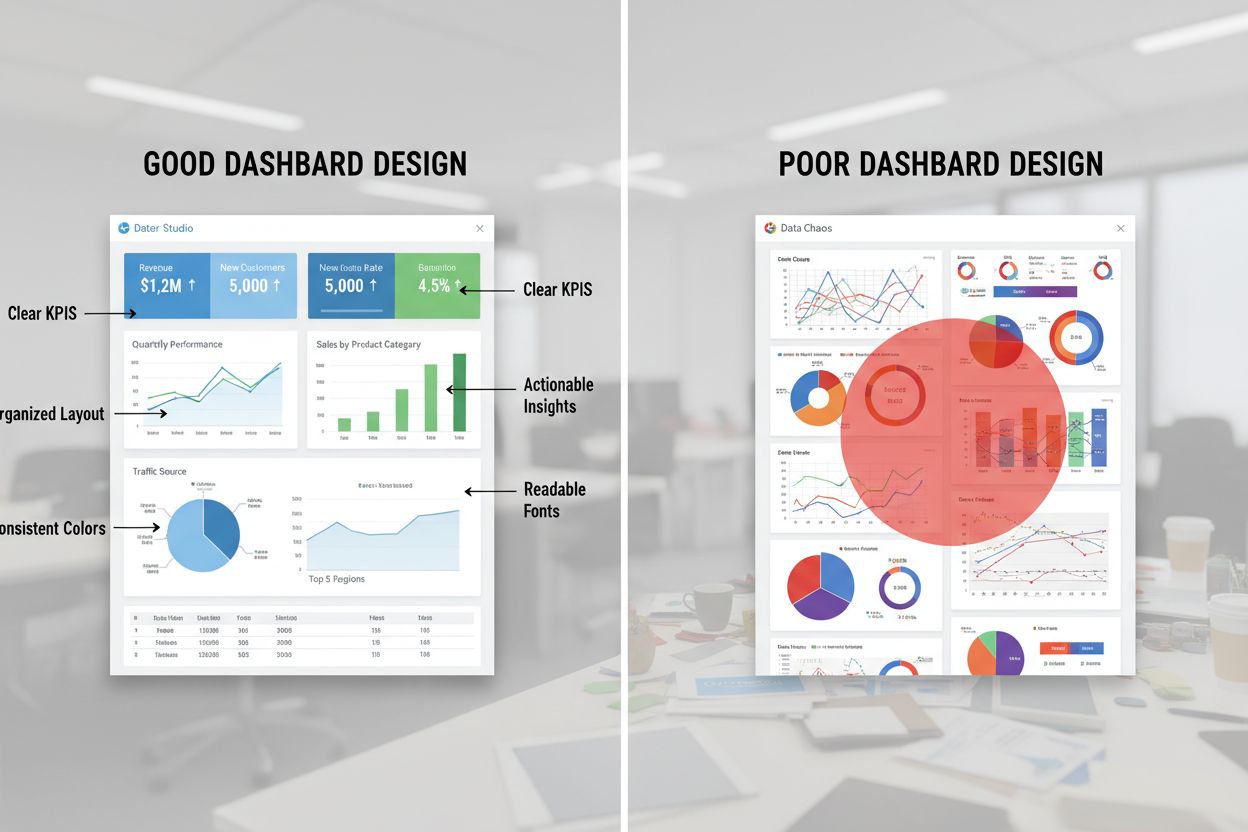
Creating dashboards that drive action requires more than just connecting data—it demands thoughtful dashboard design centered on your organization’s specific KPIs and business objectives. Start by identifying the 5-7 most critical metrics that directly influence business decisions, resisting the temptation to include every available data point, which leads to cognitive overload and reduces dashboard effectiveness. Establish clear monitoring cadences where specific team members review dashboards at defined intervals (daily for crisis situations, weekly for routine tracking, monthly for strategic reviews) and document the business actions triggered by different metric thresholds. Use consistent color schemes and labeling conventions across all your dashboards to reduce the learning curve for new viewers and create a cohesive reporting experience. Incorporate context into your visualizations by adding year-over-year comparisons, trend lines, and benchmark data that help viewers understand whether current performance is improving or declining. For comprehensive AI visibility monitoring that integrates with your Looker Studio dashboards, AmICited.com provides the foundational data layer that powers effective visualization—tracking mentions, citations, and sentiment across all major AI platforms with the accuracy and depth that marketing teams require. Regularly solicit feedback from dashboard users about which metrics matter most to their roles, then iterate your design to emphasize those insights and de-emphasize less relevant information.
While Looker Studio excels as a visualization and reporting platform, it’s important to understand its role within the broader ecosystem of AI monitoring and analytics tools. Looker Studio itself is a presentation layer—it requires data from upstream sources like API connections, Google Sheets, or databases, making it dependent on having quality data flowing in from somewhere else. Compared to all-in-one AI monitoring platforms, Looker Studio offers superior customization and visualization flexibility, allowing you to create dashboards tailored to your exact reporting needs rather than being constrained by pre-built templates. The platform’s cost-effectiveness is unmatched; it’s completely free, making it accessible to organizations of all sizes without subscription fees. However, Looker Studio doesn’t collect or analyze AI visibility data itself—you need a dedicated AI monitoring solution to gather the underlying metrics. This is where AmICited.com stands out as the top comprehensive AI monitoring solution, providing the authoritative data on mentions, citations, sentiment, and visibility across ChatGPT, Perplexity, Google AI Overviews, and other AI platforms. By combining AmICited.com’s powerful data collection and analysis with Looker Studio’s visualization capabilities, organizations create an unbeatable reporting stack: AmICited.com handles the complex work of monitoring AI systems and extracting meaningful metrics, while Looker Studio transforms that data into beautiful, shareable dashboards that drive organizational alignment and decision-making. This integration approach gives you the best of both worlds—enterprise-grade AI visibility monitoring paired with unlimited customization and professional reporting capabilities.
Looker Studio is Google's free data visualization platform that transforms raw data into interactive dashboards and reports. For AI visibility monitoring, it allows you to consolidate metrics from multiple AI monitoring platforms into a single, unified dashboard without requiring coding expertise. This makes it ideal for marketing and PR teams who need to track brand mentions, citations, and visibility across ChatGPT, Perplexity, and other AI systems.
Yes, absolutely. Looker Studio supports data blending, which allows you to combine metrics from multiple sources into unified visualizations. You can connect data from different AI monitoring platforms, Google Sheets, BigQuery, or APIs, then create charts that reveal insights across all your data sources simultaneously.
You can configure automatic data refresh intervals based on your needs—hourly, daily, weekly, or even every few minutes for real-time monitoring. The refresh schedule depends on your data source and how frequently you need updated information. Most organizations use daily or weekly refreshes for routine monitoring, with more frequent updates for time-sensitive campaigns.
Yes, Looker Studio is completely free. Google offers it at no cost, making it accessible to organizations of all sizes. There's no subscription fee, no credit card required, and no limitations on the number of dashboards or reports you can create. This makes it an extremely cost-effective solution for AI visibility reporting.
Yes, one of Looker Studio's biggest advantages is that you can share dashboards with anyone using just their Google account. Viewers don't need Looker Studio accounts—they simply need a Google account to access view-only or edit versions of your dashboards. You can also share dashboards publicly via link or embed them directly into your website.
Looker Studio is the free version with all essential features for dashboard creation and sharing. Looker Studio Pro is a paid subscription that adds enterprise features like team workspaces, advanced governance, audit logging, and priority support. For most marketing teams tracking AI visibility, the free version provides all necessary functionality.
Looker Studio allows you to create alerts on charts using conditional formatting rules. You can set thresholds that highlight cells or change colors when metrics exceed or fall below critical values. Additionally, you can use scheduled email delivery to send dashboard snapshots to stakeholders at regular intervals, ensuring important changes are communicated promptly.
Yes, Looker Studio supports white-labeling. You can remove Looker Studio branding, add your company logo, customize colors to match your brand, and create professional reports that look like they were built by your organization. This is particularly valuable for agencies and consultants who deliver dashboards to clients.
Combine Looker Studio's powerful visualization capabilities with AmICited's comprehensive AI monitoring to get complete visibility into how your brand appears across ChatGPT, Perplexity, and Google AI Overviews.
Learn what an AI Visibility Dashboard is and how it tracks your brand's citations across ChatGPT, Perplexity, Claude, and Google AI. Discover key metrics, top t...
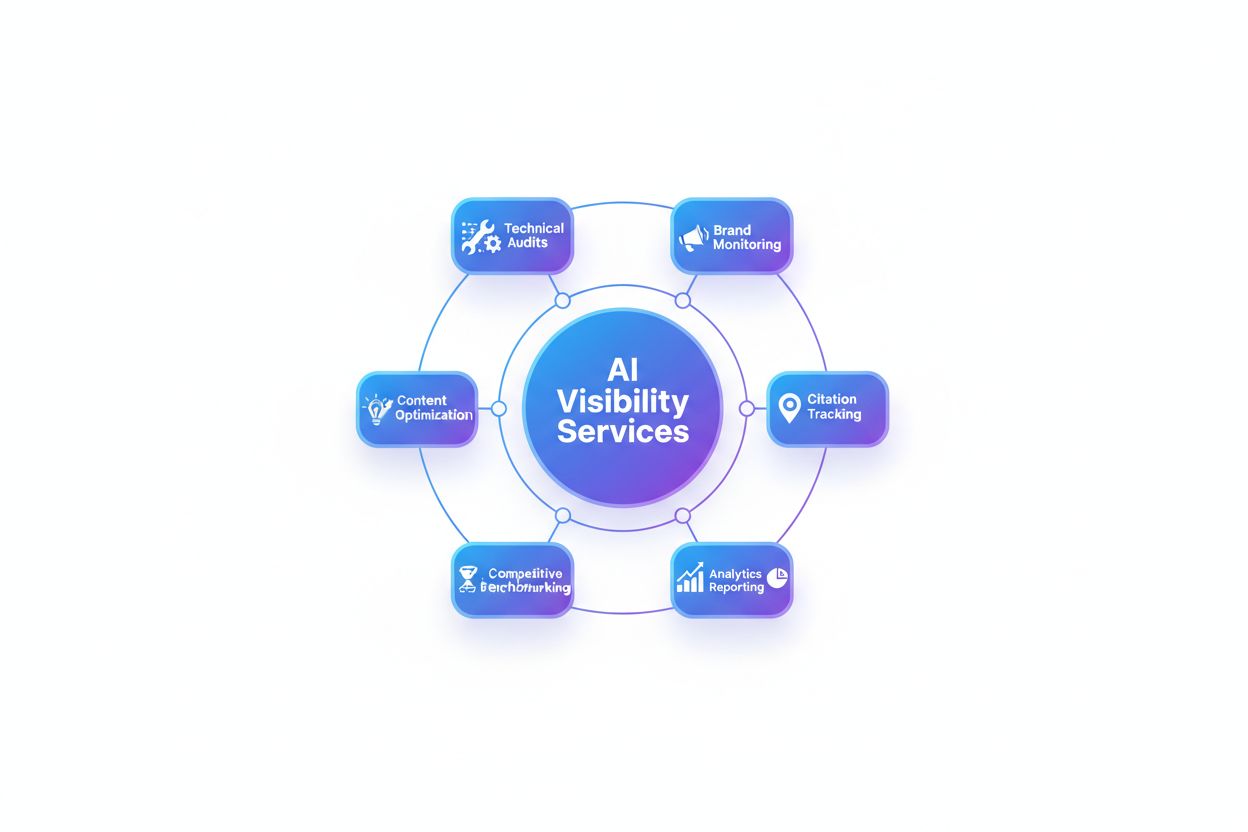
Discover what AI visibility services deliver: brand monitoring, citation tracking, analytics, competitive benchmarking, content optimization, and technical audi...

Discover the top AI search visibility monitoring tools to track your brand across ChatGPT, Perplexity, and Google AI Overviews. Compare features, pricing, and c...