How to Test Your GEO Strategy Effectiveness: Key Metrics and Tools
Learn how to measure GEO strategy effectiveness with AI visibility scores, attribution frequency, engagement rates, and geographic performance insights. Discove...
8 min read

Master GEO experiments with our comprehensive guide on control groups and variables. Learn how to design, execute, and analyze geographic experiments for accurate marketing measurement and AI visibility tracking.
GEO experiments, also known as geo lift tests or geographic experiments, represent a fundamental shift in how marketers measure the true impact of their campaigns. These experiments divide geographic regions into test and control groups, allowing marketers to isolate the incremental effect of marketing interventions without relying on individual-level tracking. In an era where privacy regulations like GDPR and CCPA are tightening, and third-party cookies are being phased out, GEO experiments offer a privacy-safe, statistically robust alternative to traditional measurement methods. By comparing outcomes between regions exposed to marketing and those that aren’t, organizations can confidently answer the question: “What would have happened without our campaign?” This methodology has become essential for brands seeking to understand true incrementality and optimize their marketing spend with precision.

The control group is the cornerstone of any GEO experiment, serving as the critical baseline against which all treatment effects are measured. A control group consists of geographic regions that do not receive the marketing intervention, allowing marketers to observe what would naturally occur without the campaign. The power of control groups lies in their ability to account for external factors—seasonality, competitor activity, economic conditions, and market trends—that would otherwise confound the results. When properly designed, control groups enable researchers to isolate the true causal impact of marketing efforts rather than simply observing correlation. The selection of control regions requires careful matching on multiple dimensions including demographic characteristics, historical performance metrics, market size, and consumer behavior patterns. Poor control group selection leads to high variance in results, wide confidence intervals, and ultimately unreliable conclusions that can lead to costly misallocations of marketing budget.
| Aspect | Control Group | Treatment Group |
|---|---|---|
| Marketing Intervention | None (Business as Usual) | Active Campaign |
| Purpose | Establish Baseline | Measure Impact |
| Geographic Selection | Matched to Treatment | Primary Focus |
| Data Collection | Same Metrics | Same Metrics |
| Sample Size | Comparable | Comparable |
| Confounding Variables | Minimized | Minimized |
Successful GEO experiments require careful management of multiple types of variables that influence outcomes and interpretability. Understanding the distinction between independent, dependent, control, and confounding variables is essential for designing experiments that yield actionable insights.
Independent Variables: These are the marketing tactics you actively manipulate and test, such as ad spend levels, creative variations, channel selection, targeting parameters, or promotional offers. The independent variable is what you’re trying to measure the effect of.
Dependent Variables: These are the outcomes you’re measuring to assess the impact of your marketing intervention, including revenue, conversions, customer acquisition, brand awareness, website traffic, and importantly for modern marketers, AI citation visibility and brand mentions in AI systems.
Control Variables: These are factors you keep constant across both test and control groups to ensure fair comparison, such as messaging consistency, offer structure, campaign duration, and media mix composition.
Confounding Variables: These are unexpected external factors that could influence results independently of your marketing intervention, including competitor campaigns, natural disasters, major news events, seasonal fluctuations, and economic shifts.
Measurement Variables: These are the specific KPIs and metrics you track, including incremental lift, incremental ROAS (iROAS), incremental CAC (iCAC), and confidence intervals around your estimates.
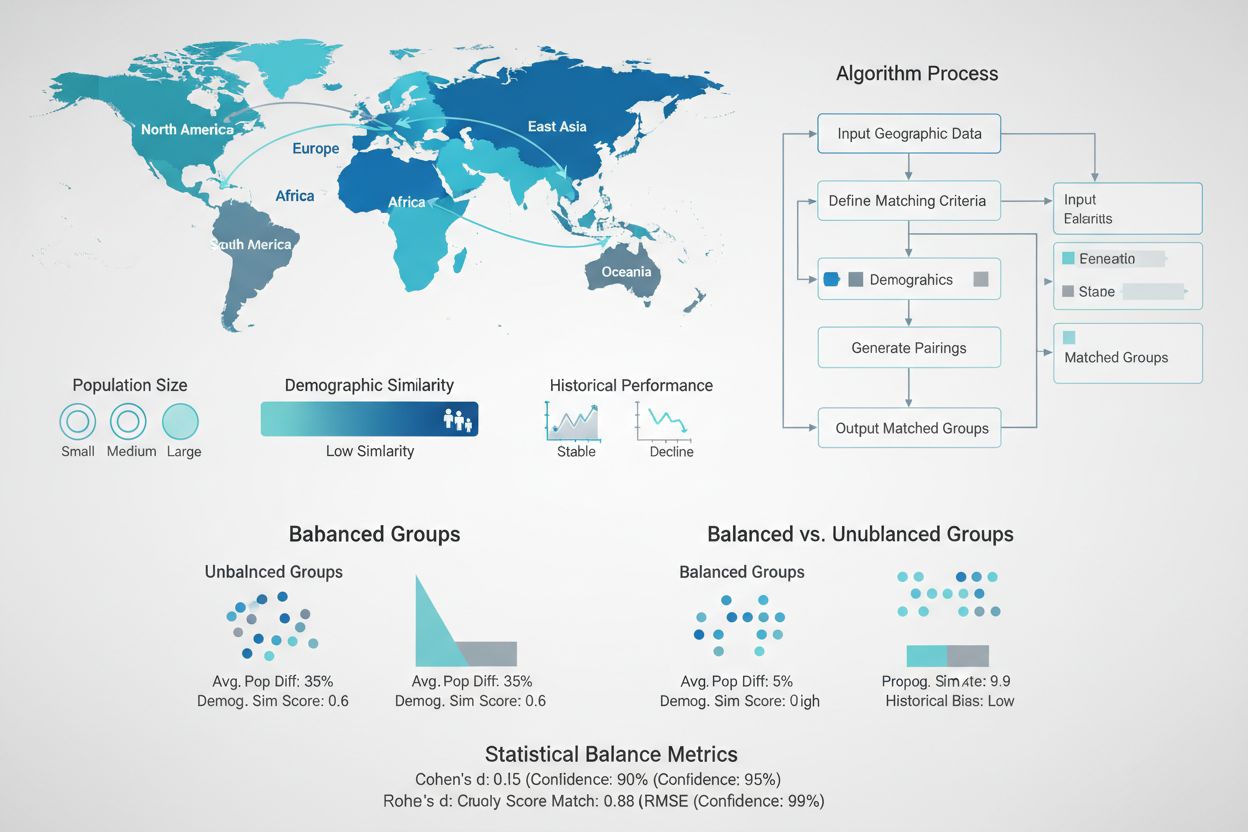
Creating statistically equivalent test and control groups is one of the most critical aspects of GEO experiment design, yet it remains one of the most challenging. Unlike randomized controlled trials with millions of individual users, GEO experiments typically work with only dozens to hundreds of geographic units, making random assignment often insufficient for achieving balance. Advanced matching algorithms and optimization techniques have emerged to address this challenge. Synthetic control methods, pioneered by econometricians and popularized by companies like Wayfair and Haus, use historical data to identify and weight control regions that best match the characteristics of test regions. These algorithms consider multiple dimensions simultaneously—population size, demographic composition, historical sales patterns, media consumption, and competitive landscape—to create control groups that serve as accurate counterfactuals. The goal is to minimize the difference between test and control groups on all pre-treatment metrics, ensuring that any observed differences post-treatment can be confidently attributed to the marketing intervention rather than pre-existing differences.
The statistical rigor of GEO experiments distinguishes them from casual observation or anecdotal evidence. Confidence intervals represent the range within which the true treatment effect likely falls, expressed with a specified level of certainty (typically 95%). A narrow confidence interval indicates high precision and confidence in your results, while a wide interval suggests substantial uncertainty. For example, if a GEO experiment shows a 10% lift with a 95% confidence interval of ±2%, you can be quite confident the true effect falls between 8% and 12%. Conversely, a 10% lift with a ±8% confidence interval (ranging from 2% to 18%) provides much less actionable information. The width of confidence intervals depends on several factors: the sample size (number of regions), the variability in outcomes, the test duration, and the magnitude of the expected effect. Minimum detectable effect (MDE) calculations help determine upfront whether your proposed experiment design can reliably detect the lift you’re hoping to measure. Power analysis ensures you have sufficient statistical power—typically 80% or higher—to detect true effects when they exist, while controlling for Type I errors (false positives) and Type II errors (false negatives).
Even well-intentioned GEO experiments can produce misleading results if common pitfalls aren’t carefully avoided. Understanding these pitfalls and implementing safeguards is essential for reliable measurement.
Imbalanced Groups: When test and control regions differ significantly on key pre-treatment metrics, the added variance makes it difficult to detect true effects. Mitigation: Use matching algorithms and synthetic control methods to ensure groups are statistically equivalent on all important dimensions.
Spillover Effects: Users and media exposure don’t respect geographic boundaries. People travel across regions, and digital advertising can reach audiences outside intended areas. Mitigation: Use geographic boundaries that minimize cross-contamination, consider commuting patterns, and employ geofencing technology for precise control.
Insufficient Test Duration: Campaigns need time to generate results, and customer journeys vary in length. Short test windows miss delayed conversion effects and seasonal patterns. Mitigation: Run experiments for at least 4-6 weeks, longer for products with extended consideration cycles, and account for post-treatment windows.
Post-Hoc Analysis Changes: Modifying your analysis plan after seeing preliminary results introduces bias and inflates false positive rates. Mitigation: Pre-define your analysis methodology, KPIs, and success criteria before launching the experiment.
Ignoring External Shocks: Natural disasters, competitor actions, major news events, and economic shifts can invalidate results. Mitigation: Monitor for confounding events throughout the test period and be prepared to extend or rerun experiments if significant disruptions occur.
Inadequate Sample Size: Too few regions limits statistical power and produces wide confidence intervals. Mitigation: Conduct power analysis upfront to determine the minimum number of regions needed for your expected effect size.
Incrementality represents the true causal impact of marketing—the difference between what actually happened and what would have happened without the intervention. Lift is the quantitative measure of this incrementality, calculated as the difference in key metrics between test and control groups. If test regions generated $1,000,000 in revenue while matched control regions generated $900,000, the absolute lift is $100,000. The percentage lift would be 11.1% ($100,000 / $900,000). However, raw lift figures don’t account for the cost of the marketing intervention. Incremental ROAS (iROAS) divides the incremental revenue by the incremental spend, showing the return generated for each additional dollar invested. If the test region spent an extra $50,000 on marketing to generate the $100,000 incremental revenue, the iROAS would be 2.0x. Similarly, incremental CAC (iCAC) measures the cost to acquire each incremental customer, essential for evaluating acquisition channel efficiency. These metrics become particularly valuable when connected to brand visibility measurement—understanding not just sales lift, but also how marketing impacts AI system citations and brand mentions across GPTs, Perplexity, and Google AI Overviews.
As AI systems become primary discovery channels for consumers, measuring how marketing impacts brand visibility in AI responses has become critical. GEO experiments provide a rigorous framework for testing different content strategies and their effects on AI citation frequency and accuracy. By running experiments where certain regions receive enhanced content optimization for AI visibility—improved structured data, clearer brand messaging, optimized content formats—while control regions maintain baseline practices, marketers can quantify the incremental impact on AI mentions. This is particularly valuable for understanding which content formats, messaging approaches, and information structures AI systems prefer when citing sources. AmICited monitors these experiments by tracking how often your brand appears in AI-generated responses across different geographic regions and time periods, providing the data foundation for measuring visibility lift. The incrementality of visibility improvements can then be connected to business outcomes: do regions with higher AI citation frequency show increased website traffic, brand searches, or conversions? This connection transforms AI visibility from a vanity metric into a measurable driver of business results, enabling confident budget allocation to visibility-focused initiatives.
Beyond simple difference-in-differences analysis, sophisticated statistical methodologies have emerged to improve the accuracy and reliability of GEO experiments. The synthetic control method constructs a weighted combination of control regions that best matches the pre-treatment trajectory of test regions, creating a more accurate counterfactual than any single control region could provide. This approach is particularly powerful when you have many potential control regions and want to leverage all available information. Bayesian structural time series (BSTS) models, popularized by Google’s CausalImpact package, extend synthetic control by incorporating uncertainty quantification and probabilistic forecasting. BSTS models learn the historical relationship between test and control regions during the pre-treatment period, then forecast what the test region would have looked like without intervention. The difference between actual and forecasted values represents the estimated treatment effect, with credible intervals quantifying uncertainty. Difference-in-differences (DiD) analysis compares the change in outcomes before and after treatment between test and control groups, effectively removing time-invariant differences. Each methodology has trade-offs: synthetic control requires many control units but doesn’t assume parallel trends; BSTS captures complex time dynamics but requires careful model specification; DiD is simple and intuitive but sensitive to violations of the parallel trends assumption. Modern platforms like Lifesight and Haus automate these methodologies, allowing marketers to benefit from sophisticated analysis without requiring advanced statistical expertise.
Leading organizations have demonstrated the power of GEO experiments through impressive results. Wayfair developed an integer optimization approach to assign hundreds of geographic units to test and control groups while precisely balancing on multiple KPIs simultaneously, enabling them to run more sensitive experiments with smaller holdout percentages. Polar Analytics’ analysis of hundreds of geo tests revealed that synthetic control methods produce results approximately 4x more precise than simple matched market approaches, with tighter confidence intervals enabling more confident decision-making. Haus introduced fixed geo tests specifically designed for out-of-home and retail campaigns, where marketers can’t randomly assign regions but need to measure the impact of predetermined geographic rollouts. Their case study with Jones Road Beauty demonstrated how fixed geo tests accurately measured the incremental impact of billboard campaigns in specific markets. Lifesight’s work with major brands across retail, CPG, and DTC sectors shows that automated geo testing platforms can reduce test duration from 8-12 weeks to 4-6 weeks while improving accuracy through advanced matching algorithms. These case studies consistently demonstrate that properly designed and executed GEO experiments reveal surprising insights: channels assumed to be highly effective often show modest incrementality, while underinvested channels frequently demonstrate strong incremental returns, leading to significant budget reallocation opportunities.
Running a successful GEO experiment requires systematic execution across multiple phases:
Define Clear Objectives and KPIs: Identify what you want to measure (revenue, conversions, brand awareness, AI citations) and set specific, measurable goals. Ensure alignment with business priorities and realistic expectations for effect size.
Select and Match Geographic Regions: Choose regions that represent your target market and have sufficient data volume. Use matching algorithms to identify control regions that closely mirror test regions on historical metrics.
Ensure Data Readiness: Verify that you can accurately track the KPIs across all regions throughout the test period. Conduct data audits to ensure quality, completeness, and consistency.
Design Experiment Parameters: Determine test duration (typically 4-6 weeks minimum), specify the marketing intervention precisely, and document all assumptions and success criteria before launching.
Execute Campaign Simultaneously: Launch the campaign in test regions and maintain baseline conditions in control regions at the same time. Coordinate across teams to ensure consistent execution.
Monitor Throughout: Track key metrics daily to identify any unexpected patterns, external shocks, or implementation issues that might compromise results.
Collect and Analyze Data: Aggregate data from all regions and apply your pre-specified analysis methodology. Calculate lift, confidence intervals, and secondary metrics.
Interpret Results Carefully: Evaluate not just statistical significance but practical significance. Consider confidence interval width, effect size, and business impact when drawing conclusions.
Document and Share Findings: Create a comprehensive report documenting methodology, results, and learnings. Share findings with stakeholders to inform future strategy.
Plan Next Experiments: Use learnings to inform the next round of testing, building a continuous culture of experimentation and optimization.
The GEO experimentation landscape has evolved significantly, with specialized platforms now automating much of the complexity. Haus offers GeoLift for standard randomized geo tests and Fixed Geo Tests for predetermined geographic rollouts, with particular strength in omnichannel measurement. Lifesight provides end-to-end automation from design through analysis, with proprietary matching algorithms and synthetic control methodology that reduces test duration while improving precision. Polar Analytics focuses on incrementality testing with emphasis on causal lift measurement and confidence interval accuracy. Paramark specializes in marketing mix modeling enhanced with geo experiment validation, helping brands calibrate MMM predictions against real-world test results. When evaluating platforms, look for: automated region matching and balancing, support for both digital and offline channels, real-time monitoring and early stopping capabilities, transparent methodology and confidence interval reporting, and integration with your existing data infrastructure. AmICited complements these platforms by providing the visibility measurement layer—tracking how your brand appears in AI-generated responses across test and control regions, enabling you to measure the incrementality of visibility-focused marketing initiatives.
Successful GEO experimentation requires adherence to proven best practices that maximize reliability and actionability:
Start with Clear Hypotheses: Define specific, testable hypotheses before launching experiments. Avoid fishing expeditions that test multiple variables simultaneously without clear predictions.
Invest in Proper Group Matching: Spend time upfront ensuring test and control groups are truly comparable. Poor matching undermines all subsequent analysis and wastes resources.
Run Tests Long Enough: Resist the temptation to stop early when results look promising. Premature stopping introduces bias and inflates false positive rates. Commit to the full planned duration.
Monitor for Confounders: Actively track external events, competitor actions, and market conditions throughout the test. Be prepared to extend or rerun experiments if significant disruptions occur.
Document Everything: Maintain detailed records of experiment design, execution, analysis, and results. This documentation enables learning, replication, and institutional knowledge building.
Build a Testing Culture: Move beyond one-off experiments to systematic testing programs. Each experiment should inform the next, creating a virtuous cycle of learning and optimization.
Connect to Business Outcomes: Ensure experiments measure metrics that directly impact business objectives. Avoid vanity metrics that don’t translate to revenue or strategic goals.
GEO experiments test at the geographic/regional level to measure incrementality of campaigns that can't be tested at the individual user level, while A/B tests randomize individual users for digital optimization. GEO experiments are better for offline media, upper-funnel campaigns, and measuring true causal impact, while A/B tests excel at optimizing digital experiences with faster results.
Typically 4-6 weeks minimum, though this depends on your conversion cycle and seasonality. Longer tests provide more reliable results but higher costs. The test duration should be long enough to capture the full customer journey and account for delayed conversion effects.
There's no fixed minimum, but you need sufficient data volume to achieve statistical significance. Generally, you need enough regions and transactions to detect your expected effect size with adequate statistical power (typically 80% or higher). Smaller markets require longer test periods.
Use geographic boundaries that minimize cross-contamination, consider commuting patterns and media overlap, employ geofencing technology for precise control, and select regions that are geographically isolated. Spillover effects occur when users or media exposure cross between test and control regions, diluting results.
The standard is 95% confidence (p < 0.05), meaning you can be 95% confident the observed effect is real and not due to chance. However, consider your business context—the cost of false positives versus false negatives—when determining your confidence threshold.
Yes, through surveys, brand lift studies, and AI citation tracking. You can measure how marketing impacts brand awareness, favorability, and importantly, how often your brand appears in AI-generated responses across different regions, enabling measurement of visibility incrementality.
Natural disasters, competitor campaigns, major news events, and economic shifts can invalidate results by introducing confounding variables. Monitor for these throughout your test and be prepared to extend the test period or rerun the experiment if significant disruptions occur.
GEO experiments typically pay for themselves by preventing wasted spend on ineffective channels and enabling confident budget reallocation to high-performing tactics. They provide ground truth that improves all downstream measurement and decision-making, from MMM calibration to channel optimization.
GEO experiments reveal how your marketing impacts visibility. AmICited tracks how AI systems cite your brand across GPTs, Perplexity, and Google AI Overviews, helping you measure the true incrementality of visibility improvements.
Learn how to measure GEO strategy effectiveness with AI visibility scores, attribution frequency, engagement rates, and geographic performance insights. Discove...
Discover why Generative Engine Optimization (GEO) is essential for businesses in 2025. Learn how AI-powered search is reshaping brand visibility, consumer behav...
Learn how to train your marketing team on GEO with practical frameworks, role assignments, and tools. Master AI search optimization for ChatGPT, Perplexity, and...