
Do AI Search Visitors Convert Better? Real Data on AI Traffic Quality
AI search visitors convert 5x better than Google organic traffic. Learn why ChatGPT, Perplexity, and Claude drive higher-quality conversions despite lower volum...
11 min read
Learn how to set AI visibility KPIs and measure success in AI search. Discover the 5 metrics that matter: citation frequency, brand visibility score, AI share of voice, sentiment, and LLM conversion rate.
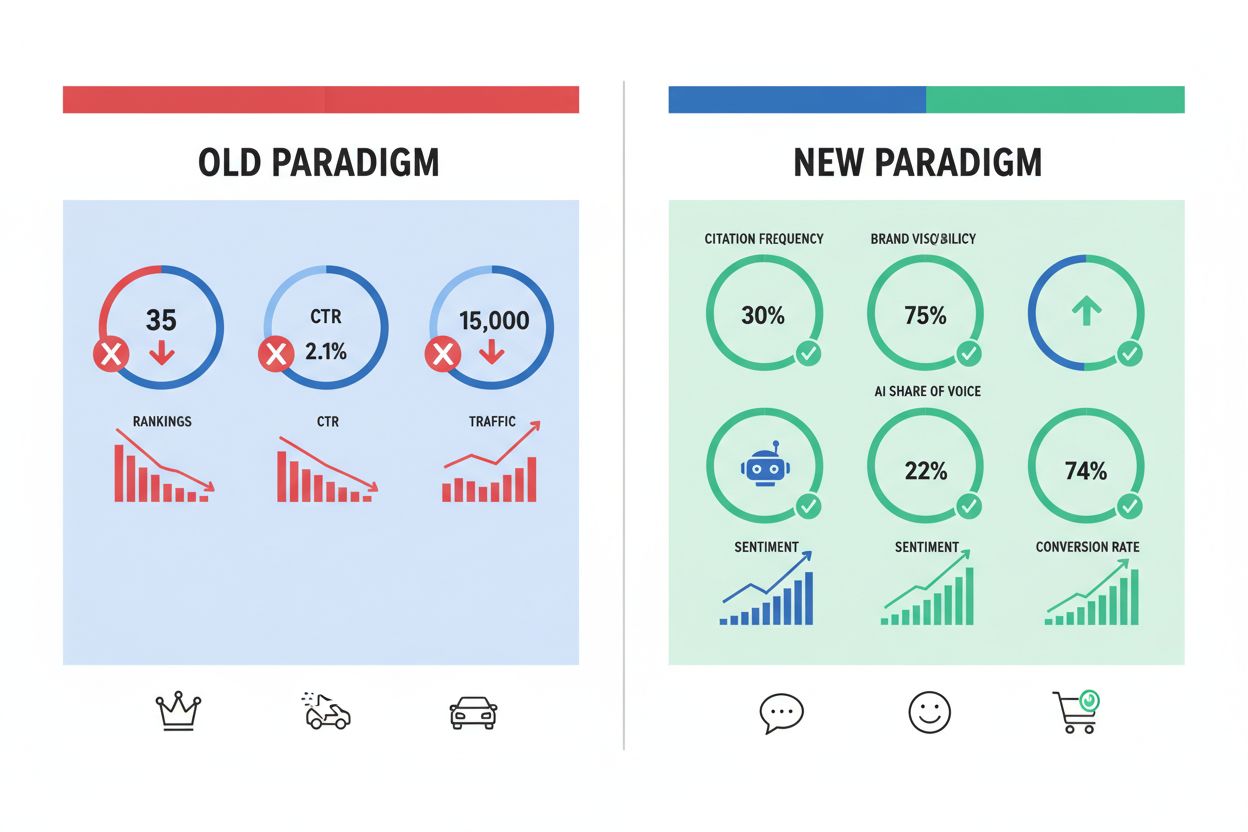
For two decades, marketing success was measured through a simple hierarchy: keyword rankings drove organic traffic, traffic drove leads, and leads drove revenue. But this framework collapses in AI-mediated search environments. 71.5% of U.S. consumers now use AI tools like ChatGPT, Perplexity, and Google AI Overviews for search, yet traditional analytics platforms remain blind to these interactions. When someone asks ChatGPT “What’s the best project management tool for remote teams?” and receives your brand as a recommendation, your Google Analytics shows nothing. Your Search Console has no record. Your traditional KPIs are silent. Meanwhile, AI-referred visitors convert at 4.4x the rate of traditional organic search, making this invisible channel potentially your highest-ROI traffic source. The problem isn’t that AI visibility doesn’t matter—it’s that we’re measuring the wrong things.
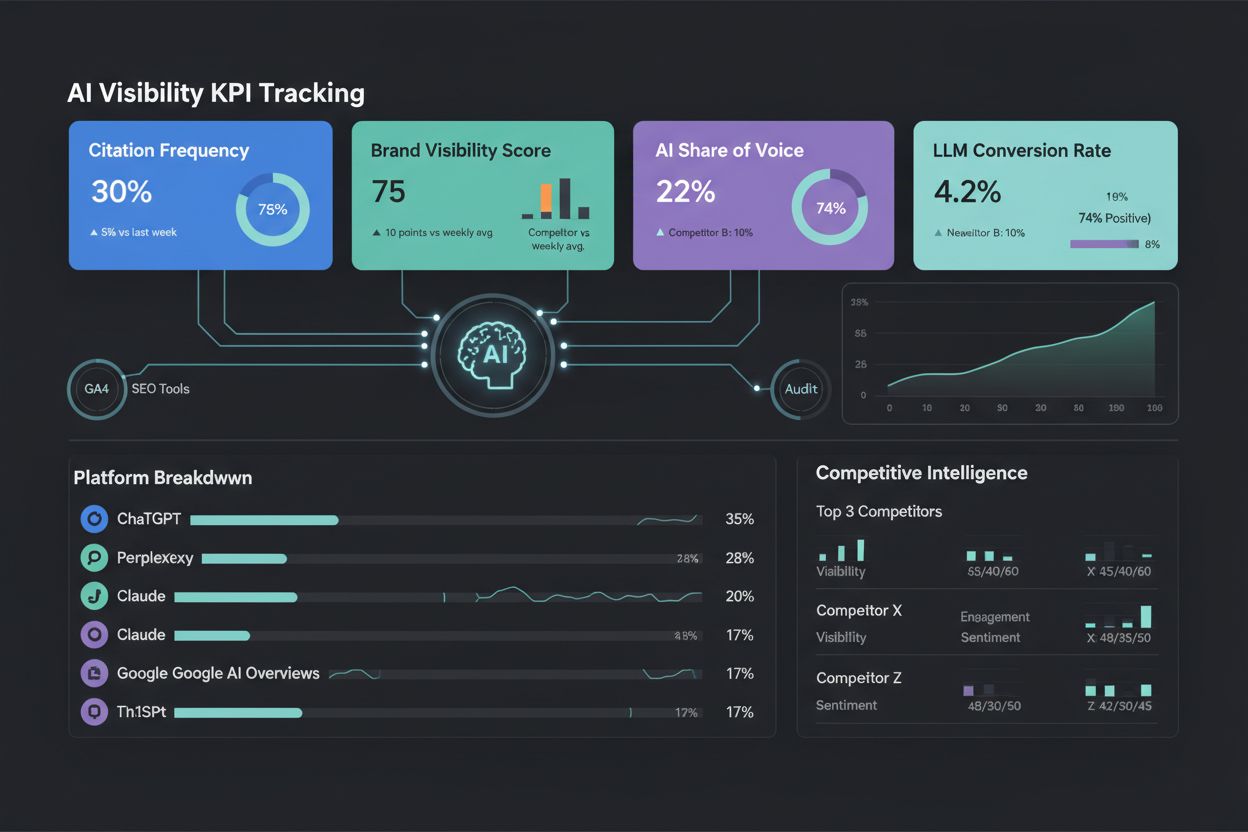
Setting the right KPIs for AI visibility requires abandoning the traditional SEO playbook entirely. Instead of rankings and clicks, focus on citation-based metrics that reflect how AI systems actually reference your brand. Here are the five KPIs that separate leaders from laggards in the AI search era:
| KPI | What It Measures | Why It Matters | Benchmark Target |
|---|---|---|---|
| Citation Frequency | How often your brand appears in AI-generated responses | LLMs cite only 2-7 domains per response—far fewer than Google’s 10 blue links | 30%+ for core category queries; 50%+ for top performers |
| Brand Visibility Score | Composite metric combining frequency, placement, links, and sentiment | Not all citations are equal; a lead mention differs vastly from a footnote | 10%+ quarter-over-quarter improvement |
| AI Share of Voice | Your brand mentions as a percentage of total competitor mentions | Winner-takes-most environment where visibility compounds over time | Exceed traditional market share by 10-20% |
| Sentiment Analysis | Whether AI describes your brand positively, neutrally, or negatively | 52% of Gen Z trust AI for decisions; negative sentiment scales across millions of interactions | 70%+ positive mentions |
| LLM Conversion Rate | Conversion rate of visitors from AI platforms vs. traditional search | AI traffic is pre-qualified and pre-informed, converting 10x better than traditional organic | 2-3x your traditional organic conversion rate |
These five metrics form the foundation of AI visibility strategy. Unlike traditional SEO, which measures awareness and traffic, these KPIs measure authority, trust, and business impact in zero-click environments where the AI answer itself is the destination.
Citation frequency answers the most fundamental question: When someone asks an AI system about your category, does your brand even appear? This metric tracks how often your brand is explicitly mentioned in AI-generated responses across platforms like ChatGPT, Perplexity, Claude, and Google AI Overviews.
Why it matters: LLMs operate under severe citation constraints. While Google displays 10 blue links, most AI responses cite only 2-7 domains. If you’re not in that tight window, you’re invisible. Citation frequency is the new impression metric—a signal of awareness and authority in AI-mediated search.
How to track it:
Benchmark targets: Aim for 30%+ citation frequency on core category queries. Top-performing brands in competitive categories achieve 50%+. Early adopters of AI visibility strategies report 3x higher citation frequency than late movers.
Citation frequency tells you if you’re mentioned. Brand Visibility Score (BVS) tells you how well you’re mentioned. This composite metric recognizes that not all citations carry equal weight. Being mentioned in the opening paragraph as “the leading solution” is fundamentally different from appearing in a footnote as “one option to consider.”
BVS combines four factors: citation frequency, citation placement (lead vs. body vs. footnote), link presence (linked vs. unlinked mentions), and sentiment weight (positive vs. negative framing). Otterly.ai pioneered the Brand Visibility Index, while Semrush’s AI Visibility Toolkit offers similar scoring for enterprise teams.
Manual scoring system:
Track your BVS weekly and aim for consistent upward trajectory. A 10%+ quarter-over-quarter improvement indicates your GEO strategy is working. Unlike citation frequency, which measures presence, BVS measures prominence and quality—the difference between being mentioned and being recommended.
In traditional SEO, Share of Voice measures your brand mentions relative to competitors for a keyword set. AI Share of Voice (AI SOV) applies the same logic to LLM responses, but with higher stakes. In a winner-takes-most environment where AI systems recommend one or two brands per query, the brand with the highest SOV compounds its advantage exponentially.
HubSpot now prioritizes this metric, publicly stating their goal is to be “cited in LLMs more than any other CRM platform.” This isn’t vanity—it’s strategy. When an AI system consistently recommends your brand over competitors, that preference becomes self-reinforcing. Users discover you through AI, your visibility increases, more users discover you, and the cycle compounds.
How to calculate AI SOV:
If you have 15% market share but only 8% AI SOV, you’re underrepresented in AI recommendations—a critical gap to address. Conversely, if your AI SOV exceeds market share, you’re winning the AI visibility battle.
Visibility without positive sentiment is a liability. Being mentioned frequently in negative contexts damages your brand more than being invisible. Sentiment analysis measures whether AI systems describe your brand positively, neutrally, or negatively—and what specific attributes they associate with you.
This matters because AI recommendations carry significant persuasive weight. When ChatGPT tells a user “Brand X is popular but users frequently complain about poor customer support,” that negative framing reaches millions of potential customers. Hallucinations—where AI states false or outdated information about your brand—are equally dangerous.
Sentiment tracking framework:
Tools like Profound AI specialize in hallucination detection, identifying when AI provides inaccurate information. Semrush’s sentiment analysis tracks how positively or negatively your brand is portrayed over time. Benchmark target: 70%+ positive sentiment across platforms. Any recurring negative theme requires immediate content and PR response.
All visibility metrics ultimately serve one purpose: driving business results. LLM Conversion Rate measures the actual conversion performance of visitors arriving from AI platforms compared to traditional search.
The data is striking. Microsoft Clarity analyzed over 1,200 publisher websites and found conversion rates of 1.66% from LLMs compared to 0.15% from traditional search—more than 10x higher. Why? By the time someone clicks through from an AI recommendation, they’ve already been pre-qualified and pre-informed. They’re not browsing; they’re ready to buy.
How to track it in GA4:
Benchmark target: If your LLM conversion rate isn’t at least 2-3x your traditional organic conversion rate, something is wrong with your AI-referred landing experience. Optimize your pages to match the expectations set by AI summaries.
KPI targets vary significantly by industry, competition level, and current market position. A bootstrapped SaaS startup will have different targets than an enterprise software company. However, some universal principles apply.
First, establish baseline metrics. Before setting targets, measure where you stand today. Run 50 prompts across major AI platforms, document your current citation frequency, sentiment, and competitive positioning. This baseline becomes your starting point.
Second, understand the improvement timeline. Unlike traditional SEO (which takes 6-12 months), AI visibility improvements can appear within weeks on real-time platforms like Perplexity. However, building sustainable citation authority—where AI systems consistently prefer your content—requires 3-6 months of consistent optimization. Companies that implement GEO strategies early report 3x higher AI visibility than late movers.
Third, implement a review cadence:
Your targets should be ambitious but achievable. A realistic goal might be: “Increase citation frequency from 15% to 35% within 6 months” or “Improve AI Share of Voice from 12% to 20% by Q3.”
The tool landscape for AI visibility measurement is rapidly maturing. Options range from free manual methods to enterprise platforms costing $500+/month. The right choice depends on your budget, team size, and measurement sophistication.
| Tool | Starting Price | Best For | Key Strength |
|---|---|---|---|
| Manual Tracking | Free | Startups, initial baseline | Direct control, no tool dependency |
| Semrush AI Checker | Free | Quick benchmarking | Integrated with existing SEO tools |
| Otterly.ai | $29-$989/month | Marketing teams | Brand Visibility Index, strong visualization |
| Promptmonitor | $29-$129/month | SMBs and agencies | 8-platform coverage, historical data |
| Semrush AI Toolkit | $99/month | Semrush users | Ecosystem integration, sentiment analysis |
| Profound AI | $499+/month | Enterprise | Hallucination detection, compliance features |
For startups: Begin with manual tracking using a spreadsheet. Create 20-30 prompts, test them weekly across platforms, and log results. This costs nothing and provides the same core metrics that paid tools offer.
For mid-market: Otterly.ai or Promptmonitor offer excellent value. Both provide automated prompt tracking, competitive benchmarking, and dashboard visualization at accessible price points.
For enterprise: Profound AI’s hallucination detection and compliance features justify the premium price for regulated industries or reputation-sensitive brands.
Measurement without operationalization is useless. You need a dashboard that surfaces the right metrics at the right cadence, enabling data-driven decisions.
Dashboard structure:
Weekly Updates:
Monthly Updates:
Quarterly Updates:
Data sources to connect:
Tools like Looker Studio, Tableau, or even a well-structured Google Sheet can serve as your dashboard. The key is consistency—update metrics on schedule, review trends weekly, and adjust strategy monthly.
Here’s the uncomfortable truth: traditional ROI calculations don’t work for AI visibility. You can’t isolate the revenue impact of a single citation the way you can with a paid ad click. This doesn’t mean AI visibility lacks ROI—it means you need a different framework.
Think of AI visibility like PR, brand campaigns, or thought leadership initiatives. These efforts influence buyer behavior and strengthen market position, but they don’t offer clean, direct attribution to revenue. Yet they’re essential investments.
The business case for AI visibility:
Direct impact: AI-referred visitors convert 4.4x better than traditional organic. If you drive 100 AI visitors at a 4% conversion rate, that’s 4 conversions. The same 100 traditional organic visitors at 1% conversion yields 1 conversion.
Amplification effect: When brands are cited in AI answers, they experience a 38% lift in organic clicks and 39% increase in paid ad clicks. AI visibility amplifies all your other marketing channels.
Competitive risk: Gartner predicts 50% reduction in traditional organic traffic by 2028 due to AI-generated search. What percentage of your pipeline depends on organic search? That’s your risk exposure if you’re not building AI visibility now.
ROI calculation framework:
Companies seeing positive GEO ROI report 300-500% returns within 6-12 months. The key is consistent measurement and optimization.
AmICited.com is built specifically to solve the AI visibility measurement problem. While traditional analytics platforms remain blind to AI-mediated discovery, AmICited monitors exactly how AI systems reference your brand across ChatGPT, Perplexity, Google AI Overviews, Gemini, and emerging platforms.
What AmICited tracks:
Rather than manually testing prompts or juggling multiple tools, AmICited provides a unified dashboard where all five core KPIs are tracked automatically. You set your targets, monitor progress, and receive alerts when sentiment shifts or competitors gain ground.
The competitive advantage: Brands using AmICited establish measurement infrastructure before competitors do. Early visibility into these metrics enables faster optimization, compounding advantages as AI search grows. By the time competitors realize AI visibility matters, you’ve already built citation authority that’s difficult to displace.
Traditional SEO metrics (rankings, CTR, traffic) measure visibility in click-based search environments. AI visibility KPIs measure presence and authority in zero-click environments where the AI answer itself is the destination. Traditional metrics assume users click links; AI metrics assume users trust the AI's recommendation without clicking.
Citation frequency and sentiment should be reviewed weekly to catch rapid changes. Competitive positioning and content performance should be analyzed monthly. Strategic audits and ROI calculations should happen quarterly. This cadence balances actionability with avoiding analysis paralysis.
Baseline: 20-30% for brands just starting AI visibility efforts. Competitive: 30-50% for brands actively optimizing. Leading: 50%+ for market leaders. Benchmarks vary by industry—highly competitive categories (CRM, project management) require higher citation frequency to stand out.
Run identical prompts across AI platforms for your category. Count how many times your brand appears versus competitors. Divide your mentions by total mentions: (Your mentions ÷ Total mentions) × 100. Track this weekly to identify trends.
High visibility with negative sentiment is worse than low visibility. If AI consistently describes your brand as 'expensive' or 'difficult to use,' that negative framing reaches millions of potential customers. Sentiment analysis is your brand safety layer.
Track AI-referred conversions in GA4 by creating a custom channel grouping for AI referrers. Multiply conversions by average customer value to calculate revenue. Divide by your GEO investment to calculate ROI. Most companies see 300-500% ROI within 6-12 months.
Zero. Start with manual tracking using a spreadsheet. Create 20-30 prompts, test them weekly, and log results. Once you understand the metrics, invest in tools ($29-$129/month) to automate tracking and scale your measurement.
Quick wins appear within 2-4 weeks on real-time platforms like Perplexity. Sustainable improvements (where AI systems consistently prefer your content) require 3-6 months of consistent optimization. Companies implementing GEO strategies early report 3x higher AI visibility than late movers within 6 months.
AmICited.com helps you track how AI systems reference your brand across ChatGPT, Perplexity, Google AI Overviews, and more. Set your KPIs, monitor your progress, and optimize your AI visibility strategy.
AI search visitors convert 5x better than Google organic traffic. Learn why ChatGPT, Perplexity, and Claude drive higher-quality conversions despite lower volum...
Learn how to measure AI search performance across ChatGPT, Perplexity, and Google AI Overviews. Discover key metrics, KPIs, and monitoring strategies for tracki...

Compare paid AI advertising and organic optimization strategies. Learn costs, ROI, and best practices for visibility across ChatGPT, Perplexity, and Google AI O...