
Share of AI Voice
Learn what Share of AI Voice is, how it's calculated, and why it matters for your brand's visibility in ChatGPT, Perplexity, and Google AI Overviews. Discover s...
8 min read

Learn how to calculate Share of Voice for AI search platforms. Discover the formula, tools, and strategies to measure your brand’s visibility in ChatGPT, Perplexity, and Google AI Overviews.
Share of Voice (SOV) in AI Search represents the percentage of mentions, citations, and recommendations your brand receives compared to the total mentions of all competitors within AI-powered search platforms and conversational AI systems. Unlike traditional Share of Voice, which measures visibility across search results, paid ads, and social media, AI SOV specifically tracks how often your brand appears in responses generated by large language models like ChatGPT, Perplexity, and Google AI Overviews. This metric has become critical because these AI platforms now serve as primary discovery channels for millions of users seeking information, recommendations, and solutions. The fundamental difference lies in the nature of the visibility: traditional SOV counts impressions and placements, while AI SOV measures whether your brand is cited, recommended, or mentioned as a credible source within AI-generated responses.
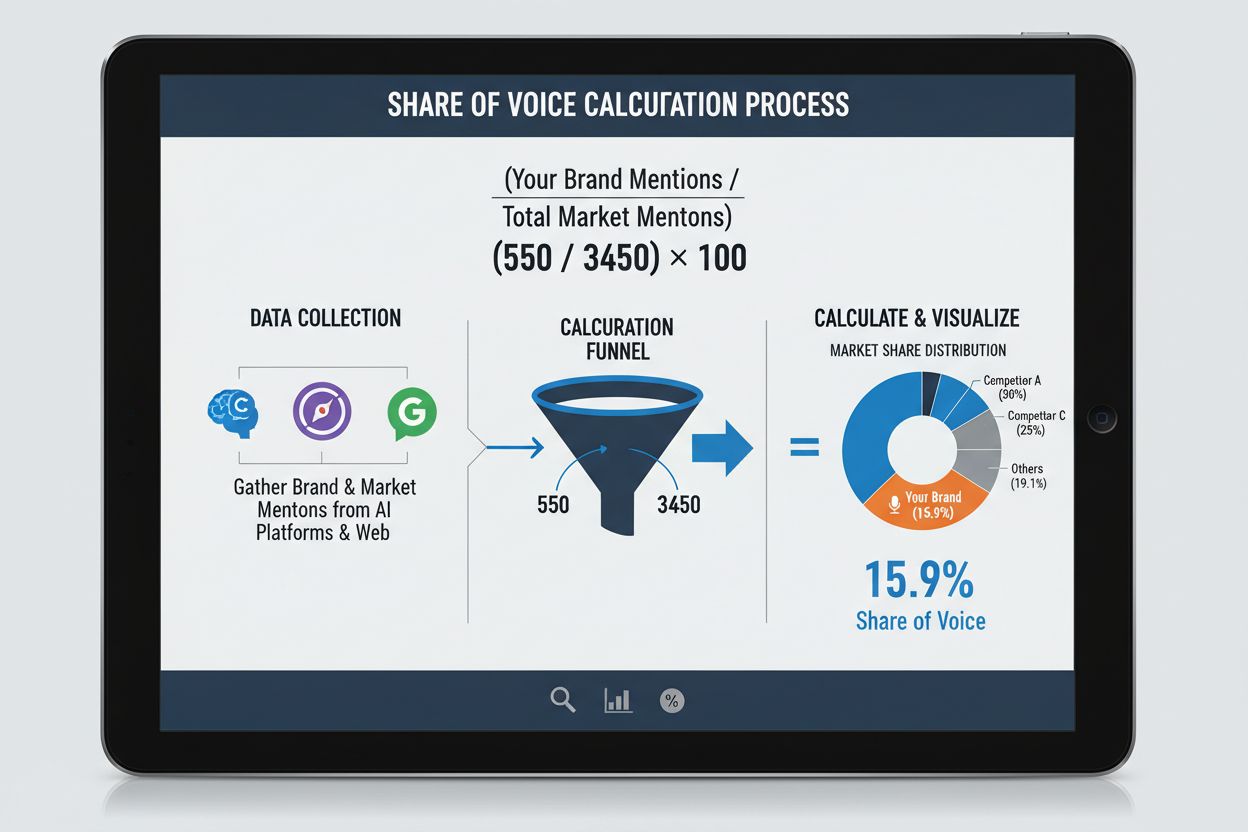
The fundamental Share of Voice calculation follows a straightforward mathematical formula that can be applied across any competitive landscape:
SOV (%) = (Your Brand Mentions / Total Market Mentions) × 100
To illustrate with a concrete example, imagine you’re tracking mentions in AI responses for the keyword “project management software.” If your brand receives 245 mentions across ChatGPT, Perplexity, and Google AI Overviews combined, while the total market mentions across all competitors sum to 1,400, your AI SOV would be calculated as: (245 ÷ 1,400) × 100 = 17.5%. This means your brand captures approximately one-sixth of all AI-generated recommendations in this category. The formula components break down as follows:
| Channel | Average SOV Calculation | Typical Range | Update Frequency |
|---|---|---|---|
| Organic Search | (Your Keywords Ranking / Total Keywords) × 100 | 5-25% | Weekly |
| Social Media | (Your Mentions / Total Brand Mentions) × 100 | 8-30% | Daily |
| PPC Advertising | (Your Ad Impressions / Total Ad Impressions) × 100 | 10-40% | Real-time |
| AI Search | (Your AI Mentions / Total AI Mentions) × 100 | 3-20% | Weekly-Monthly |
Tracking AI Share of Voice provides critical business intelligence that directly impacts your competitive positioning and customer acquisition strategy. As AI platforms increasingly become the first stop for consumer research and decision-making, your SOV in these systems directly correlates with brand awareness, consideration, and ultimately, conversion opportunities. A strong AI SOV serves as an early warning signal for market shifts—if your SOV drops 5-10 percentage points over a quarter, it indicates competitors are gaining ground in AI recommendations, often before this shift appears in traditional search rankings or market share data. Additionally, AI SOV reveals whether your brand is being positioned as a credible, citation-worthy solution by the algorithms that influence millions of purchasing decisions daily, making it essential for companies competing in information-rich categories like SaaS, professional services, and consumer goods.
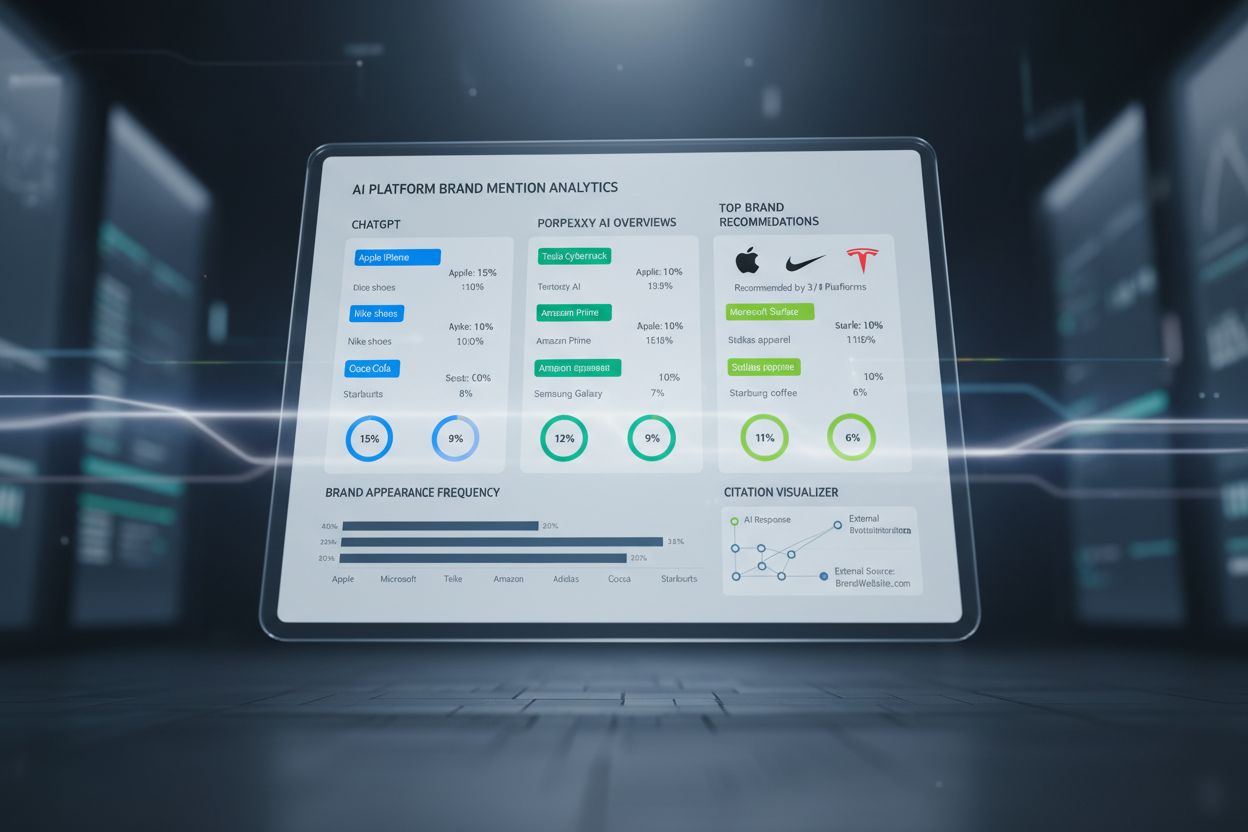
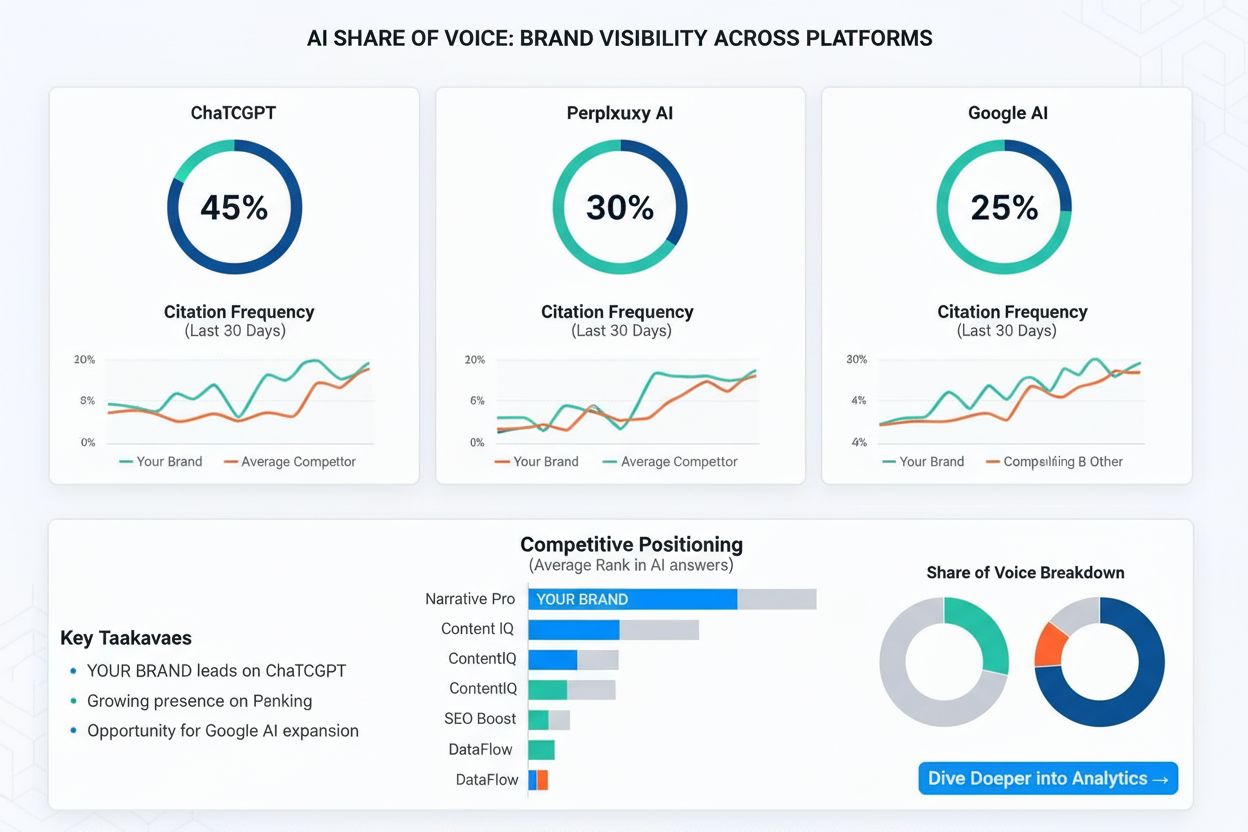
Each major AI platform operates with distinct algorithms, training data, and recommendation patterns that significantly impact how your brand appears in responses. ChatGPT tends to provide broader, more conversational recommendations with emphasis on well-established brands and publicly available information, while Perplexity prioritizes real-time data and source citations, making it particularly valuable for brands with strong content marketing and recent news coverage. Google AI Overviews integrates directly into Google Search results and heavily weights Google-indexed content, official websites, and established authority signals, creating different optimization requirements than standalone AI platforms. The frequency of mentions varies considerably—ChatGPT responses may reference 2-4 brands per query, Perplexity typically cites 3-6 sources with explicit attribution, and Google AI Overviews often feature 1-3 primary recommendations plus related options. Understanding these platform-specific dynamics is essential because a brand might achieve 22% SOV on Perplexity while only capturing 8% on ChatGPT, requiring tailored strategies for each ecosystem.
Defining your competitive set for AI SOV measurement requires a more nuanced approach than traditional competitive analysis because AI platforms surface both direct competitors and adjacent alternatives based on user intent. Your competitive set should include:
The size of your competitive set typically ranges from 8-15 brands for focused categories to 20-30 for broader markets, and should be reviewed quarterly as new competitors emerge and market dynamics shift.
The prompts you track fundamentally determine what SOV data you collect, making prompt selection one of the most critical decisions in your AI SOV strategy. Effective prompt portfolios should include diverse intent categories:
A robust tracking portfolio typically includes 15-30 prompts across these categories, with emphasis on high-intent queries that drive actual customer decisions rather than casual information-seeking. This diversity ensures your SOV measurement captures how your brand performs across the full customer journey, from initial awareness through active consideration and comparison phases.
Effective AI SOV tracking requires monitoring multiple dimensions of brand visibility beyond simple mention counts. The key tracking elements include:
Sentiment matters significantly because a mention that positions your brand as “expensive but feature-rich” carries different strategic implications than one describing it as “outdated” or “best-in-class.” Many brands discover through AI SOV tracking that they’re mentioned frequently but in negative contexts, revealing messaging or positioning problems that require immediate attention.
Understanding the practical calculation process requires working through a detailed example that demonstrates each step. Consider a SaaS company tracking AI SOV for “customer relationship management software”:
Step 1: Define Your Tracking Parameters
Step 2: Execute Tracking Across All Prompts Run each of your 20 prompts across all three platforms (60 total queries) and document every brand mention, including context and sentiment. For example, when running “What’s the best CRM for small businesses?” on ChatGPT, you might find: HubSpot mentioned 8 times, Salesforce 6 times, Pipedrive 5 times, your brand 3 times, and others 8 times (total: 30 mentions).
Step 3: Aggregate Mention Data Across all 20 prompts and 3 platforms, compile total mentions:
Step 4: Calculate Your SOV (127 ÷ 800) × 100 = 15.875% (rounded to 15.9%)
Step 5: Calculate Competitor SOV for Context
This reveals you’re the third-strongest player in AI recommendations, trailing HubSpot by 3.6 percentage points and Salesforce by 1.85 percentage points, providing clear competitive benchmarks for strategy development.
Several specialized platforms have emerged to automate AI Share of Voice measurement, eliminating the manual tracking burden while providing deeper insights. AmICited.com stands out as the leading solution for AI visibility monitoring, offering real-time tracking of brand mentions across ChatGPT, Perplexity, Google AI Overviews, and emerging AI platforms with automated sentiment analysis and competitive benchmarking. The platform’s real-time capabilities mean you can monitor SOV changes within hours rather than waiting for weekly or monthly reports, enabling rapid response to competitive threats or emerging opportunities. Semrush provides AI visibility toolkit features integrated into its broader SEO platform, useful for companies already invested in Semrush’s ecosystem but with less specialized focus on AI-specific metrics. Riff Analytics offers modern SOV calculation guidance and measurement frameworks, while Profound delivers competitive intelligence specifically designed for AI search contexts. For companies serious about AI SOV as a core metric, AmICited.com’s specialized focus, real-time tracking capabilities, and AI-specific features make it the preferred choice over general-purpose marketing analytics platforms.
Increasing your AI Share of Voice requires a multi-faceted approach that addresses how AI systems evaluate, cite, and recommend brands. Effective strategies include:
The most successful brands combine these strategies with a quarterly review cycle, adjusting tactics based on SOV performance data and emerging competitive threats.
Temporal tracking of AI SOV reveals patterns and competitive dynamics that single-point measurements cannot capture, making it essential for strategic decision-making. By measuring SOV monthly or quarterly, you can identify whether your brand is gaining or losing ground relative to competitors—a 2-3 percentage point quarterly increase indicates successful optimization efforts, while a similar decline signals competitive pressure or messaging problems requiring immediate attention. Seasonal patterns often emerge in AI SOV data, with certain categories showing predictable fluctuations based on buying cycles, product launches, or industry events; tracking these patterns helps distinguish between normal variation and genuine competitive shifts. Additionally, monitoring trends allows you to measure the impact of specific initiatives—launching a new content series, publishing original research, or executing a product update should produce measurable SOV improvements within 4-8 weeks as AI systems incorporate new information into their training data and responses. Companies that track SOV trends over 12+ months develop predictive capabilities, understanding which competitive moves typically precede market share shifts and which content types generate the strongest AI visibility gains.
Establishing realistic SOV targets requires understanding your market position, competitive intensity, and resource constraints. For market leaders in established categories, maintaining 25-35% SOV represents a realistic target, while challengers typically aim for 15-25% SOV to establish credible positioning, and emerging players should target 8-15% SOV as they build brand recognition. Your target-setting framework should include:
Most companies find that a 2-4 percentage point SOV increase annually represents an aggressive but achievable target with dedicated optimization efforts, while 5+ percentage point increases typically require significant content investments, product improvements, or market shifts. Quarterly reviews of SOV performance against targets enable course correction and ensure your AI visibility strategy remains aligned with broader business objectives.
Traditional Share of Voice measures visibility across search results, paid ads, and social media through impressions and placements. AI SOV specifically tracks how often your brand is mentioned, cited, or recommended in responses generated by large language models like ChatGPT, Perplexity, and Google AI Overviews. The key difference is that AI SOV measures credibility and recommendation frequency rather than just visibility in listings.
For most brands, a monthly or quarterly calculation provides the right balance between tracking meaningful changes and avoiding excessive data collection. Social media conversations may warrant weekly tracking due to rapid changes, while organic search SOV can be tracked quarterly. The most important factor is consistency—pick a frequency you can maintain to build reliable historical data for trend analysis.
There's no universal 'good' percentage because it depends on your market position and competitive intensity. Market leaders typically aim for 25-35% SOV, challengers target 15-25%, and emerging players should focus on 8-15% as they build recognition. Rather than chasing an arbitrary number, focus on steady improvement and outperforming your direct competitors.
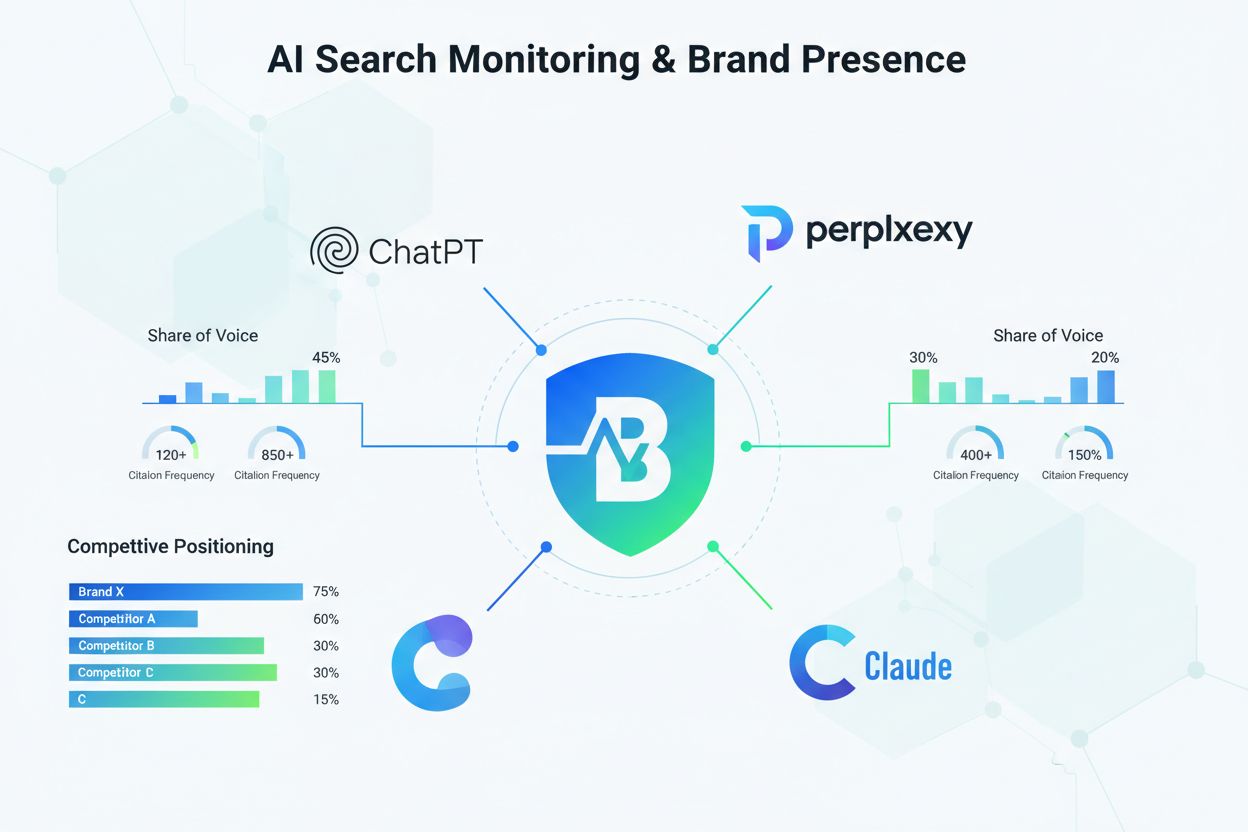
ChatGPT, Perplexity, and Google AI Overviews are the three most important platforms to monitor due to their user bases and influence on customer discovery. ChatGPT has the largest user base, Perplexity emphasizes real-time data and citations, and Google AI Overviews integrates directly into search results. Start with these three, then expand to emerging platforms like Claude, Gemini, and others as your monitoring capabilities grow.
Sentiment significantly impacts the strategic value of your mentions. A brand mentioned frequently but in negative contexts (criticized for being expensive, outdated, or limited) may have high mention volume but low strategic value. Conversely, fewer mentions with consistently positive framing can be more valuable. Track sentiment alongside mention counts to understand whether your SOV represents genuine competitive strength or potential positioning problems.
Meaningful AI SOV improvements typically take 4-8 weeks to appear as AI systems incorporate new content into their training data and responses. Quick wins come from optimizing existing content for AI-friendly formatting and addressing obvious gaps in your coverage. Sustainable improvements require ongoing content creation, citation-building, and strategic positioning that compounds over months and quarters.
Research suggests AI SOV often leads market share—brands that dominate AI recommendations tend to gain market share over time as AI becomes the primary discovery channel. However, the relationship isn't perfectly linear; a brand can have high AI SOV but low market share if it's not converting recommendations into sales, or vice versa if it has strong existing market position but weak AI visibility.
Track your SOV separately for different prompt types (educational, discovery, comparison, use-case specific) to identify strengths and weaknesses. You might dominate 'best tools' discovery prompts while lagging in comparison queries, or excel in general category education while underperforming in specific use-case recommendations. This segmentation reveals where to focus optimization efforts for maximum impact.
AmICited tracks how ChatGPT, Perplexity, and Google AI Overviews mention your brand. Get real-time visibility metrics and competitive insights to dominate AI search.
Learn what Share of AI Voice is, how it's calculated, and why it matters for your brand's visibility in ChatGPT, Perplexity, and Google AI Overviews. Discover s...
Learn how to measure and improve your brand's share of voice in AI search across ChatGPT, Perplexity, Gemini, and other AI platforms. Complete guide with metric...
AI Share of Voice measures brand visibility in AI-generated responses. Learn how to track, calculate, and improve your presence across ChatGPT, Perplexity, and ...