AI Visibility Reporting
Learn what AI visibility reporting is, how it works, and why it's essential for monitoring your brand's presence in ChatGPT, Perplexity, Google AI Overviews, an...
7 min read

Learn how to choose between weekly and monthly AI visibility reports. Discover the right reporting cadence for your brand monitoring strategy and optimize your AI visibility tracking.
AI visibility reporting refers to the systematic monitoring and communication of how artificial intelligence systems perform, appear, and impact your organization’s digital presence. The reporting cadence—the frequency at which you deliver these reports—fundamentally shapes how effectively you can respond to changes, align your team, and make data-driven decisions. Organizations face a critical tension: reporting too frequently can overwhelm stakeholders with noise and consume excessive resources, while reporting too infrequently can leave blind spots that allow problems to compound. The right cadence balances operational responsiveness with strategic clarity, ensuring that decision-makers have the information they need exactly when they need it. Finding this balance requires understanding your organization’s unique needs, constraints, and objectives.
Weekly AI reports excel at capturing the rapid changes inherent in modern AI systems and digital environments. This frequent cadence enables early detection of anomalies, shifts in performance metrics, and emerging issues before they escalate into major problems. Weekly reporting also strengthens team alignment by creating regular touchpoints where cross-functional teams discuss findings, share insights, and coordinate responses. For organizations running agile sprints, managing critical systems, or operating in fast-moving competitive landscapes, weekly cadence provides the operational visibility necessary to maintain control and agility.
Key benefits of weekly reporting include:
| Use Case | Primary Metrics | Ideal Team Size | Industry Examples |
|---|---|---|---|
| Fast-moving startups | SoA, SoC, sentiment shifts | 5-15 people | AI-native companies, tech startups |
| Critical system monitoring | Performance anomalies, error rates, latency | Any size | Healthcare, finance, infrastructure |
| Agile product teams | Feature performance, user impact, bug detection | 10-20 people | SaaS, product development |
| Competitive intelligence | Competitor AI mentions, market share shifts | 5-10 people | Marketing, business development |
| Real-time crisis management | Alert triggers, incident metrics, resolution time | 8-12 people | Crisis response, reputation management |
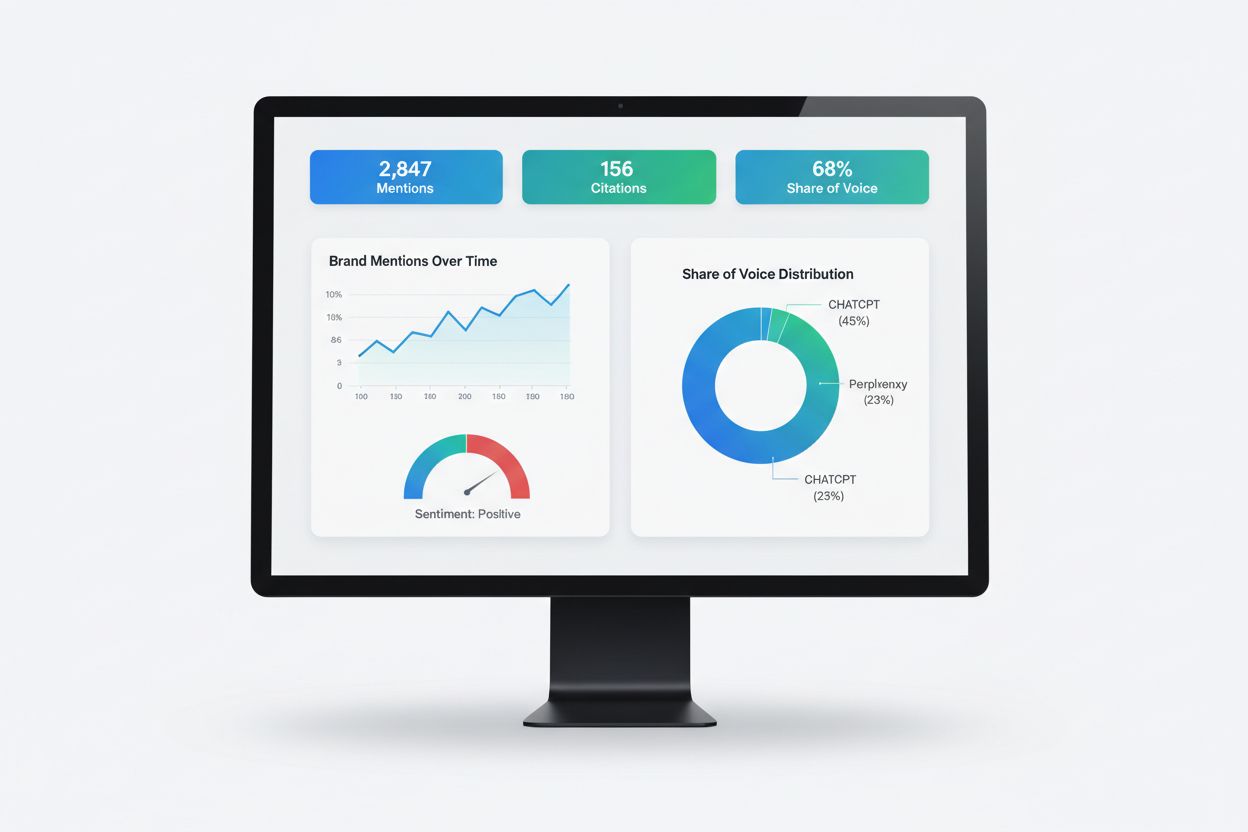
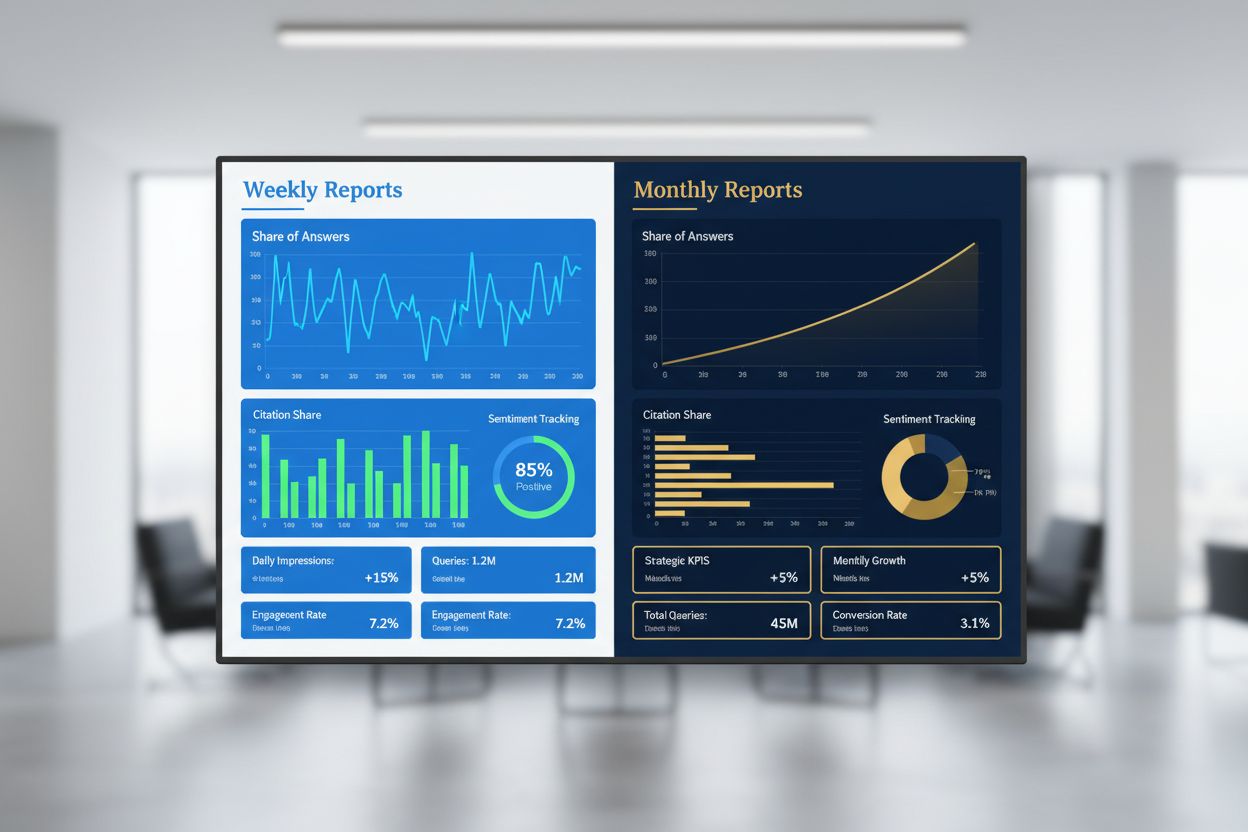
Weekly reports typically focus on operational metrics: Share of Answers (SoA) changes, Citation Share (SoC) fluctuations, sentiment shifts, and any anomalies detected in your AI visibility data. These reports work best when structured as concise dashboards with clear highlights of what changed, why it matters, and what action is needed. The weekly rhythm creates accountability and ensures that insights translate into timely decisions rather than sitting in a report gathering dust.
Monthly AI reports shift focus from operational firefighting to strategic narrative and long-term trend analysis. This cadence allows sufficient time for patterns to emerge clearly, reducing noise from daily fluctuations and providing a more accurate picture of true performance trajectories. Monthly reporting proves particularly valuable for executive dashboards, where leadership needs high-level summaries rather than granular operational details, and for stable projects where significant changes occur infrequently. Organizations with resource constraints, distributed teams across multiple time zones, or mature AI systems benefit significantly from monthly cadence, which reduces reporting overhead while maintaining strategic awareness.
Monthly reports should synthesize findings into strategic insights: What are the major trends in your AI visibility metrics? How do current performance levels compare to historical baselines and industry benchmarks? What resource investments or strategic pivots does the data suggest? These reports typically include prominence analysis, sentiment trends over the month, competitive positioning, and forward-looking recommendations. Monthly cadence also provides natural checkpoints for quarterly business reviews and strategic planning cycles, making it easier to align AI visibility reporting with broader organizational planning rhythms.
The most effective organizations adopt a hybrid reporting model that combines the operational responsiveness of weekly checks with the strategic clarity of monthly executive reports. This approach structures communication across multiple layers: daily standups for immediate issue escalation, weekly operational checks focused on metrics and anomalies, and monthly leadership narratives that synthesize findings into strategic recommendations. The hybrid model prevents both the burnout of constant reporting and the blindness of infrequent updates, creating a sustainable rhythm that serves different stakeholder needs simultaneously.
Implementation of hybrid cadence requires clear role definition: operational teams own weekly dashboards and anomaly detection, while strategic teams synthesize monthly narratives for leadership. A technology company might run daily 15-minute standups where the AI monitoring team flags any critical issues, conduct weekly 30-minute reviews of SoA and SoC trends with product and marketing teams, and deliver monthly executive summaries to the C-suite highlighting strategic implications. This structure ensures that urgent issues receive immediate attention while strategic decisions rest on comprehensive monthly analysis rather than reactive weekly data. The hybrid approach also reduces the risk of alert fatigue, where teams become desensitized to frequent reports and miss genuinely important signals.
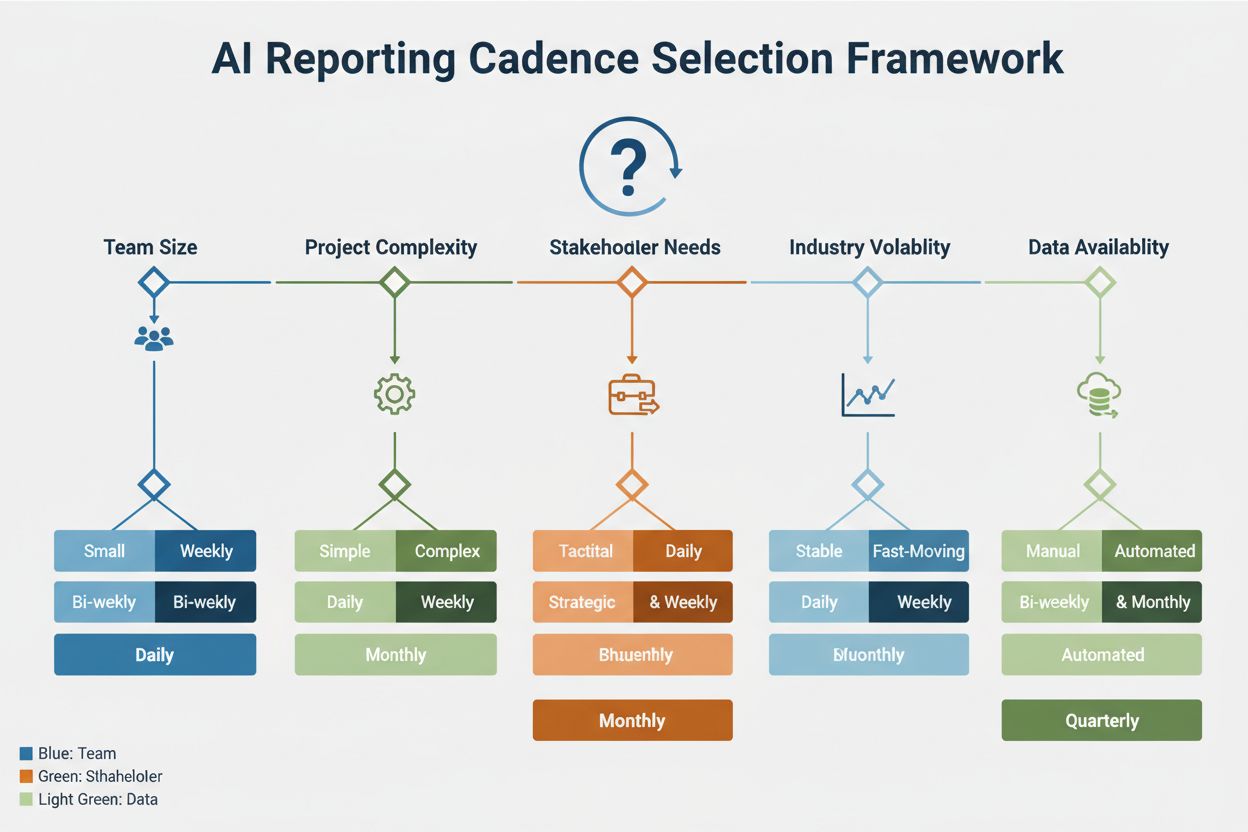
Selecting the optimal reporting cadence requires evaluating five critical dimensions of your organization and environment. Team size significantly influences cadence: research indicates that small teams (5-10 people) typically benefit from weekly reporting, medium teams (11-25 people) function well with bi-weekly cadence, and large organizations (25+ people) often shift to monthly strategic reports with weekly operational dashboards. Project complexity matters because more complex AI systems with numerous interdependencies require more frequent monitoring to catch cascading failures early. Stakeholder needs vary dramatically—executives need monthly strategic summaries while operational teams need weekly or daily visibility. Industry volatility determines how quickly your competitive landscape and AI visibility metrics shift; highly volatile industries demand weekly or even daily monitoring, while stable industries can operate effectively on monthly cycles. Data availability is the final constraint: if your monitoring infrastructure can only reliably produce reports monthly, that becomes your practical ceiling regardless of ideal frequency.
| Decision Factor | Weekly Cadence Indicator | Monthly Cadence Indicator | Hybrid Approach Indicator |
|---|---|---|---|
| Team Size | 5-10 people, co-located | 25+ people, distributed | 11-24 people, mixed structure |
| Project Complexity | High complexity, many dependencies | Low complexity, stable systems | Medium complexity, mixed portfolio |
| Stakeholder Needs | Operational teams need frequent updates | Executive-focused, strategic decisions | Mixed stakeholder groups |
| Industry Volatility | High volatility, competitive pressure | Stable market, predictable changes | Moderate volatility, mixed exposure |
| Data Availability | Real-time data infrastructure | Batch processing, monthly aggregation | Hybrid data systems |
| Resource Capacity | Dedicated reporting team | Limited reporting resources | Moderate reporting capacity |
| Regulatory Requirements | Frequent compliance checks needed | Annual/quarterly compliance cycles | Mixed compliance requirements |
To apply this framework, score your organization on each factor (1-5 scale), then sum the scores: 5-12 points suggests weekly cadence, 13-20 suggests monthly, and 21-30 suggests hybrid. This scoring approach removes guesswork and creates a defensible rationale for your cadence choice. Remember that your cadence isn’t permanent—as your organization grows, your systems mature, or your competitive environment shifts, your optimal cadence will evolve. Plan to reassess quarterly whether your current cadence still serves your needs effectively.
Different metrics reveal different insights depending on your reporting frequency, and the cadence you choose should align with the metrics that matter most to your strategy. Share of Answers (SoA) measures what percentage of AI-generated answers mention your brand or content, while Citation Share (SoC) tracks how often your content is specifically cited as a source. Prominence indicates where your brand appears in AI responses (top, middle, or bottom), and sentiment captures whether mentions are positive, neutral, or negative. Weekly reporting should focus on SoA and SoC changes, sentiment shifts, and any anomalies in prominence—metrics that can shift rapidly and require quick response. Monthly reporting should emphasize trend analysis: Is your SoA growing or declining? How does this month’s SoC compare to the previous three months? What patterns emerge in sentiment across different AI platforms?
| Metric | Weekly Tracking | Monthly Tracking | Why Frequency Matters |
|---|---|---|---|
| Share of Answers (SoA) | Daily/weekly changes, anomalies | Trend analysis, month-over-month growth | Weekly catches sudden drops; monthly shows trajectory |
| Citation Share (SoC) | Competitive shifts, new mentions | Baseline establishment, seasonal patterns | Weekly enables rapid response; monthly reveals patterns |
| Prominence | Position changes, ranking shifts | Average position trends, competitive standing | Weekly detects immediate changes; monthly shows consistency |
| Sentiment | Negative mention spikes, crisis detection | Overall sentiment trajectory, brand perception | Weekly enables crisis response; monthly shows perception trends |
| Platform Distribution | Which AI systems mention you most | Platform preference shifts, coverage gaps | Weekly identifies emerging platforms; monthly shows stability |
| Content Performance | Which content pieces drive mentions | Top-performing content categories | Weekly shows viral moments; monthly shows winners |
The frequency of metric tracking directly affects data quality and actionability. Weekly tracking requires robust automation and clear alert thresholds to avoid overwhelming teams with noise, while monthly tracking allows for more manual verification and context-setting. The most sophisticated organizations track all metrics weekly but present them differently: operational teams see raw weekly data with anomaly flags, while leadership receives monthly summaries that contextualize weekly findings within broader trends. This dual approach maximizes both responsiveness and strategic clarity.
Organizations frequently stumble when implementing reporting cadence, and understanding these pitfalls helps you avoid costly missteps. The most common mistakes include:
Over-reporting without clear purpose – Generating weekly reports that no one reads or acts upon creates reporting fatigue and wastes resources. Solution: Define specific decisions or actions that each report should inform before you create it.
Under-reporting in dynamic environments – Waiting for monthly reports when your competitive landscape shifts weekly leaves you reactive rather than proactive. Solution: Implement daily alerts for critical metrics even if full reports remain monthly.
Static cadence in changing circumstances – Maintaining the same reporting frequency as your organization grows or your systems mature often leads to either information overload or dangerous blind spots. Solution: Reassess cadence quarterly and adjust based on actual stakeholder usage and organizational needs.
Reporting without clear ownership – When no one owns the reporting process, quality suffers and stakeholders receive inconsistent information. Solution: Assign explicit ownership with clear SLAs for report delivery and quality standards.
Ignoring stakeholder preferences – Delivering reports in formats or at times that don’t match how stakeholders actually consume information reduces impact. Solution: Survey stakeholders about their preferred cadence, format, and delivery method before finalizing your approach.
Failing to automate repetitive reporting – Manual report generation consumes time that could be spent on analysis and insight generation. Solution: Invest in automation tools that handle data collection, aggregation, and basic formatting, freeing your team for higher-value analysis.
These mistakes often compound: over-reporting without purpose leads to under-utilization, which then justifies reducing frequency, which creates blind spots that require crisis-driven over-reporting. Breaking this cycle requires intentional design of your reporting cadence around actual stakeholder needs and organizational capacity.
Implementing your ideal reporting cadence becomes dramatically easier with the right tools and automation infrastructure. AmICited.com specializes in AI visibility monitoring across GPTs, Perplexity, Google AI Overviews, and other AI systems, providing the real-time data infrastructure necessary for both weekly operational checks and monthly strategic analysis. The platform automates metric collection, anomaly detection, and alert generation, eliminating manual data gathering that would otherwise consume hours weekly. FlowHunt.io complements this by automating AI content generation and report creation, enabling teams to produce polished monthly narratives without extensive manual writing.
Automation benefits extend beyond time savings: consistent data collection reduces human error, standardized report formats improve stakeholder comprehension, and scheduled delivery ensures reports reach stakeholders reliably. Implementation typically follows this sequence: first, connect your monitoring tools to your data sources; second, configure automated metric collection and aggregation; third, set up alert thresholds for anomalies; fourth, create report templates that populate automatically with current data; fifth, schedule delivery to stakeholders at your chosen cadence. Organizations that automate reporting often discover they can increase frequency without increasing workload—weekly reports that would require 20 hours of manual work become feasible when automation handles 18 of those hours, leaving your team to focus on analysis and insight generation rather than data compilation.
Successfully implementing your chosen reporting cadence requires systematic execution across five key steps:
Assess your current state – Document how you currently monitor AI visibility, what reports exist, who receives them, and how they’re actually used. This baseline reveals gaps and inefficiencies in your current approach.
Define your stakeholders and their needs – Create a stakeholder map identifying who needs what information, at what frequency, and in what format. Conduct interviews or surveys to understand their actual information needs rather than assuming.
Choose your cadence based on the decision framework – Apply the five-factor framework to select weekly, monthly, or hybrid cadence that matches your organizational reality.
Set up automation and tools – Implement monitoring platforms like AmICited.com and automation tools like FlowHunt.io to handle data collection, aggregation, and report generation at your chosen cadence.
Review and adjust quarterly – Schedule quarterly reviews where you assess whether your cadence is actually serving stakeholder needs, whether reports are being used, and whether organizational changes warrant cadence adjustments.
Change management is critical during implementation: communicate clearly why you’re changing your reporting cadence, how it will benefit different stakeholders, and what new processes they should expect. Involve key stakeholders in the design process rather than imposing changes top-down. Start with a pilot phase where you run your new cadence in parallel with the old approach for one month, gathering feedback before full transition. Celebrate early wins—when weekly reports catch an issue that would have been missed under monthly cadence, or when monthly strategic reports inform a major decision—to build organizational buy-in for your new approach. Remember that your reporting cadence should evolve as your organization grows and your competitive environment changes; the goal is sustainable, effective communication that serves decision-making, not reporting for its own sake.
The ideal frequency depends on your team size, project complexity, and industry volatility. Small teams in fast-moving industries typically benefit from weekly monitoring, while larger organizations in stable markets often use monthly cadence. Most organizations find a hybrid approach—weekly operational checks plus monthly strategic reports—works best.
Weekly reports focus on operational metrics and anomaly detection, enabling rapid response to changes in Share of Answers, Citation Share, and sentiment. Monthly reports emphasize trend analysis and strategic narrative, providing context for long-term performance trajectories and informing strategic decisions.
Yes, and this hybrid approach is increasingly common. Many organizations run daily standups for critical issues, weekly operational dashboards for tactical teams, and monthly executive summaries for leadership. This structure prevents both reporting fatigue and dangerous blind spots.
Assess whether stakeholders actually read and act on reports, whether critical issues are caught early enough to respond effectively, and whether your team feels the reporting burden is sustainable. If reports go unread or issues are discovered too late, your cadence likely needs adjustment.
The core metrics are Share of Answers (what percentage of AI responses mention you), Citation Share (how often you're cited as a source), prominence (where you appear in responses), and sentiment (whether mentions are positive or negative). Track these at whatever cadence you choose.
Small teams (5-10 people) typically benefit from weekly reporting for alignment and agility. Medium teams (11-25 people) often use bi-weekly cadence. Large organizations (25+ people) frequently shift to monthly strategic reports with weekly operational dashboards for sub-teams.
AmICited.com automates AI visibility monitoring across GPTs, Perplexity, and Google AI Overviews, handling metric collection and anomaly detection. FlowHunt.io complements this by automating report generation and content creation, enabling teams to maintain frequent reporting without excessive manual work.
Conduct quarterly reviews to assess whether your current cadence still serves stakeholder needs, whether organizational changes warrant adjustments, and whether your team's capacity has shifted. Be prepared to adjust as your organization grows or your competitive environment changes.
Track how your brand appears in AI-generated answers across GPTs, Perplexity, and Google AI Overviews with customizable reporting cadence that fits your team's needs.
Learn what AI visibility reporting is, how it works, and why it's essential for monitoring your brand's presence in ChatGPT, Perplexity, Google AI Overviews, an...

Learn how to implement effective AI content governance policies with visibility frameworks. Discover regulatory requirements, best practices, and tools for mana...

Learn what metrics and data should be included in an AI visibility report to track brand presence across ChatGPT, Perplexity, Google AI Overviews, and Claude. C...