AI Visibility Benchmark
Learn what AI visibility benchmarks are, how to measure them, and what realistic targets look like for your industry. Discover key metrics, tools, and ROI frame...
9 min read

Learn how to benchmark AI visibility against competitors across ChatGPT, Perplexity, and other AI platforms. Discover metrics, tools, and strategies to monitor your brand’s AI search presence.
Benchmark AI visibility by tracking key metrics like citation frequency, response positioning, and share of voice across AI platforms like ChatGPT, Perplexity, Claude, and Google AI. Use specialized monitoring tools, analyze competitor content strategies, and optimize your pages for AI comprehension to improve your brand's presence in AI-generated responses.
AI visibility benchmarking is the systematic process of measuring, comparing, and improving your brand’s presence in AI-generated responses relative to competitors. Unlike traditional SEO that focuses on search engine rankings, this discipline tracks how often and how prominently AI systems like ChatGPT, Claude, Perplexity, and Google’s AI Overviews reference your brand when answering user queries. The fundamental shift from link-based results to synthesized AI responses has changed how brands are discovered online, making this new metric essential for competitive success.
The importance of AI visibility benchmarking cannot be overstated in today’s digital landscape. Research shows that over 73% of AI search queries result in zero clicks to source websites, meaning users get their answers directly from AI without visiting your site. If your brand isn’t mentioned in the AI’s response, you’re essentially invisible to these users, regardless of your traditional search rankings. This represents a significant opportunity gap that many businesses haven’t yet addressed, creating a competitive advantage for those who act quickly.
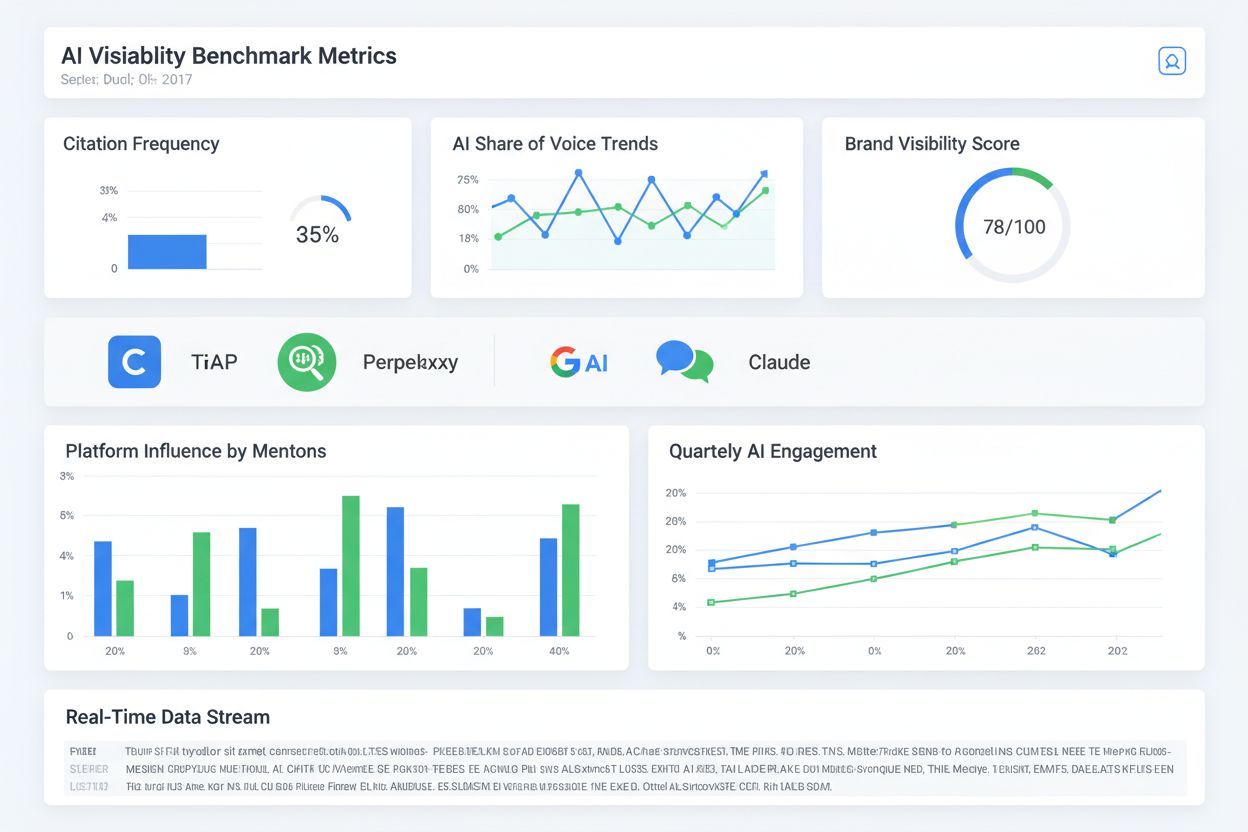
Effective AI benchmarking requires tracking specific, actionable metrics that directly correlate with business outcomes and competitive positioning. These metrics provide quantifiable data about your brand’s presence and performance across different AI platforms, allowing you to make informed strategic decisions.
| Metric | Definition | Target Benchmark | Calculation Method |
|---|---|---|---|
| Citation Frequency Rate (CFR) | Percentage of relevant queries where your brand appears in AI responses | 15-30% for established brands | (Brand mentions ÷ Total relevant queries tested) × 100 |
| Response Position Index (RPI) | Where your brand appears within the AI’s response structure | 7.0 or higher | First mention: 10 pts, Top 3: 7 pts, Middle: 4 pts, Bottom: 1 pt |
| Competitive Share of Voice (CSOV) | Your mentions compared to all competitor mentions | 25%+ in your category | Your mentions ÷ (Your mentions + All competitor mentions) × 100 |
| Sentiment Score | Positive vs negative context around your brand | >80% positive mentions | Manual review or AI sentiment analysis |
| Source Diversity Index | Number of AI platforms citing your content | 4+ platforms minimum | Count unique platforms mentioning your brand |
The Citation Frequency Rate measures how often your brand appears in AI responses for relevant queries. Established brands typically achieve 15-30% citation frequency, while emerging players should target 5-10% initially. This metric is crucial because it directly indicates your brand’s visibility in the AI-generated answer space. The Response Position Index goes beyond simple mentions to evaluate where your brand appears within responses—first mentions score highest because they receive more attention from users reading AI answers.
Competitive Share of Voice represents your visibility compared to competitors in the same space. Market leaders typically maintain 35-45% share of voice, strong competitors hold 20-30%, and emerging brands operate at 5-15%. This metric helps you understand your competitive standing and identify gaps where competitors are dominating. Track these metrics weekly during aggressive growth phases and monthly for maintenance mode, as sudden drops often indicate competitor campaigns or content issues requiring immediate attention.
Understanding which brands compete for AI visibility requires a different approach than traditional competitor analysis. Your AI competitors fall into three distinct categories that each require different monitoring strategies. First, identify brands that AI mentions alongside your brand in responses—these are direct competitors for the same audience attention. Second, find brands that AI cites as sources instead of you, indicating content authority gaps. Third, discover brands your audience compares to yours in AI queries, revealing perception and positioning gaps.
Tools like Ahrefs’ Brand Radar can help identify these competitors automatically, but manual analysis of search queries with comparative intent like “Brand X vs Brand Y” provides valuable insights into who your audience actually compares you against. Define each brand’s entities clearly for deeper analysis, including main brand names, sub-brands, products, and relevant websites. For example, a car manufacturer might track Honda, Honda CR-V, Accord, Civic, and honda.com separately. For high-level benchmarking, focus on just the main brand and domain to ensure accurate comparisons and actionable insights.
Establishing a robust monitoring system requires both tool selection and process definition. The AI visibility tools ecosystem has evolved rapidly, with specialized platforms emerging alongside enhanced traditional SEO tools. Enterprise solutions like Semrush Enterprise AIO, RankScale, and Profound offer real-time monitoring across 10+ AI platforms with custom API integrations and white-label reporting. Professional tools in the $99-$499 monthly range cover major AI platforms with competitive benchmarking for 5-10 competitors and weekly automated reports. Starter solutions under $99 provide limited query monitoring but require more manual checking.
When selecting tools, prioritize multi-platform tracking across ChatGPT, Perplexity, Claude, Gemini, and Google AI Overviews. Ensure the platform offers competitor comparison features, historical trending to track changes over time, and sentiment analysis to understand how AI frames your brand. API access becomes important as you scale, and custom dashboards help communicate insights to stakeholders. Don’t rely solely on manual checking—AI responses vary by location, time, and user history, so automated tools provide statistical significance through volume testing that manual methods cannot achieve.
Effective competitor analysis requires systematic evaluation across multiple dimensions to understand what drives AI visibility. Create a visibility heatmap showing your citation frequency versus competitors across different query types—product information, how-to guides, comparisons, and reviews. This reveals specific topic areas where you’re losing ground and opportunities for quick wins. Analyze which sources AI systems cite for competitors to understand content authority patterns and identify the types of content getting referenced most frequently.
Implement a gap opportunity identification process to find topics with low overall visibility where no competitor dominates, high-value queries with weak competitor presence, and emerging topics not yet dominated by any brand. Use a decision tree to prioritize opportunities: queries with volume over 1,000 monthly searches that have less than 30% competition are Priority 1 quick wins. Transactional queries with high competition become Priority 2 for long-term value. Highly specific queries become Priority 2 for niche dominance, while low-volume queries become Priority 4 for monitoring only.
AI content optimization requires a fundamental shift from keyword stuffing to semantic richness and authoritative comprehensiveness. Structure your content using an AI-first framework that opens with an authority statement in the first 100 words, providing a direct answer to the query with a unique perspective or data point. Build semantic depth layers that include related concepts, supporting evidence from studies and statistics, practical applications with 4-6 examples, common misconceptions, and expert perspectives from 2-3 authoritative sources.
Implement proper information architecture using descriptive H2/H3 headers that answer questions directly, numbered lists for processes, comparison tables for alternatives, and FAQ sections with schema markup. Pre-publication requirements include primary keyword density of 2-3%, secondary keywords at 0.5-1.5%, average sentence length under 20 words, paragraphs under 4 sentences, subheadings every 200-300 words, 3+ internal links, 2+ authoritative external citations, and 1+ original data point. Post-publication monitoring should check initial AI platform pickup in week 1, monitor citation frequency in week 2, analyze competitor responses in week 4, and update based on performance data in week 8.
Different AI platforms have distinct preferences that require tailored optimization approaches. ChatGPT prefers structured data with clear headers and markdown formatting, avoiding promotional language. Perplexity favors recent information with proper citations and penalizes outdated content, so update timestamps regularly. Claude appreciates nuanced explanations with multiple perspectives rather than absolutist claims. Google AI targets featured snippet formats and comprehensive coverage, making topic clusters essential. Gemini requires comprehensive coverage and multiple viewpoints rather than single perspectives.
Optimize for each platform by understanding their unique algorithms and user bases. ChatGPT users often seek detailed explanations, so comprehensive guides perform well. Perplexity emphasizes freshness and citations, making regularly updated content critical. Claude users appreciate balanced perspectives, so including multiple viewpoints increases citation likelihood. Google AI Overviews favor content that answers specific questions directly, making FAQ sections and structured data essential. Gemini integration with Google’s ecosystem means traditional SEO factors still matter significantly.
Implement a weekly tracking protocol to maintain consistent monitoring of your AI visibility metrics. On Mondays, pull visibility reports from all AI monitoring tools, export competitor metrics, generate week-over-week comparisons, and flag significant changes exceeding 5% movement. On Wednesdays, test 10 high-priority queries manually to verify automated data accuracy, document any platform updates or anomalies, and check for new competitor content. On Fridays, create a weekly AI visibility report including executive summary, visibility trends with line graphs, competitive position tables, top movers analysis, and prioritized action items.
Conduct monthly deep-dive analysis covering 30-day visibility trajectories, correlation with content releases, seasonal pattern identification, and platform-specific variations. Calculate ROI using the formula: ROI = [(Attributed Revenue - Investment) ÷ Investment] × 100, where attributed revenue equals leads from AI multiplied by conversion rate and average customer value. Configure your KPI dashboard with primary metrics checked daily (overall visibility percentage, top 3 competitor positions, alert triggers for drops exceeding 10%), secondary metrics checked weekly (platform-specific performance, query category breakdowns, sentiment scores), and strategic metrics checked monthly (market share evolution, ROI trends, content efficiency scores).
When your AI visibility drops suddenly by 20% or more within 48 hours, follow a diagnostic process to identify the root cause. Check for platform algorithm updates by monitoring AI platform announcements and industry news. Verify website accessibility by checking for crawl errors and ensuring proper indexing. Review recent content changes that might have affected quality or relevance. Analyze competitor activity spikes that might indicate aggressive campaigns. Test for regional variations since AI responses vary by location. If the issue stems from algorithm updates, document changes and wait 72 hours before making adjustments. Technical issues require immediate fixing and recrawl requests. Competitor surges demand competitive analysis and counter-strategy development. Content quality issues require reverting changes and establishing review processes.
Inconsistent platform performance where you rank high on ChatGPT but low on Perplexity often stems from content format mismatches, update frequency differences, or varying authority signal weights. Create platform-specific content variations to match each platform’s preferences. Implement regular content updates with minimum weekly frequency since some platforms prioritize freshness. Strengthen author bios and credentials to improve E-E-A-T signals that different platforms weight differently. Low citation quality where your brand is mentioned but not recommended requires boosting content authority by adding original research, including expert quotes, strengthening evidence bases, and updating outdated information. Address negative reviews publicly, create positive case studies, develop thought leadership content, and engage in community discussions to improve sentiment.
Selecting appropriate AI monitoring solutions determines your competitive intelligence capabilities and ROI potential. Evaluate tools using a comprehensive framework considering platform coverage (25% weight), data accuracy (20% weight), competitor tracking capability (15% weight), reporting features (15% weight), price-to-value ratio (10% weight), API and integration availability (10% weight), and support quality (5% weight). Minimum acceptable standards include coverage of at least 5 AI platforms, error rates below 10%, ability to track 5+ competitors, weekly automated reporting, cost under $0.50 per tracked query, and 3+ available integrations.
Enterprise solutions ranging from $1,500-$3,000 monthly offer comprehensive coverage across multiple brands with white-label capabilities, ideal for agencies and large organizations. Mid-market tools at $500-$1,000 monthly provide good feature-to-price balance for growing businesses. Startup trackers at $99-$299 monthly offer easy setup and affordability for small teams starting their AI visibility journey. Professional tools at $200-$500 monthly represent the sweet spot for most businesses seeking serious AI visibility optimization. Start with monthly subscriptions to validate tool fit, then switch to annual plans offering 20-30% discounts once proven effective.
A 90-day implementation plan provides structure for achieving measurable AI visibility improvements. Weeks 1-2 focus on foundation building: platform setup and configuration, team training, baseline metrics establishment, and competitor landscape mapping. Weeks 3-4 involve strategy development: gap analysis workshops, content audits, optimization roadmap creation, and quick win identification. Weeks 5-8 execute the implementation sprint: daily monitoring activation, content optimization, weekly strategy adjustments, and competitor response tracking. Weeks 9-12 scale and optimize: process refinement, team workflow optimization, advanced feature utilization, and ROI measurement.
Proven customer outcomes show B2B SaaS companies achieving 47% increases in qualified leads from AI platforms within 90 days, e-commerce businesses reducing customer acquisition costs by 31%, professional services firms improving brand authority scores by 3.2x, and healthcare providers increasing patient inquiries by 52%. Most businesses achieve positive ROI within 4-6 months, with breakeven typically occurring at month 4-6. Average ROI reaches 3-5x within the first year for companies implementing systematic benchmarking and optimization strategies. Companies tracking AI visibility report 40-60% increases in qualified traffic from AI-driven sources within 6 months.
Start tracking how your brand appears in AI answers and compare your visibility against competitors. Get real-time insights into your AI search performance and identify opportunities to dominate your industry.
Learn what AI visibility benchmarks are, how to measure them, and what realistic targets look like for your industry. Discover key metrics, tools, and ROI frame...

Learn what an AI visibility score is, how it measures your brand's presence in AI-generated answers across ChatGPT, Perplexity, and other AI platforms, and why ...

Explore real case studies of brands achieving AI visibility success. Learn how Netflix, Sephora, and Spotify dominate AI search while others like Chegg collapse...