


Assortment Analysis for Product Revenue Concentration
The Assortment report ranks every product by revenue, largest first, and tracks each one’s running share of the total — so you can see exactly how much of the range a handful of SKUs actually carry, and where the long tail starts.
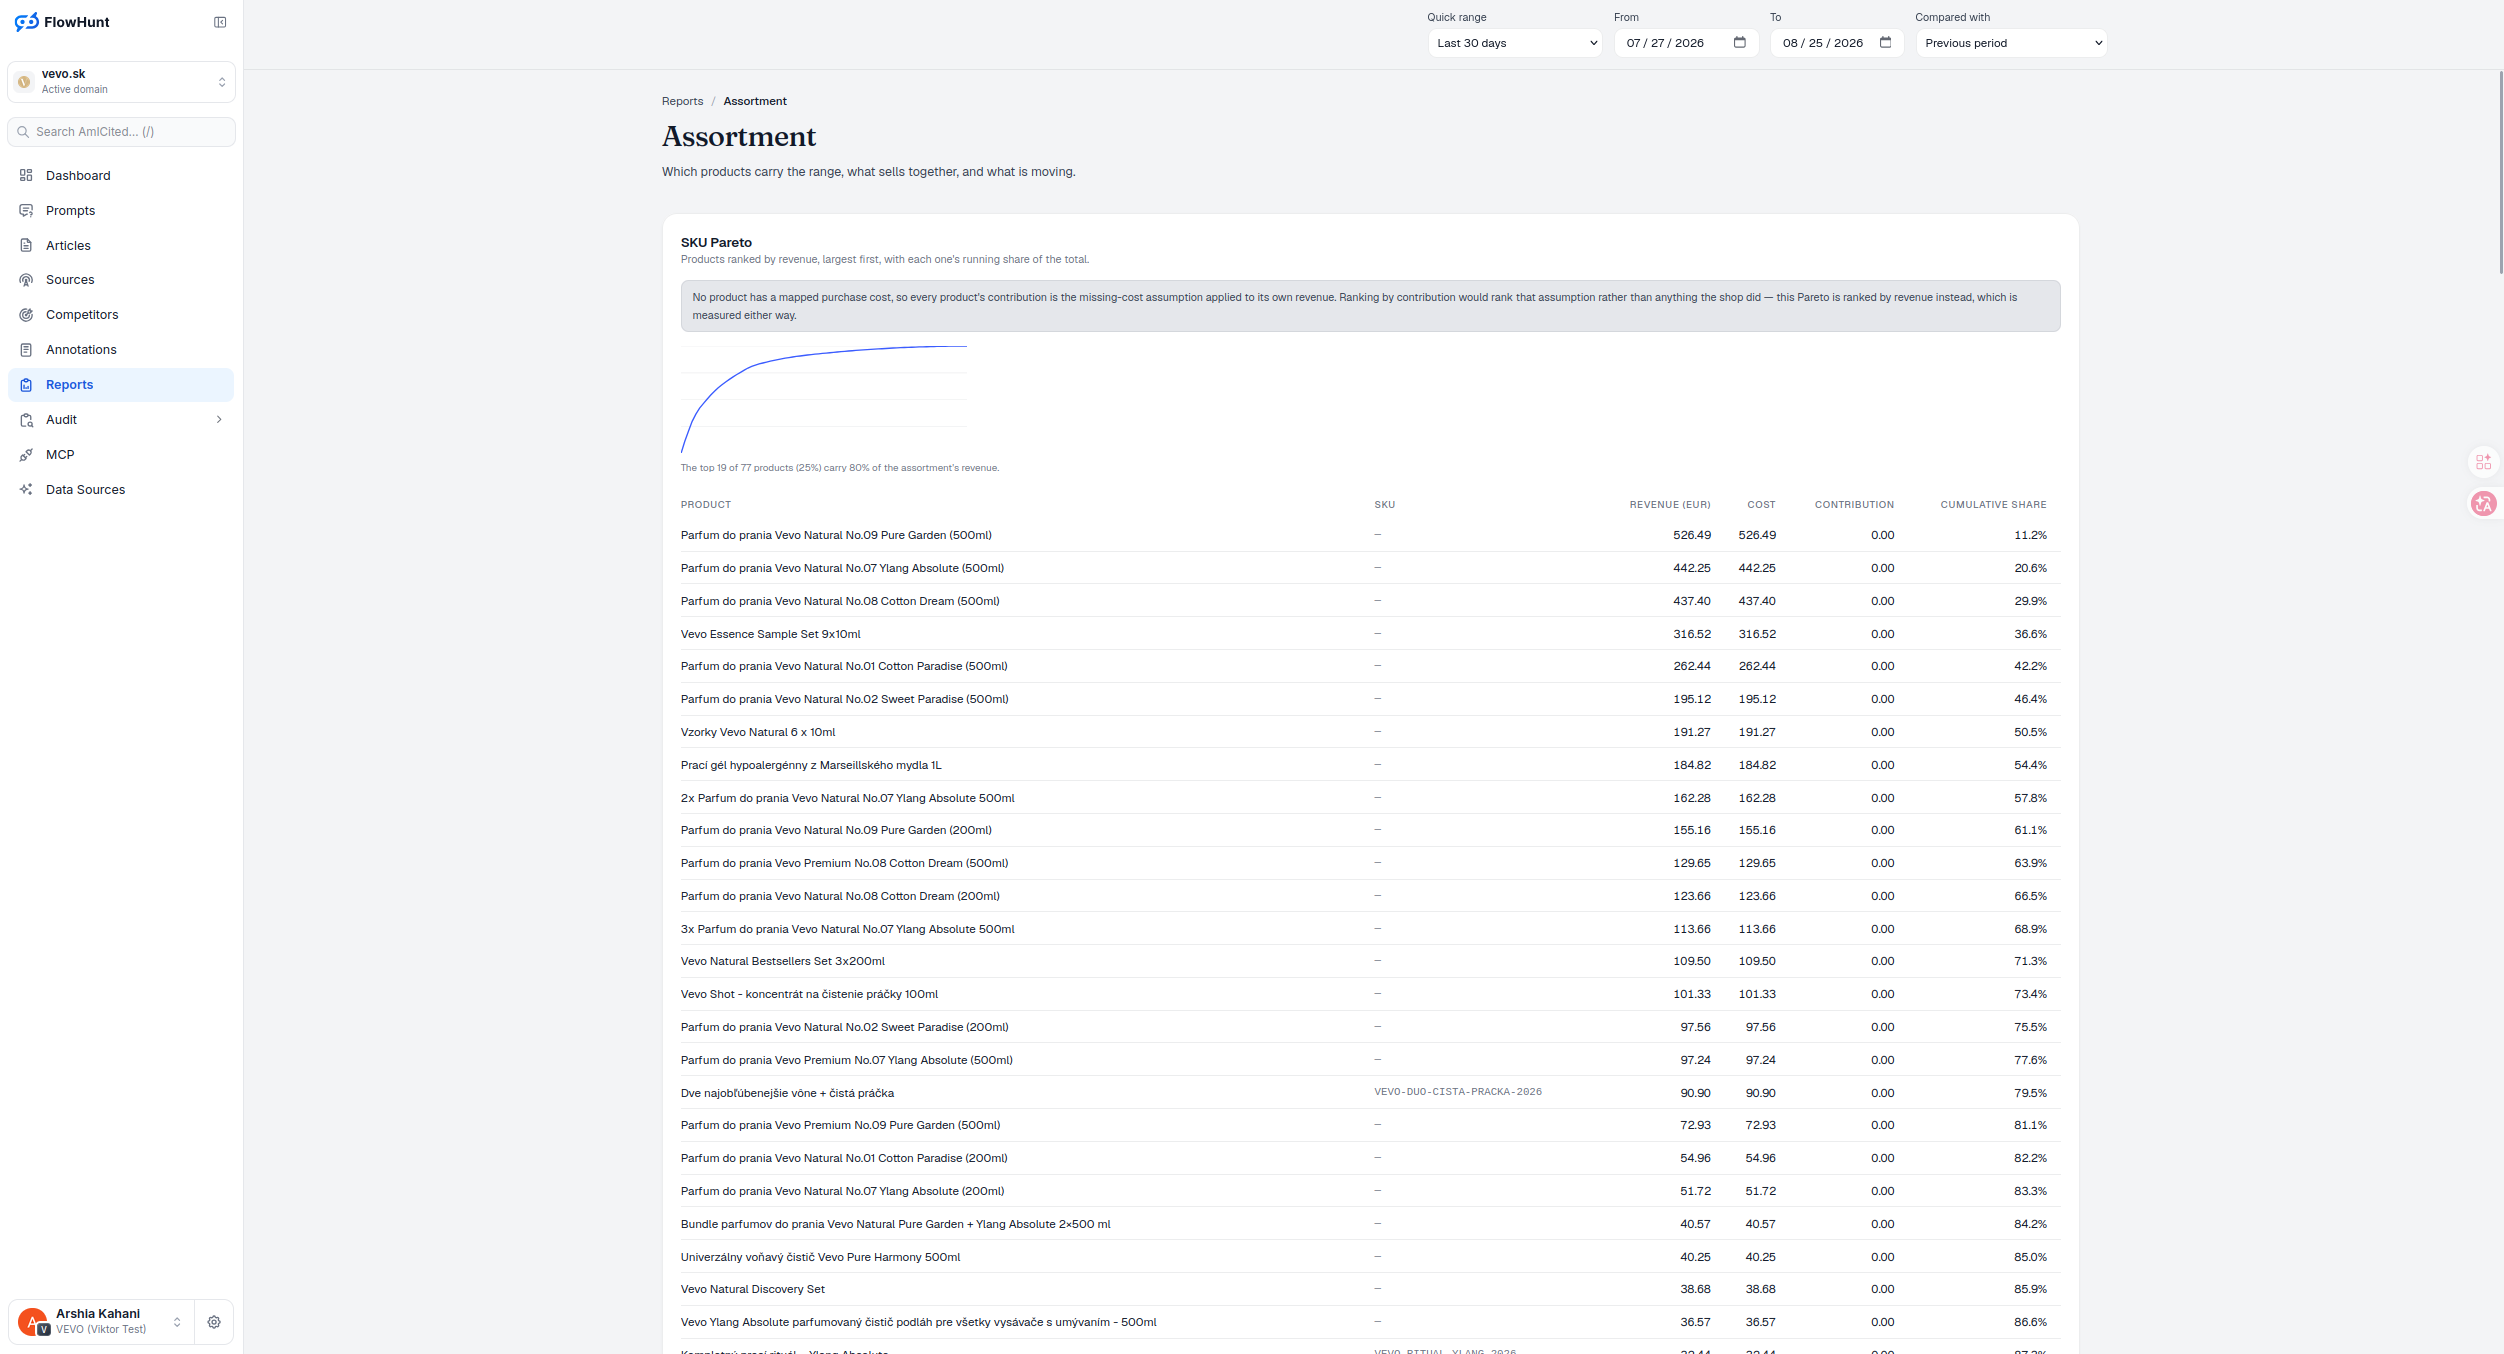
Product Revenue Concentration Curve
This SKU Pareto analysis ranks products by revenue, largest first, with each one’s running share plotted as a cumulative line — steep while the top sellers accumulate, flat once the long tail adds almost nothing.
- Ranked by revenue, not product contribution margin — no product here has a mapped purchase cost, so contribution is just the missing-cost assumption applied to each product’s own revenue; ranking by it would rank the assumption, not the shop.
- Cumulative share line — a rising-then-flattening Pareto curve shows how concentrated the assortment is at a glance.
- 80% concentration read — the top 19 of 77 products, 25% of the assortment, carry 80% of its revenue in the current window.
- Six-column table — product, SKU, revenue, cost, contribution and cumulative share, all in ranked order.
- Cost shown alongside contribution — even though it isn’t measured, it’s kept visible next to the assumption it drives so the gap is never hidden.
Purchase Cost Coverage in Rankings
No product in the catalogue has a mapped purchase cost, so contribution is the missing-cost assumption applied to that product’s own revenue — not a measured outcome. Sorting the Pareto by contribution would just reorder the assortment by that fixed percentage, which tells you nothing the shop actually did. Revenue is measured directly, so the Pareto is built on it instead.
- Cost is a placeholder, not a fact — kept visible in the table so the assumption behind contribution is never hidden.
- Revenue is measured either way — the same number whether or not a purchase cost is ever mapped.
- Cumulative share still tells the real story — concentration in the range shows up in the curve regardless of what margin assumption is applied.
Product Revenue Share Table
Each row is a product ranked by revenue, largest first: PRODUCT and SKU identify it, REVENUE (EUR) and COST sit side by side, CONTRIBUTION carries the same missing-cost caveat as everywhere else in the catalogue, and CUMULATIVE SHARE is the running total that draws the Pareto curve above it.
- PRODUCT, SKU — identifies the row, same identifiers used across the Products report.
- REVENUE (EUR), COST — revenue measured directly; cost carries the unmapped-purchase-cost caveat.
- CONTRIBUTION — the assumption percentage applied to revenue, not a measured margin.
- CUMULATIVE SHARE — each row’s running percentage of total revenue, the number that draws the curve.
Product Affinity and Sales Trends
Two more blocks sit below the Pareto. Bought together counts same-order product pairs, anchors each pair on whichever product has more total orders, and states attach rate as pair orders over that anchor’s orders — sorted by pair-order count, capped at 50, with no minimum count or confidence floor, so a single-order pairing can surface in a sparse catalogue. Product trend splits the window into two halves, compares each product’s revenue total across them, and buckets every product as New, Rising, Flat or Falling by percentage change.
- Bought together — the anchor is the higher-order product in the pair; attach rate is pair orders divided by the anchor’s own orders, not a share of all orders.
- No confidence floor — a pairing with a single shared order can appear here; validate low counts before building a bundle or recommendation on them.
- Product trend, four buckets — New (zero revenue in the first half, positive in the second), Rising (+10% or more), Falling (-10% or more), Flat in between.
- Sorted by money, not percentage — the trend table ranks by absolute change, so a big mover on a small base doesn’t outrank a small percentage move on a large one; direction describes revenue, not profit.
products — 25% of the assortment — carry 80% of its revenue
Ranked by revenue because it’s measured either way; contribution would only rank the missing-cost assumption applied to it.
See Entry ProductsIdentify Products Driving Assortment Revenue
Every SKU ranked by revenue with its running cumulative share, so the 80/20 split in your assortment stops being a guess.
Ready to see how concentrated your range really is?
Free check · 7-day trial · card required