


Bing Search Performance Overview
Overview pulls clicks, impressions, click-through rate and average position straight from Bing Webmaster Tools SEO data, charted together over the range you pick — Google Search’s own reporting pattern, applied to a second engine.
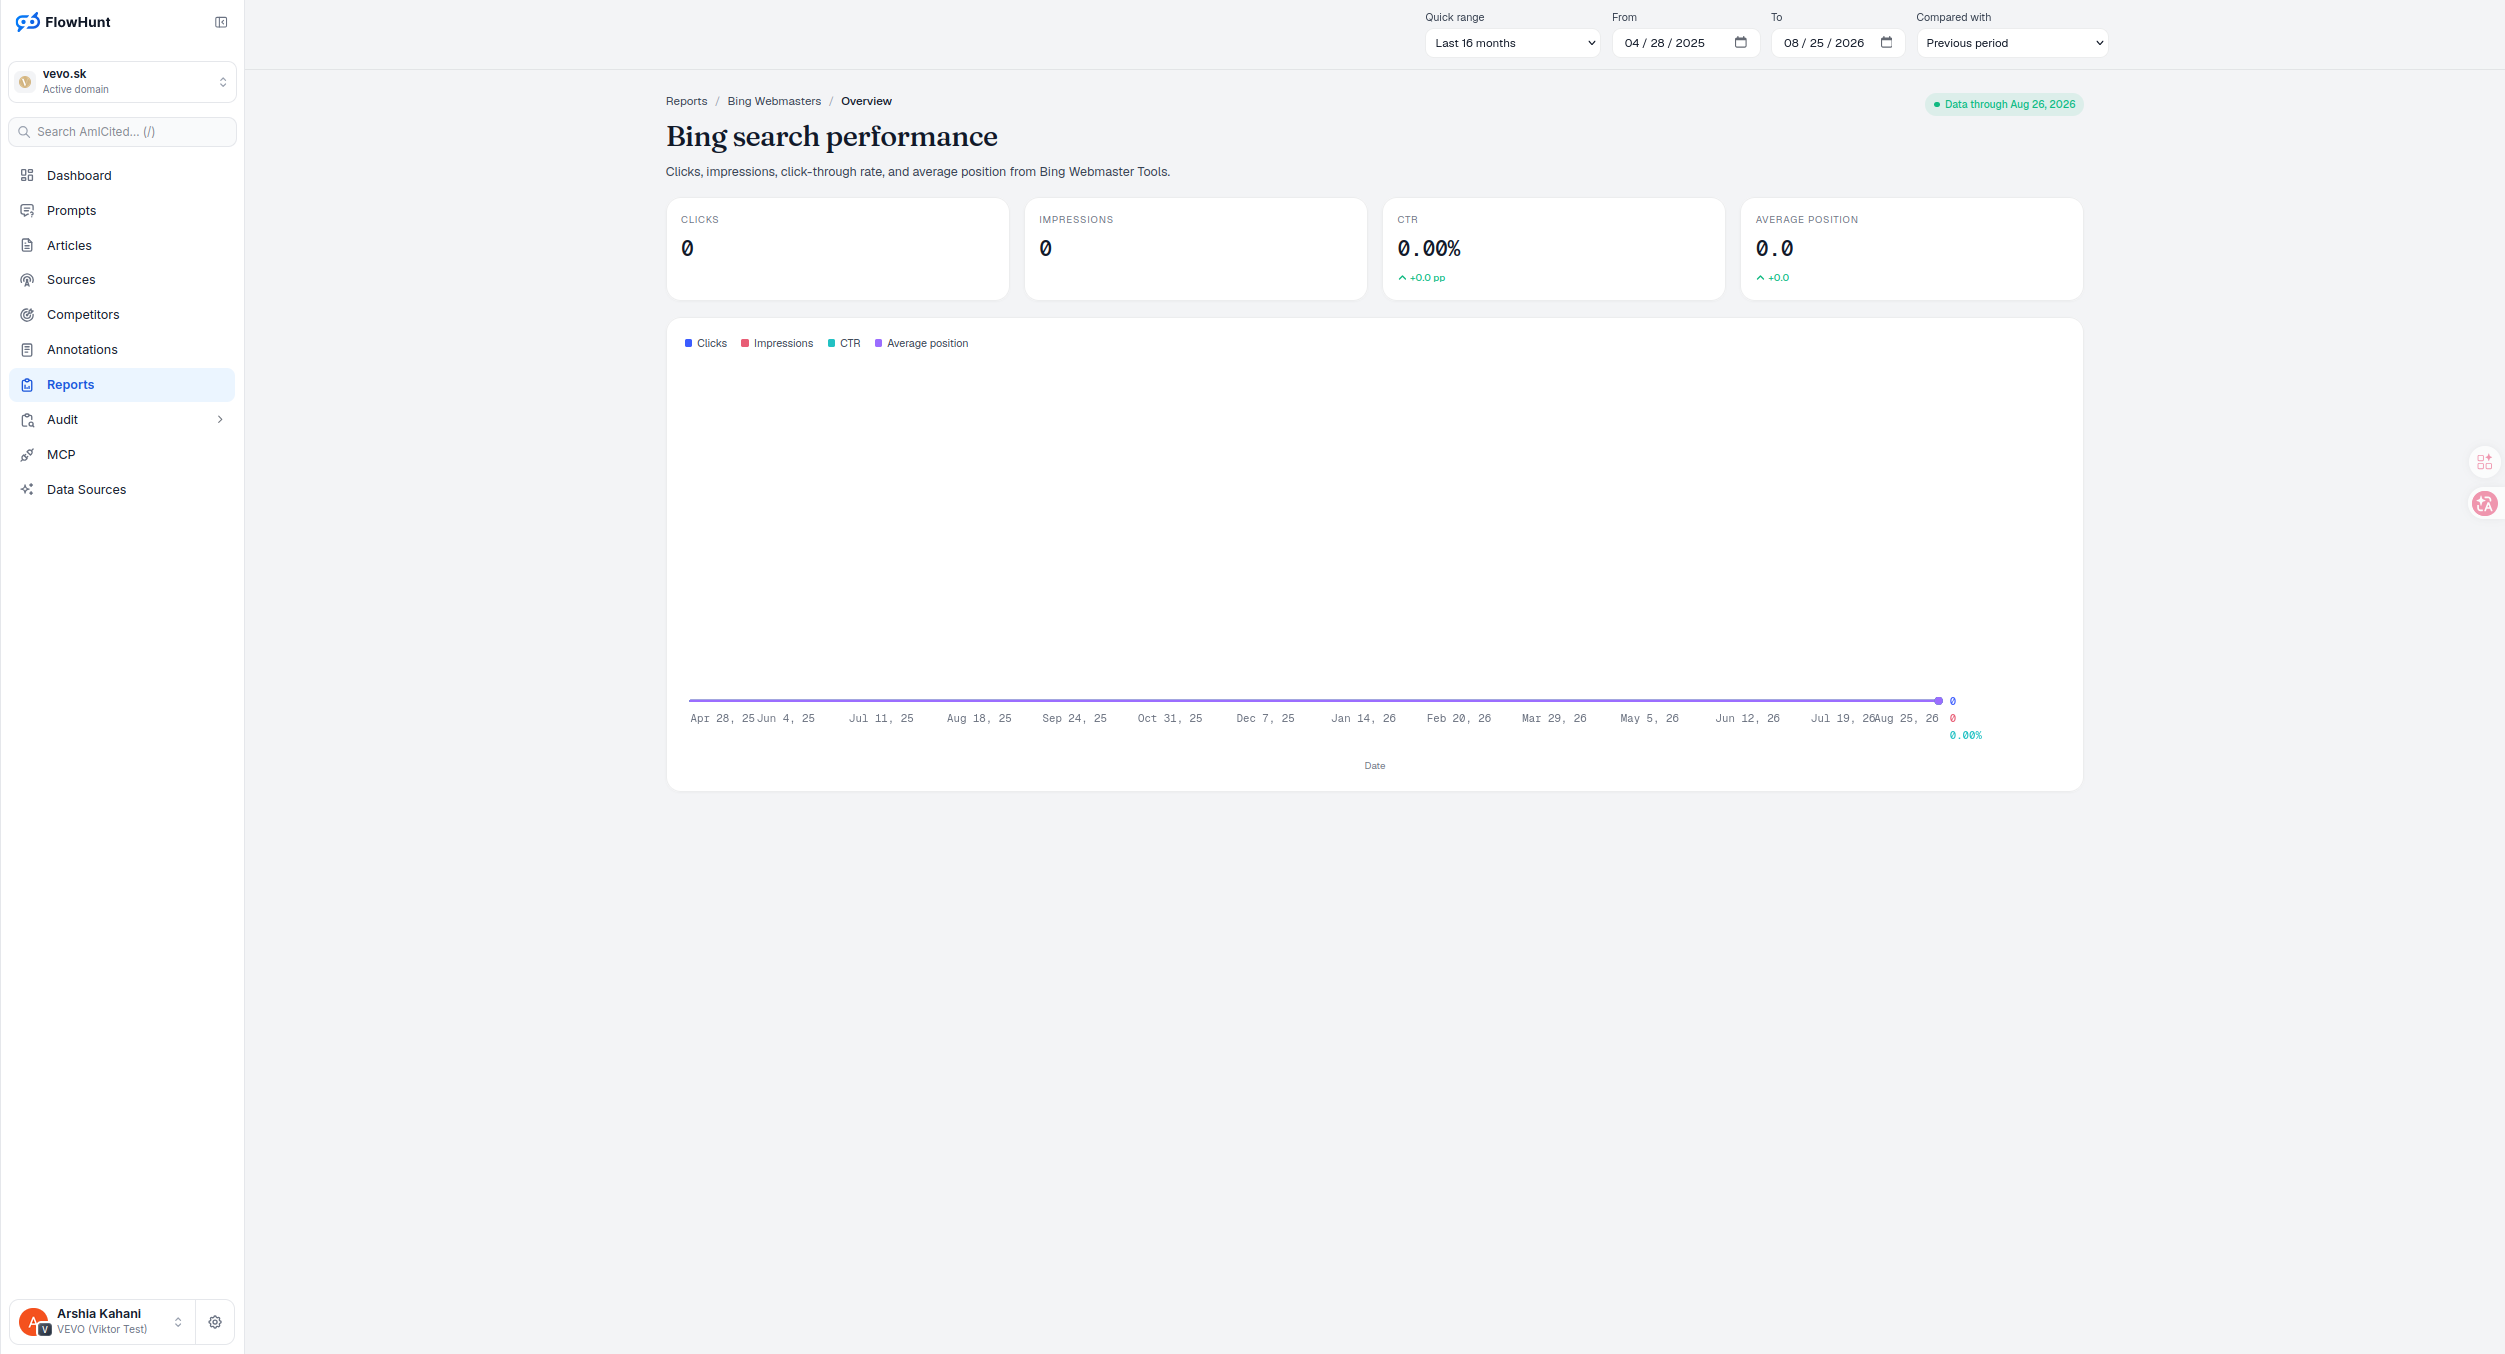
Bing Webmaster Tools Metrics
The four stat tiles and the multi-line chart underneath them are the same shape as Google Search’s own Overview — clicks, impressions, CTR and average position, each with a period-over-period delta — just drawn from Bing Webmaster Tools instead of Google Search Console. Bing traffic is real traffic, and until it’s measured it’s invisible. There’s no table, filter, pagination or export on this page by design; drilling into any one metric means moving to Queries, Pages, Directories or Crawl.
- Four stat tiles — Clicks, Impressions, CTR and Average position, each with a period-over-period delta.
- Multi-line trend chart — Clicks, Impressions, CTR and Average position plotted together over the selected date range, each independently normalized so unrelated units share one plot.
- Sourced from Bing Webmaster Tools — the same four metrics Google Search reports, pulled from a different connection entirely.
- The entry point to five more Bing reports — Queries, Pages, Directories, Crawl and URL submission all sit one click below this Overview.
- A second engine, tracked the same way — no separate mental model to learn; if you already read Google Search’s Overview, this one reads the same.
Bing Search Trend Chart
The chart legend reads Clicks, Impressions, CTR and Average position — the exact four series Google Search’s own chart plots — so switching between the two Overview reports never means relearning what a line means. What changes is the source: this one is Bing Webmaster Tools, end to end. Average position is inverted so a better, lower rank rises toward the top of its own line, and each line ends with its real current value — hover any date for the true unscaled numbers.
- Clicks — visits Bing sent to this domain in the selected range.
- Impressions — how often this domain appeared in Bing search results.
- CTR — clicks divided by impressions, the same definition Google Search uses.
- Average position — the average rank of this domain’s results in Bing search; a falling number is the improvement.
- Toggle any line off — the legend hides or shows a series on click, but always keeps at least one visible.
Bing Performance Change Metrics
Rising impressions without rising clicks usually means a weakening CTR — a title, description or query-relevance problem worth checking before assuming visibility itself dropped. Each delta badge speaks a different unit, so read it by its label rather than treating every badge as a plain percent: counts move in percent, CTR moves in percentage points, and position moves in raw places with the coloring flipped, since a lower number is the win.
- Clicks and impressions — percent change against the earlier period; if the earlier period had zero, the delta shows as null rather than a meaningless infinite percentage.
- CTR — shown in percentage points, not percent.
- Average position — raw places moved, with inverted coloring since a lower position number is the improvement.
- The comparison line itself isn’t drawn — the earlier period feeds the KPI badges only; the chart plots the current window.
- No table here — sorting, filtering, pagination, export and any live Bing action live in Queries, Pages, Directories and Crawl, not on this Overview.
metrics, one chart, a second search engine
Clicks, Impressions, CTR and Average position from Bing Webmaster Tools, charted the same way Google Search’s own Overview charts them.
See Bing QueriesBing Search Performance Analysis
Clicks, impressions, CTR and average position from Bing Webmaster Tools — the same reporting shape as Google Search, sourced from a second engine.
Ready to see how you actually rank on Bing?
Free check · 7-day trial · card required