


Calendar Sales Patterns by Day and Hour
Calendar Patterns breaks order volume down by day and hour, day of week, hour of day, day of month, week of month and payday proximity — normalizing each one for a calendar quirk, so the pattern shown is the business, not the calendar.
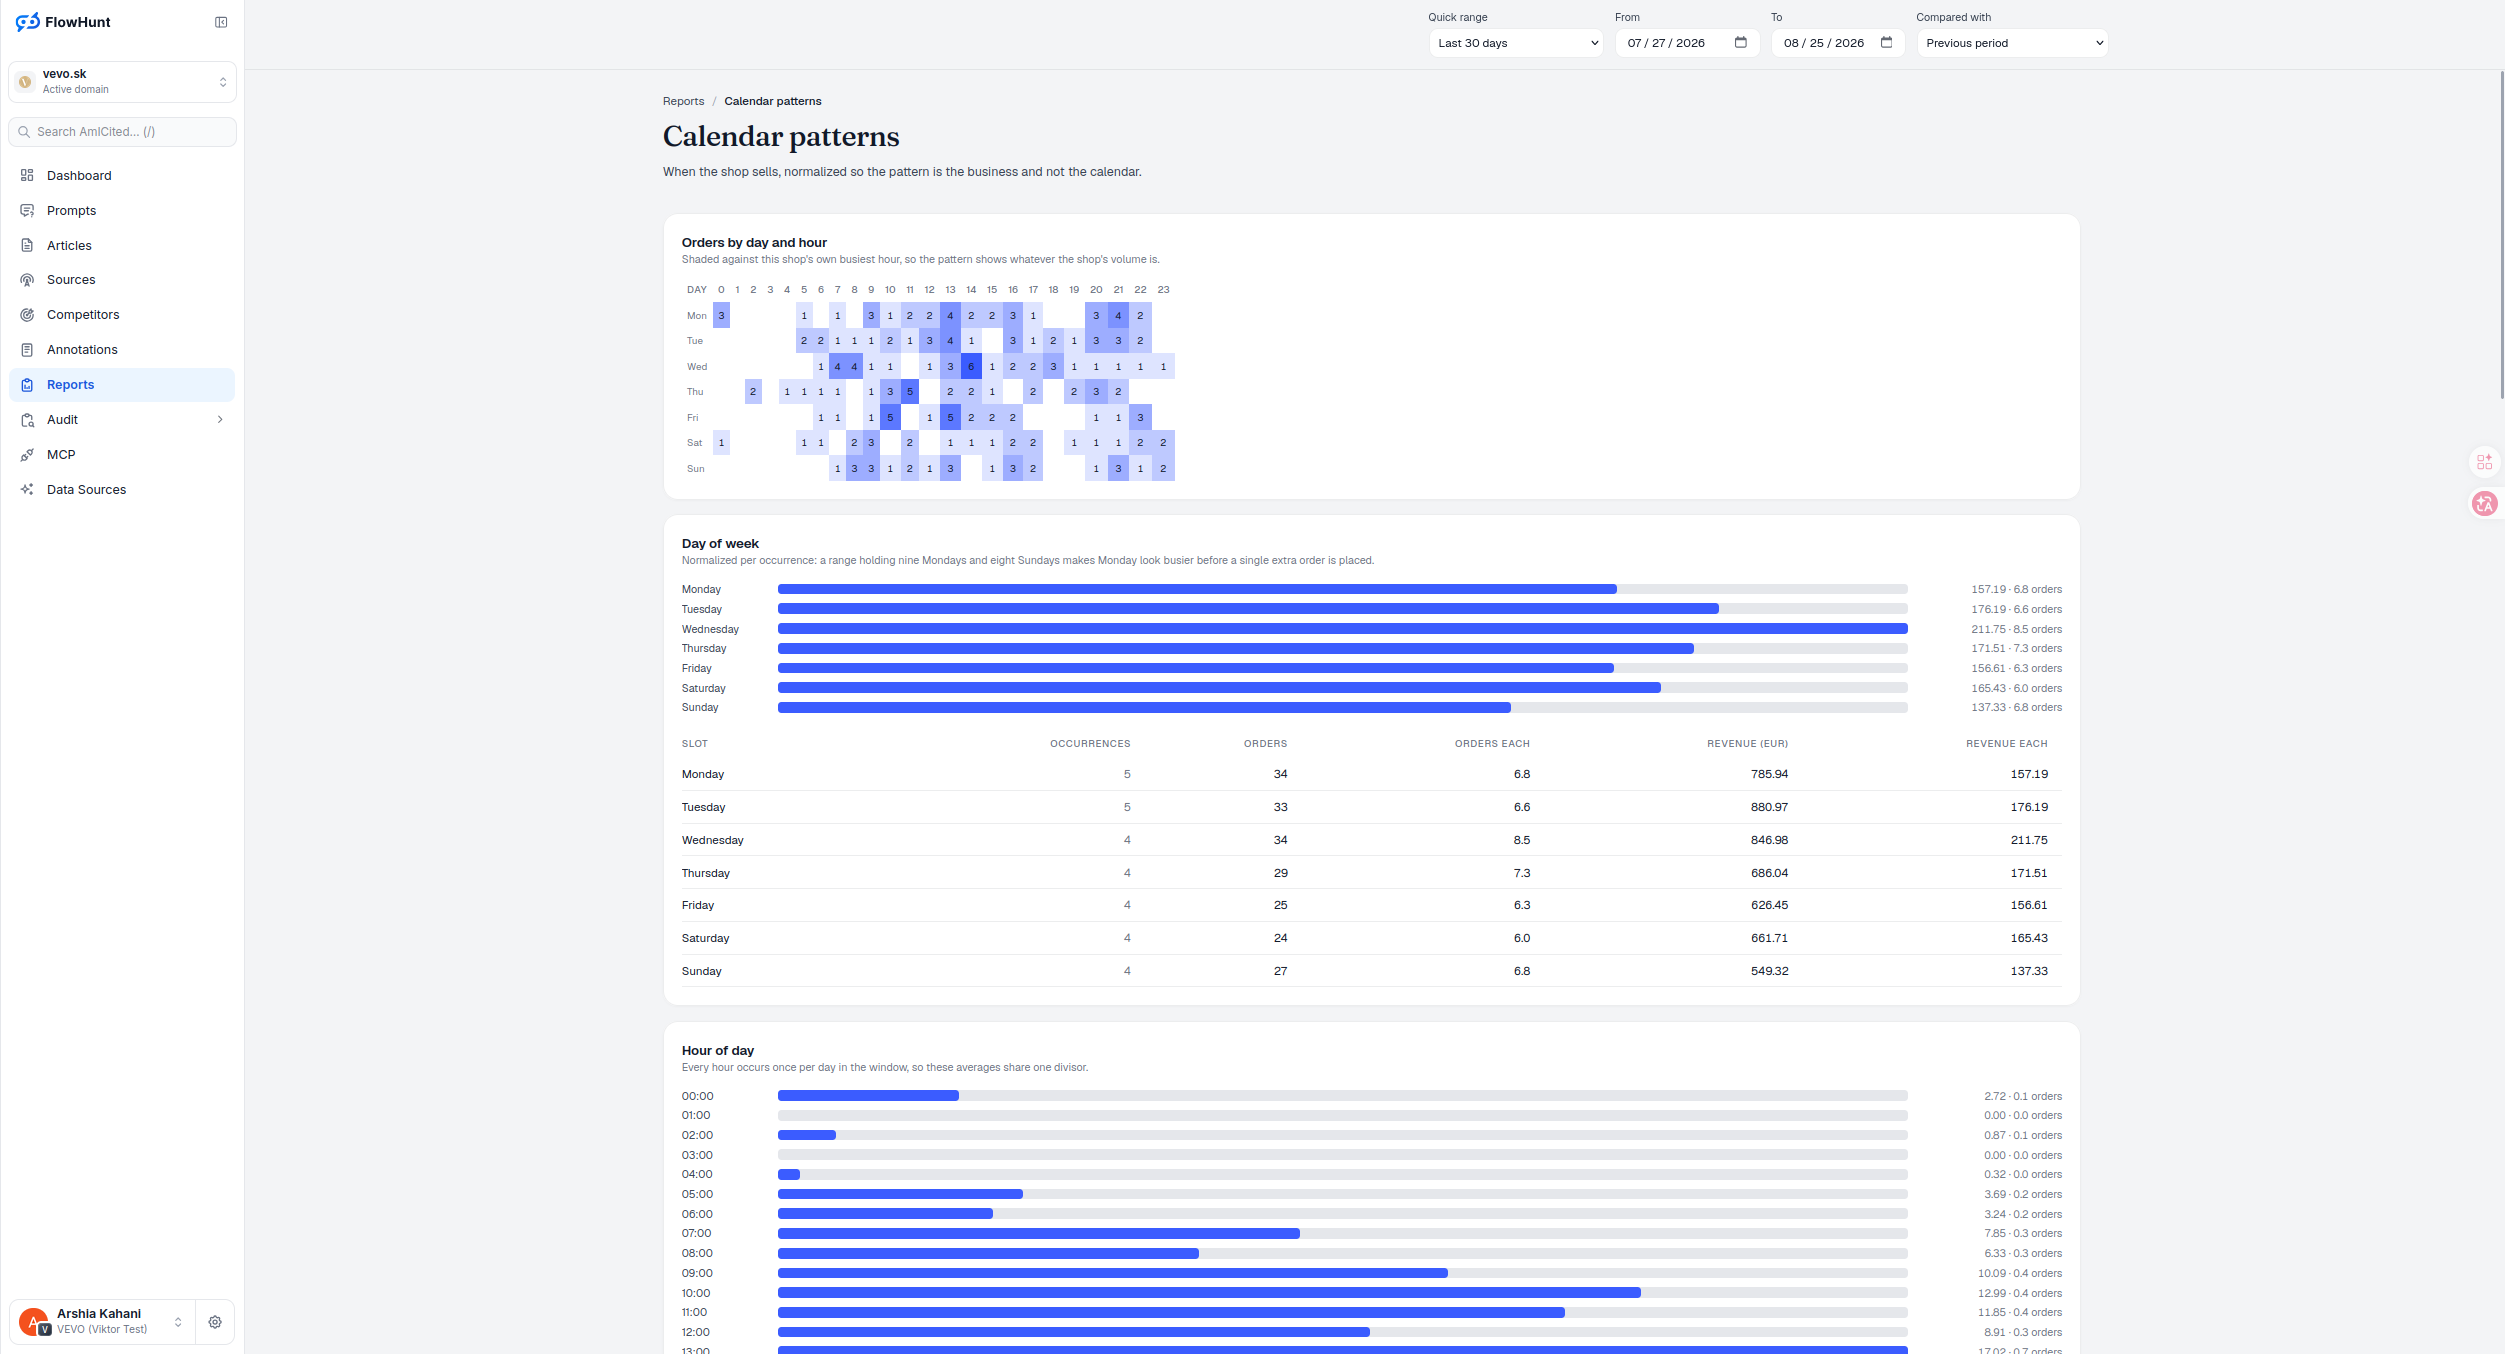
Orders by Day and Hour Heatmap
The heatmap plots day of week against hour of day, one cell per combination, shaded against this shop’s own busiest hour — so the pattern shows whatever the shop’s actual volume is, not a fixed scale built for a bigger shop.
- Orders by day and hour heatmap — a Mon–Sun by 0–23 grid, cell colour is order count, shaded against this shop’s own busiest hour.
- Day of week order pattern, normalized per occurrence — nine Mondays and eight Sundays in a range would make Monday look busier before a single extra order is placed; this table divides that out.
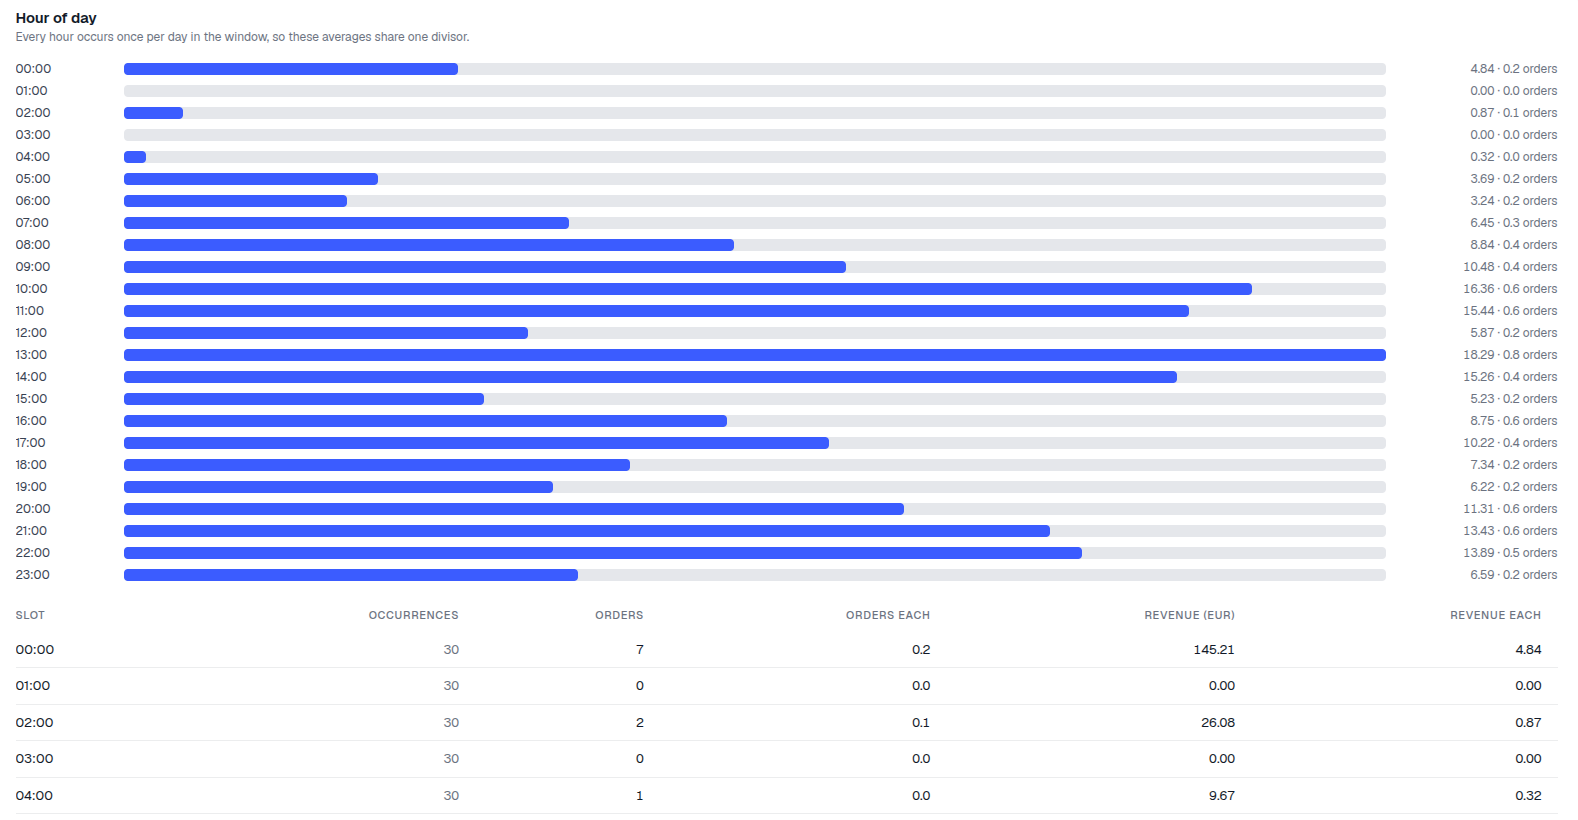
- Hour of day, one shared divisor — every hour occurs once per day in the window, so the averages are directly comparable.
- Day of month, corrected for short months — the 31st exists in seven months of twelve, so its raw total is smaller before payday effects are even considered.
- Week of month, per trading day not per 7 — a month’s fifth week can be two or three days long; dividing by a fixed seven would understate it.
- Payday window — orders grouped by proximity to the typical payday points of a month, a heuristic about the shop’s customers, not a warehouse fact.
Normalized Day and Hour Comparisons
Day of week is normalized per occurrence: a range holding nine Mondays and eight Sundays makes Monday look busier before a single extra order is placed. This window’s revenue-per-occurrence peaks midweek — 211.75 EUR on Wednesday (8.5 orders), against 137.33 EUR on Sunday (6.8 orders), with Monday at 157.19 EUR — not the order the raw totals alone would suggest. Hour of day needs no such correction: every hour occurs once per day in the window, so its averages already share one divisor. Above the bars, the heatmap itself shades each weekday/hour cell by its share of the single busiest cell in the window — the busiest cell is full strength, quieter ones proportionally lighter, and a cell with zero orders is left blank rather than tinted.
- Day of week — slot, occurrences, orders, orders each, revenue (EUR), revenue each — normalized per occurrence.
- Hour of day — every hour occurs once per day in the window, so its averages share one divisor and stay comparable.
- Heatmap shade is shop-relative — opacity is a cell’s count divided by the busiest cell in the window, not an industry benchmark; zero-order cells are left blank.
- Sparse slots stay visible, just dimmed — a slot with fewer occurrences than the report’s own minimum renders at reduced opacity, a signal to not read it as a pattern yet.
Busiest Day and Hour Patterns
Wednesday is this window’s strongest day per occurrence, but the busiest single hour is 13:00, at 17.02 EUR per occurrence and 0.7 orders — well ahead of the morning build-up through 09:00–12:00 and far past the near-dead hours around 02:00–04:00. Reading day and hour together, not separately, is the point: a day can be busy without any one hour standing out, or a quiet day can still have a sharp midday spike worth staffing or scheduling around.
- 13:00 leads — 17.02 EUR per occurrence and 0.7 orders, the highest of any hour this window.
- A build-up, not a single spike — 09:00 through 12:00 climbs steadily before the 13:00 peak, rather than jumping straight there.
- Day and hour answer different questions — Wednesday is the strongest day overall; 13:00 is the strongest hour regardless of which day it falls on.
Month and Week Normalization
The 31st falls in seven months of twelve, so its total is smaller before payday is even considered. Week of month is averaged per trading day, not per 7: Week 1 (days 1–7) held 7 trading days, 15 orders, 413.39 EUR revenue — 59.06 EUR per trading day. Week 3 (days 15–21) held the same 7 trading days but 68 orders and 1,501.38 EUR revenue — 214.48 EUR per trading day. A month’s 5th week can hold as few as two or three trading days, and dividing by a fixed week would understate it.
- Day of month — the 31st falls in seven months of twelve, so its total is smaller before payday is even considered.
- Week of month, per trading day — Week 1: 7 trading days, 15 orders, 413.39 EUR revenue, 59.06 EUR per day. Week 3: 7 trading days, 68 orders, 1,501.38 EUR revenue, 214.48 EUR per day.
- Columns — bucket, trading days, orders, revenue (EUR), CM2 (EUR), revenue per trading day.
breakdowns, six calendar quirks corrected
Day-of-week occurrence counts, hour-of-day divisors, day-of-month short months, and week-of-month trading days are all normalized before the numbers are compared.
See Order mixAnalyze Normalized Calendar Sales Patterns
Orders by day and hour, day of week, hour of day, day of month, week of month and payday window — each one normalized for the calendar quirk that would otherwise mislead it.
Ready to see when your shop actually sells?
Free check · 7-day trial · card required