


Profit Change Drivers and Recommended Actions
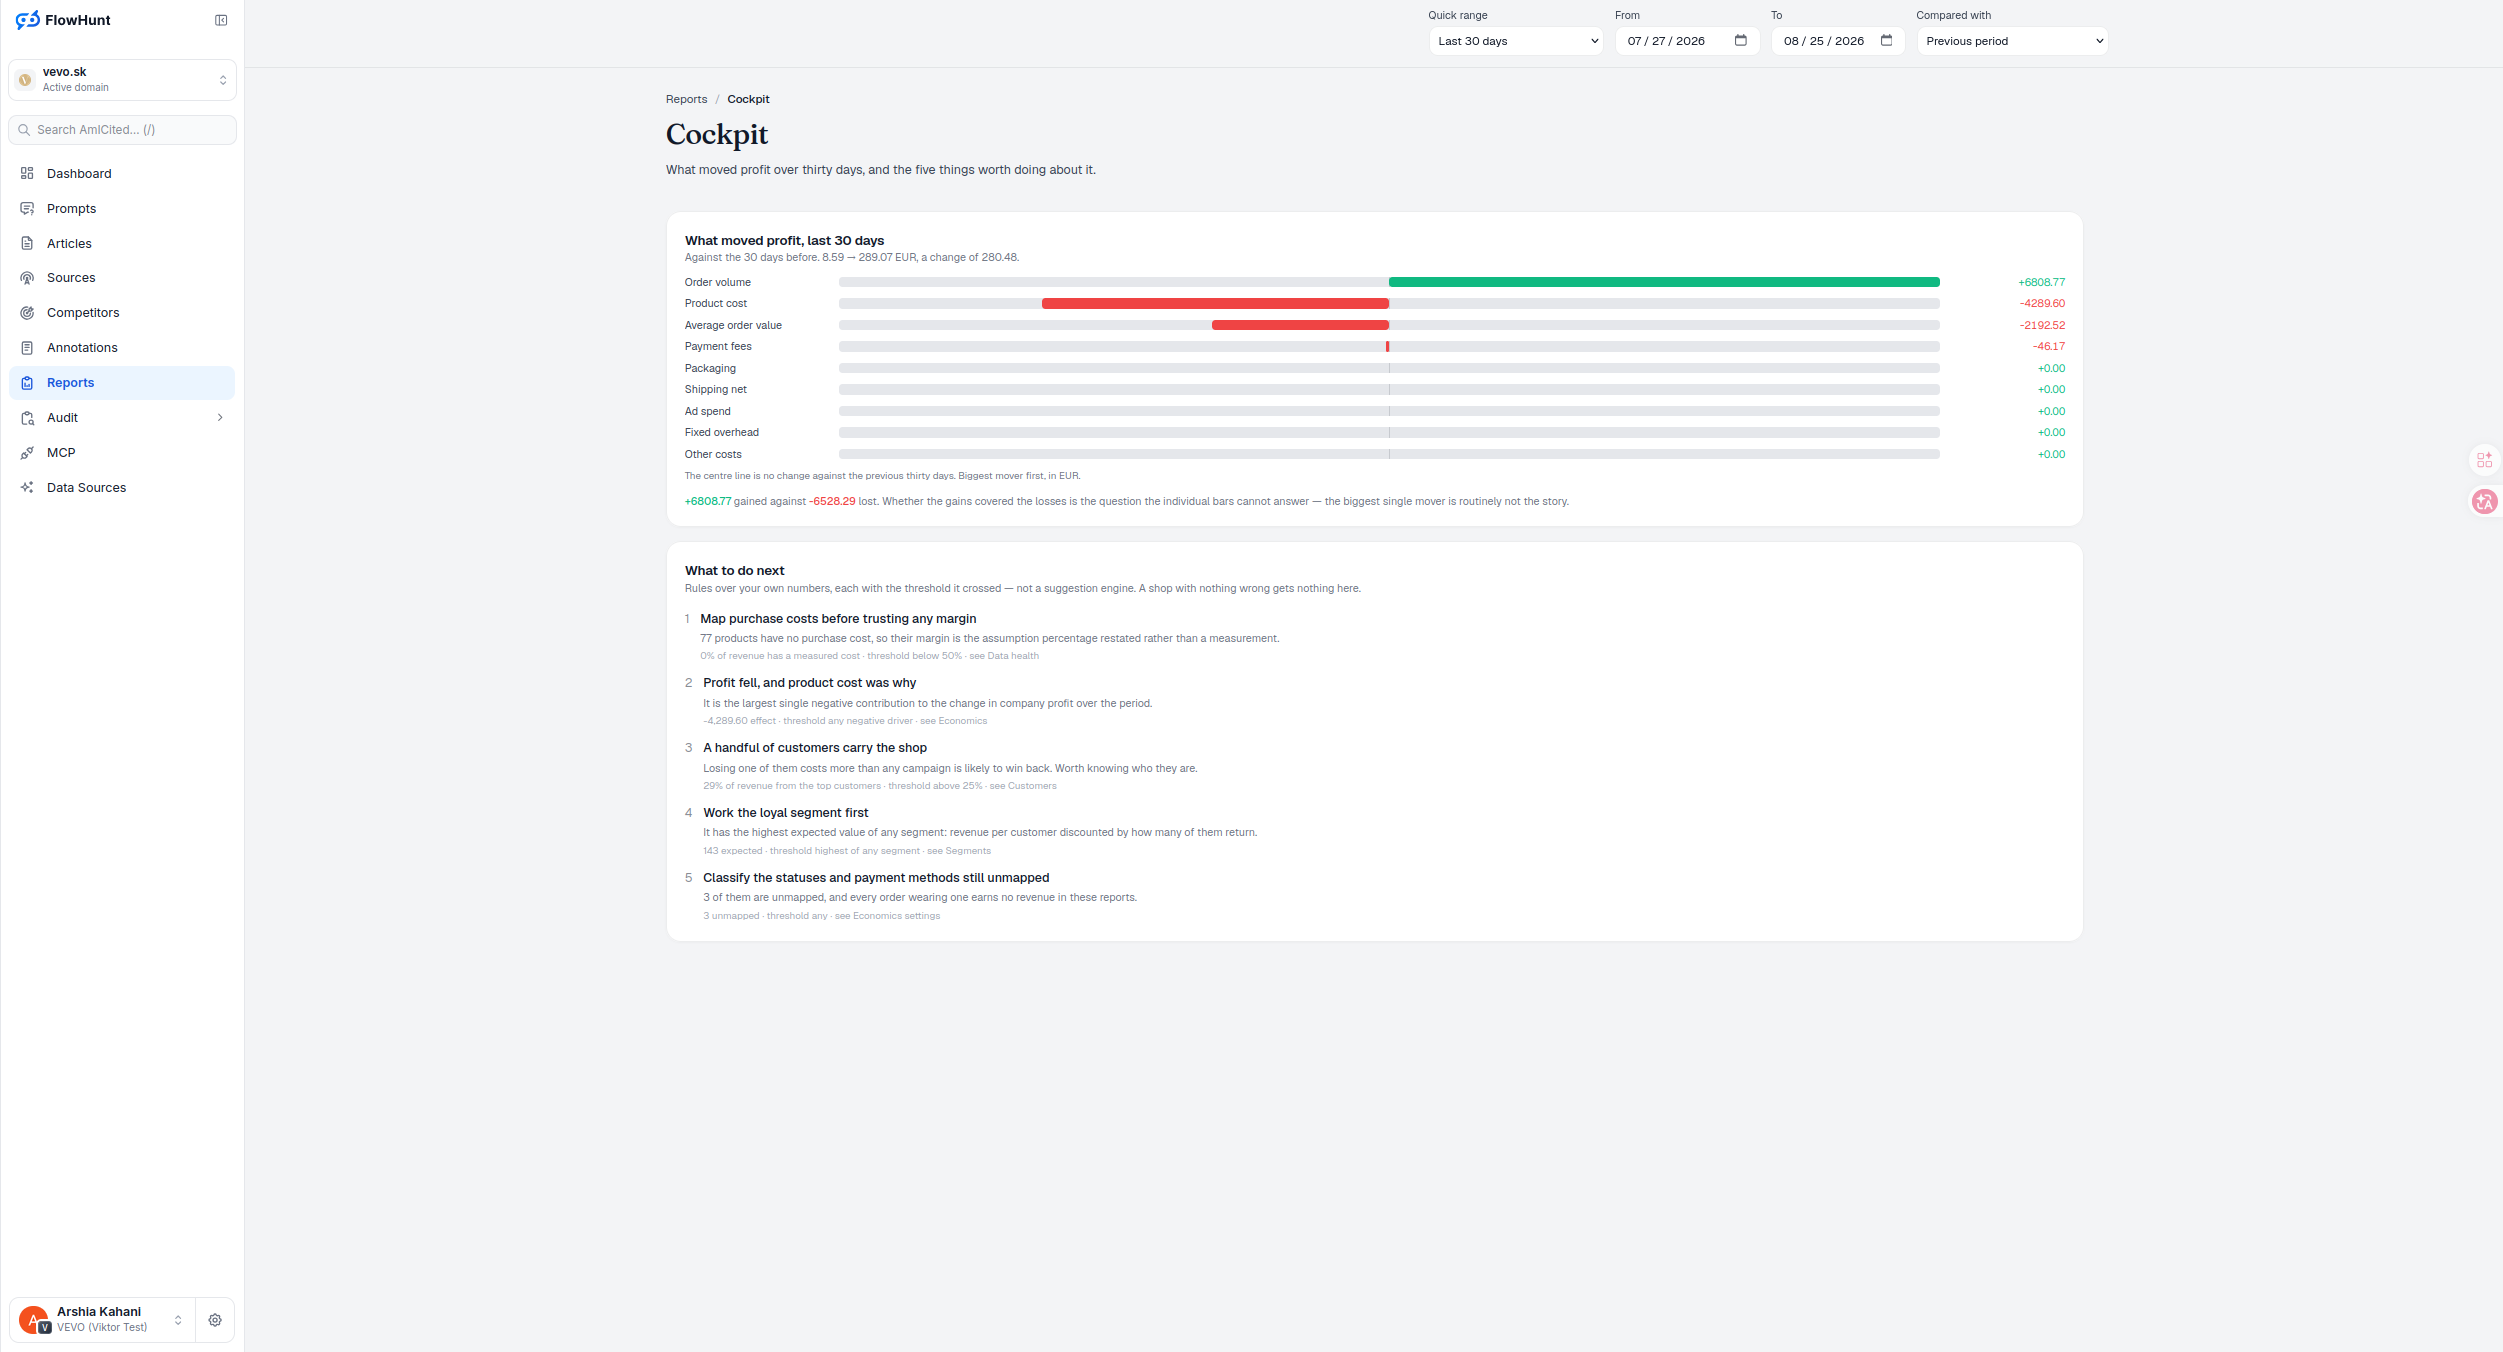
Cockpit compares the thirty days ending on the report’s selected end date with the thirty immediately before them. It breaks the change into revenue and known cost components, then pairs the reconciled waterfall with a short list of rule-triggered actions — not a suggestion engine, just the thresholds your own numbers crossed.
Profit Component Change Summary
Revenue, product cost, packaging, net shipping, payment fees, refunds, ads and fixed overhead each get their own bar against the center line when both windows can support them, so a swing in one component does not disappear inside the total.
- A profit waterfall, thirty days against thirty days — the same window compared against the one immediately before it, biggest mover first.
- Eight explicit components — revenue, product cost, packaging, net shipping, payment fees, refunds, ads and fixed overhead, each shown in profit’s direction when available.
- Gains against losses, stated plainly — total gained and total lost are called out separately, since a big green bar can still lose against a bigger red one.
- Rules over your own numbers — each action lists the threshold it crossed, not a generic tip; a shop with nothing wrong gets nothing here.
- Actions, ranked when they fire — cost coverage, missing mappings, concentration, retention, segment priority and the largest adverse driver can each link to the report that explains it.
Profit Components Ranked by Impact
The current service reads the same daily ledger as the detailed reports, then signs cost changes in profit’s direction: lower ad spend is a positive effect, higher product cost a negative one. Refunds enter only when that shop source is available; other configured costs are checked as a reconciliation input rather than disguised as an ordinary driver.
- Revenue — the top-line change before cost components are applied.
- Product and order costs — product cost, packaging, net shipping and payment fees remain separate.
- Refunds and ads — included only when the underlying source is available; missing is not converted into zero.
- Fixed overhead — the configured overhead effect for the two windows.
Threshold-Based Profit Actions
Each recommendation names the threshold it crossed and links straight to the report that explains it — from an unmapped cost basis, to a profit driver that went negative, to a customer base concentrated in too few accounts. A shop with nothing wrong gets nothing here.
- Data health first — if purchase costs aren’t mapped, no margin figure downstream can be trusted, so this rule fires before any other.
- Largest negative driver surfaced — the most adverse available component can trigger an action linking to Economics.
- Concentration risk named — revenue share from the top customers, checked against a fixed threshold, links to Customers.
- Segment priority — the segment with the highest expected value is called out by name, linking to Segments.
- Unmapped statuses and payment methods — anything still unclassified is flagged, linking to Economics settings.
Profit Waterfall Data Requirements
Two guardrails run behind every render. First, the drivers must sum to the exact profit change recorded in the ledger — if they do not, the unexplained residual is called out and total change is withheld. Second, fewer than four daily observations or ten realized orders in either window prevents a decision-ready bridge. Product cost also requires cost inputs, at least one mapped product cost and full revenue coverage in both windows; refunds require a capable shop source. Unknown components are named and omitted, never drawn as zero.
- Reconciliation, not just arithmetic — the displayed drivers must sum to the real recorded profit change, or a mismatch warning replaces false confidence.
- A data floor before any driver renders — under four daily observations or ten orders in either window, Cockpit says so instead of guessing.
- Missing costs are never zero — a driver with no data is omitted from the chart, not drawn in as “nothing happened.”
- Hover for the exact numbers — the profit-change line shows precise values and the exact date windows being compared on hover.
days compared, with every unavailable component stated
Not a suggestion engine — a set of rules run over your own numbers. A shop with nothing wrong gets an empty list, not filler.
See Sales engineReview Profit Changes and Actions
A thirty-day waterfall of every available component, plus a short list of rule-triggered actions — each with the threshold it crossed.
Ready to see what moved your profit?
Free check · 7-day trial · card required