


Contribution Margin and Cost Mix Analysis
Cost mix is a contribution ladder that walks revenue down through product cost, packaging and shipping, ad spend, fixed overhead and other costs — each step measured against 100% of revenue, not against the largest step — then backs it with daily trends and the basket sizes driving it.
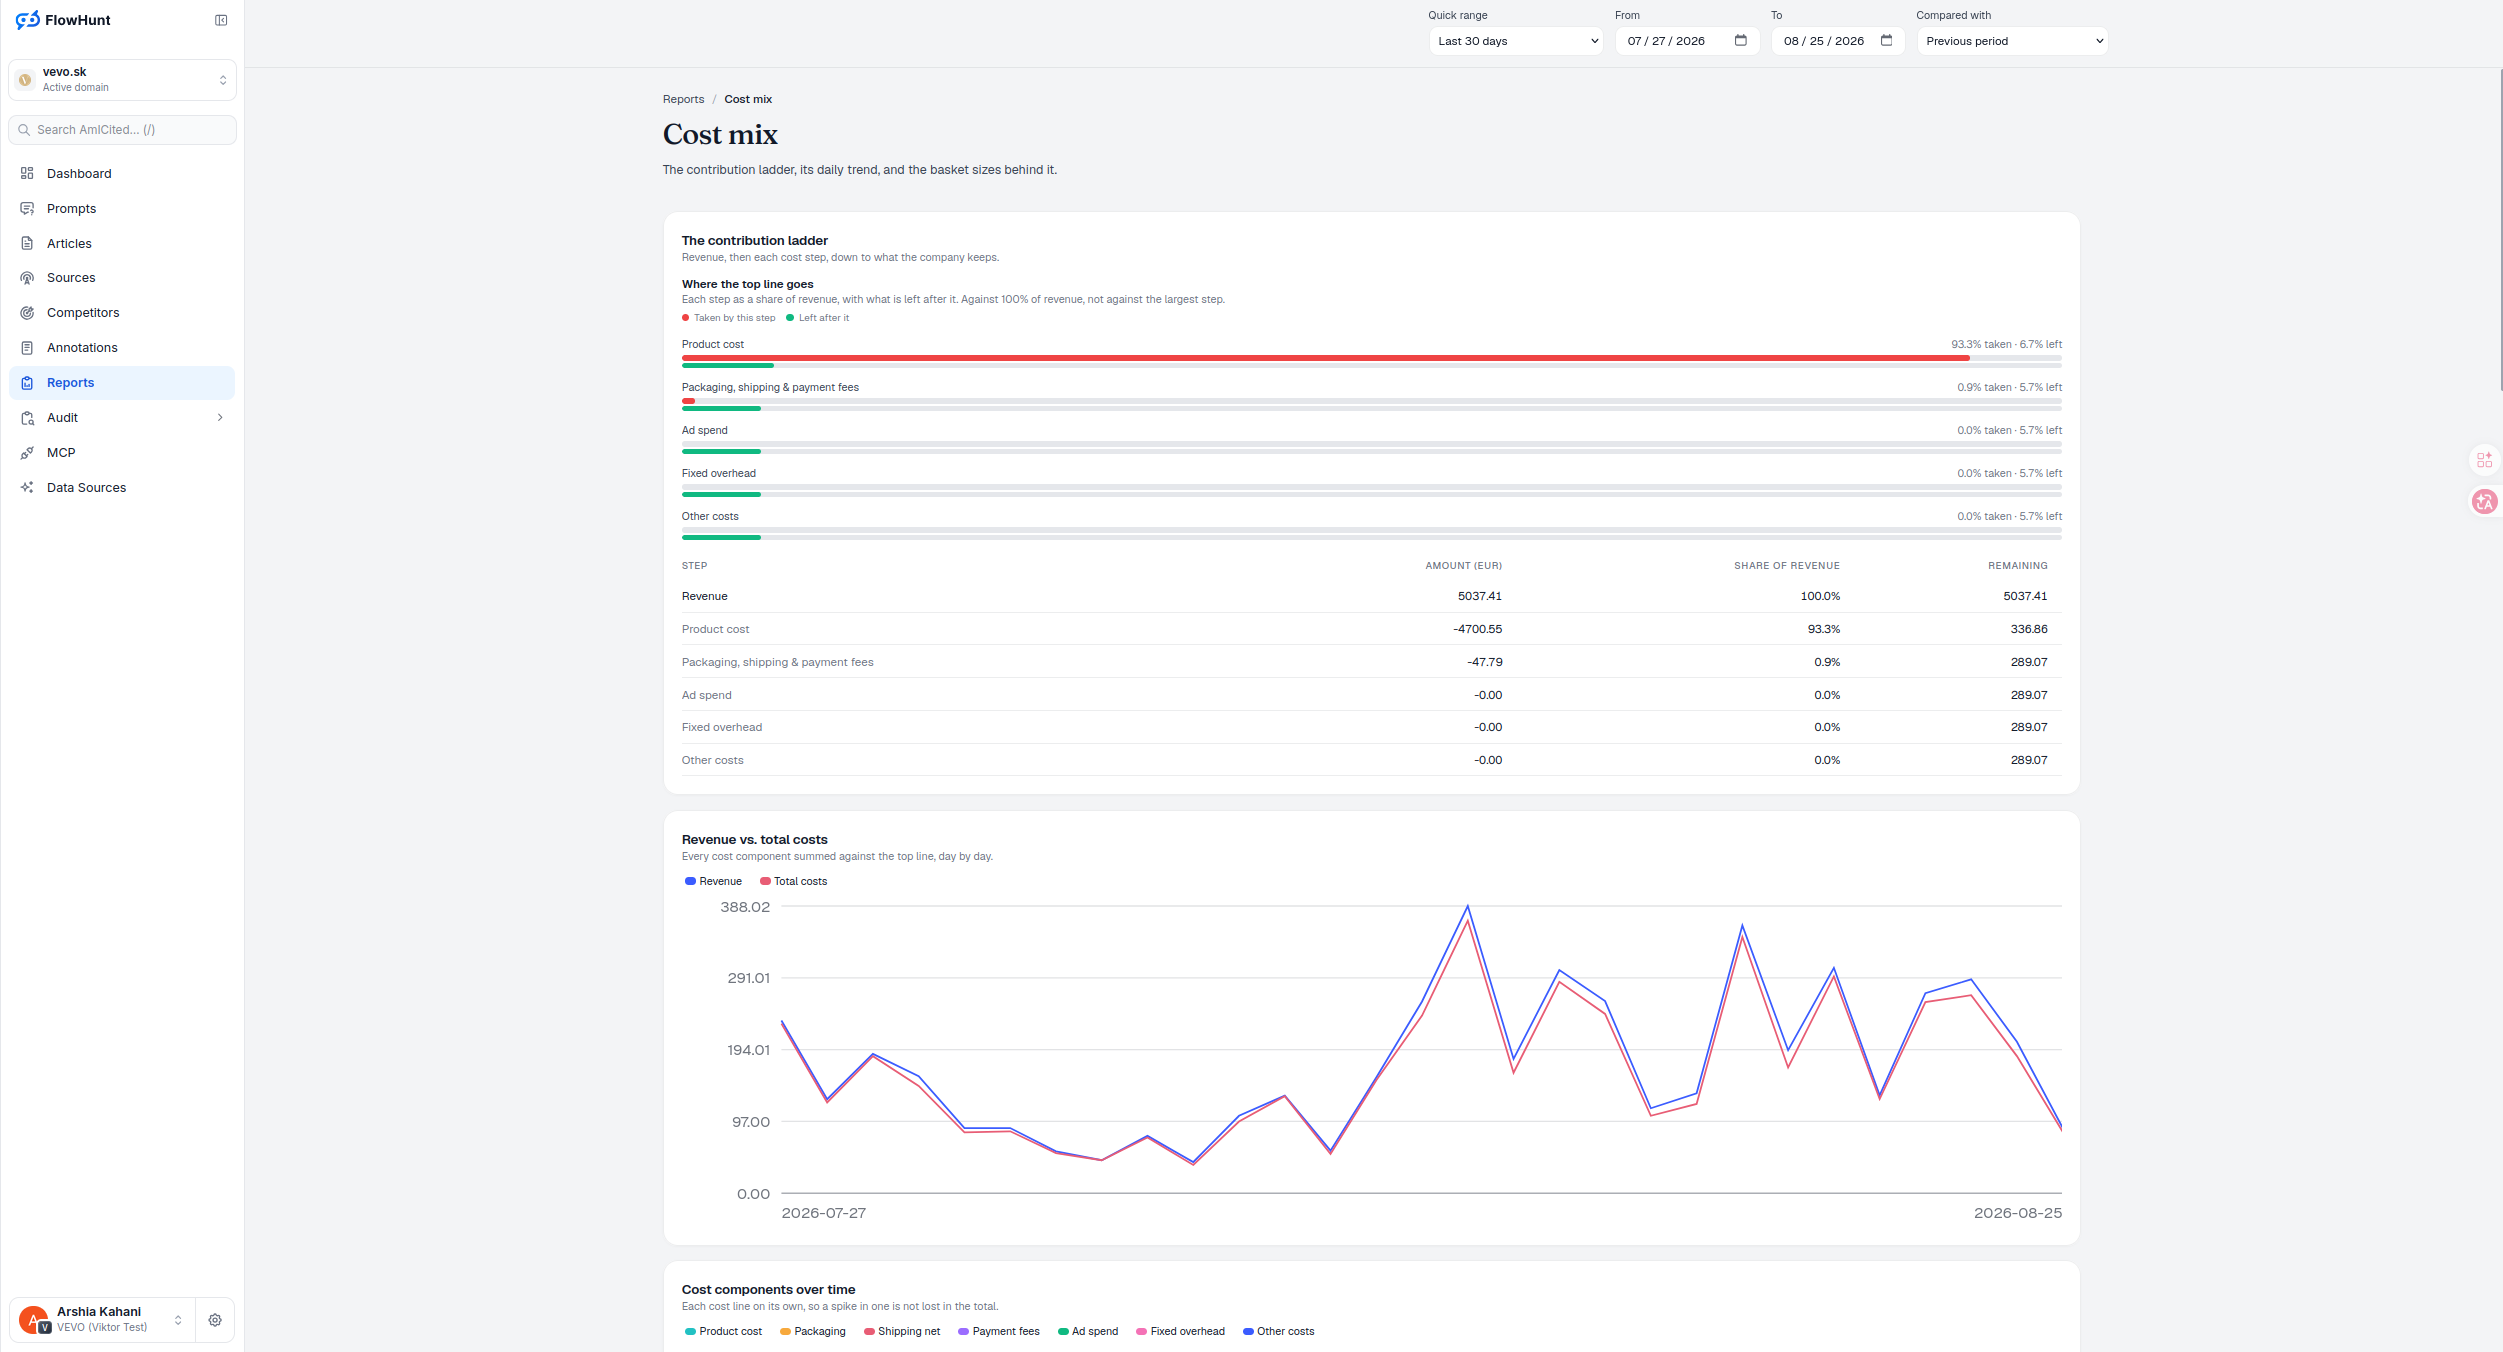
Revenue Deductions and Retained Margin
Product cost takes 93.3% of revenue on its own, leaving 6.7%. Packaging, shipping and payment fees together take another 0.9%, leaving 5.7% — and ad spend, fixed overhead and other costs take nothing further this window, so 5.7% is what remains.
- Five steps, one ladder — product cost, packaging/shipping & payment fees, ad spend, fixed overhead, other costs, each shown as taken and left.
- Against 100% of revenue — every step is a share of the whole top line, not of the largest step, so the steps stay comparable.
- Revenue vs. total costs — every cost component summed against the top line, day by day.
- Cost components over time — each of the seven cost lines drawn on its own, so a spike in one isn’t lost inside the total.
- Gross margin trend and contribution margin per unit calculator — CM1/CM2 margin and CM2 spread over earning orders, both skipping days with no qualifying activity rather than faking a zero.
- Basket size distribution — every reported order bucketed by revenue and by item count, cancelled or not.
- Rule-based notes, not always-on chatter — the ladder names a dominant cost only when it runs at least 1.25 times the next largest, and trend advice needs at least three realized orders in each half of the window and a shift of five percentage points or more; short of that, it reports a balanced mix or stays quiet.
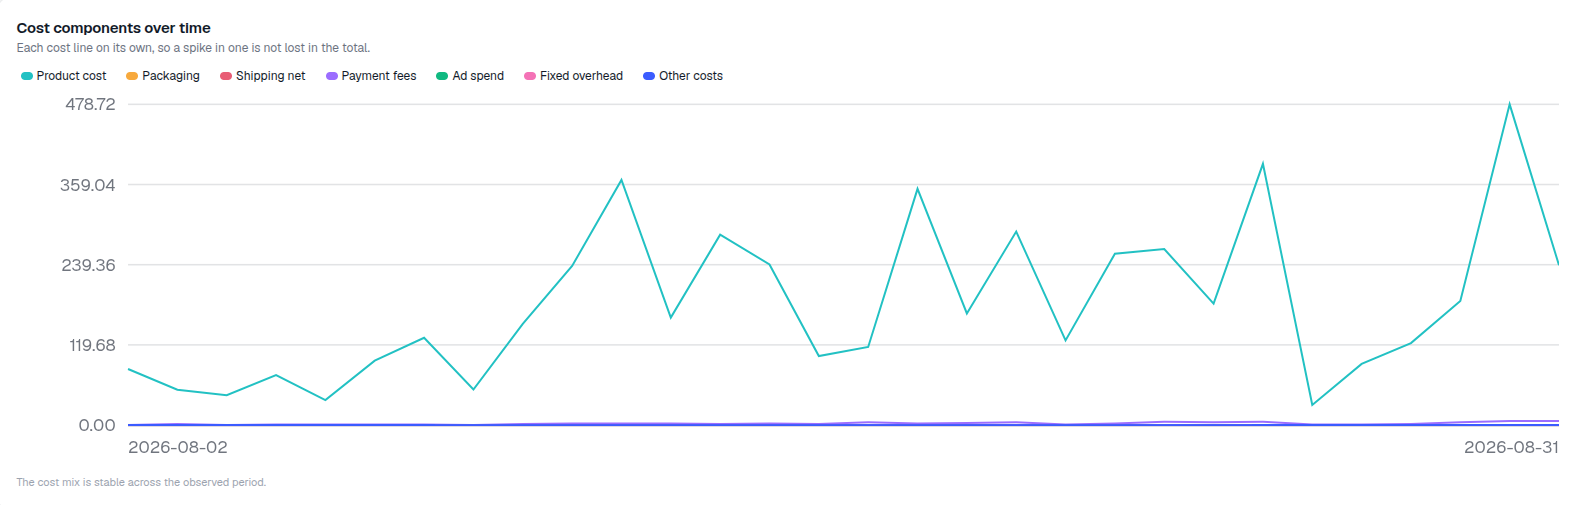
Basket Size Distribution Analysis
By revenue: 148 orders between 0.00-20.00 EUR, 110 between 20.00-50.00, 10 between 50.00-100.00, 2 between 100.00-200.00, none above that this window. By item count: 123 single-item orders, 108 with two items, 20 with three, 13 with four to five, 6 with six or more.
- By revenue (EUR) — six bands from 0.00-20.00 up to 500.00+, most orders clustered in the two lowest bands.
- By item count — five bands from a single item up to six or more, single- and two-item orders dominate.
- Cancelled orders included — the distribution counts every reported order; separating cancelled from earning needs the status map, which this view intentionally doesn’t join.
Margin Trends and Unit Economics
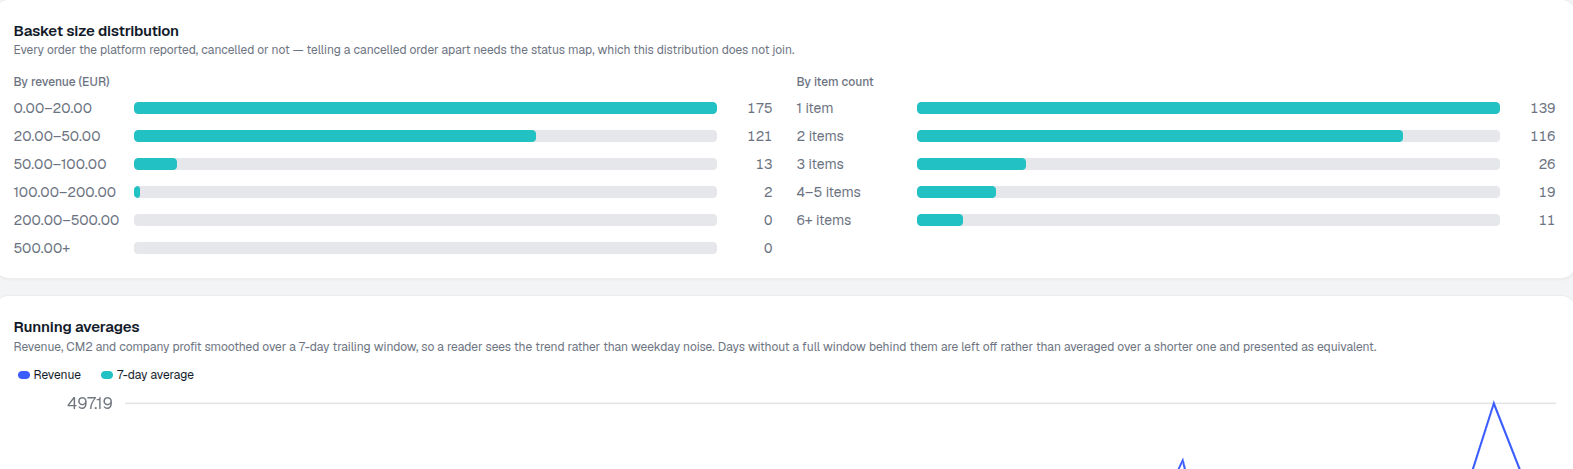
Revenue, CM2 and company profit each get a 7-day trailing average alongside the daily figure, so weekday noise doesn’t read as a trend — days without a full window behind them are left off rather than averaged short and shown as equivalent. The margin corridor takes it one step further: CM2 margin (green) against its own 7-day baseline (teal), latest at 6.1% against a baseline of 6.7%.
- Three running-average charts — revenue, CM2, and company profit, each against its own 7-day trailing average.
- Incomplete windows excluded — a day without seven prior days behind it is left off, not averaged over a shorter window and presented as equivalent.
- Margin corridor — CM2 margin against its trailing baseline, so a real break in margin is visible against ordinary day-to-day variation.
- Items and basket depth — item lines per order (orange) and units per order (purple), both averaged over earning orders only.
- A floor under every rule — none of the ladder or trend notes fire below 10 realized orders in the window; a shop that small gets silence instead of a rule reacting to noise.
- Meta relationship — Profit-true ROAS uses the same shop contribution layers beside filtered Meta spend; incomplete cost inputs stay unavailable there instead of falling back to revenue.
Contribution Margin Cost Structure
The ladder above reads top to bottom, red taken against green left. This is the same five steps and the same window, redrawn against a centre line: every step that takes revenue pulls left, sized against product cost since nothing else this window came close, and what actually survives to the bottom pulls right. When one step this lopsided shows up, it is the first thing worth pressure-testing — a purchase-cost mapping gap reads exactly like a real cost here.
- Product cost alone — 93.3% of revenue, dwarfing every other step combined this window.
- Everything past it is thin — packaging, shipping and payment fees together take another 0.9%; ad spend, fixed overhead and other costs take nothing further.
- 5.7% survives — what is left after all five steps, pulling the opposite direction from every cost that took a share.
of revenue taken by product cost alone
Leaving 6.7% before packaging, shipping, payment fees, ad spend, fixed overhead and other costs are even counted.
See CockpitAnalyze Contribution Margin Layers
Each cost step against 100% of revenue, daily cost trends, margin corridor, and the basket sizes behind all of it.
Ready to see exactly where your margin goes?
Free check · 7-day trial · card required