


CTR Gap for Organic Rankings
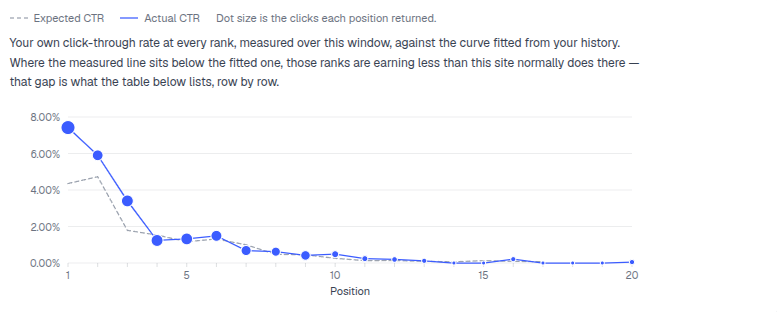
The CTR Gap report measures you against your own click through rate curve, not an industry table. Curves are fitted weekly from 90 days of this site’s own impressions and clicks, bucketed by whole position 1 through 20, with at least 1,000 impressions required before a position gets a published expectation — then the report lists the queries and pages landing materially below it.
CTR Gap Investigation Evidence
A result page with an AI overview, answer box or carousel earns fewer clicks at any rank, and this report can’t yet tell that apart from a copy problem — so treat the top rows as where title and meta description work, since at the same rank the snippet is the one variable you control.
- Your click-through curve, not a benchmark — refitted weekly from this site’s own impressions and clicks.
- Two charts, side by side — Actual CTR against your fitted curve on the left, Impressions by position on the right, so a gap and its underlying traffic volume read together.
- List toggle: Queries or Pages — read the gap at whichever grain the fix will happen at.
- Four filters — Best position, Worst position, Min impressions and Min gap (%), so the table only ever shows gaps worth acting on.
- Clicks at stake, quantified — what closing the gap to expectation would return, in real clicks, not just a percentage.
- Check the live result before rewriting — an AI overview or carousel suppresses clicks at every rank; no snippet fixes that.
- No fit, no fake benchmark — if the narrowest level has not accumulated enough impressions, lookup falls back through broader engine, country or device and site-wide curves before saying honestly that nothing is fitted yet.
Expected and Actual CTR
The y-axis always starts at zero with four round percentage intervals — never truncated, so the visual gap between the solid actual-CTR line and the dashed expected-curve line is the real gap, not an exaggerated one. Each dot’s area, not its radius, is proportional to the clicks behind it, capped at a minimum and maximum size; a missing position breaks the line instead of plotting a false zero. Beside it, the impressions bar chart shares the same position axis, so a visible gap can be checked against how much volume actually sits behind that rank.
- Expected → actual, side by side — the fitted curve’s prediction for that position against what this query or page actually earns, plus impression-weighted position, expectation source and fitting level.
- Clicks at stake — max(expected CTR − actual CTR, 0) × impressions; a modelled return from closing the gap, not a guaranteed one.
- Color-coded against expectation — actual CTR reads green at or above the fitted curve, amber between 75 and 99 percent of it, red below 75 percent.
- Sorted by clicks at stake — the row worth fixing first is always at the top, and every sortable column can flip that order.
- Not fitted yet, said plainly — reported honestly when a site’s curve hasn’t accumulated enough history.
- Query or Page, filtered and exported — best/worst position, minimum impressions and minimum gap keep the table to gaps worth acting on; results page by 50, the current page exports to CSV with the fitted date, and the full filter state lives in the URL to share.
Track CTR Gap Changes
Recheck the same rows a few weeks after rewriting a title or meta description — the curve is refitted weekly, so the comparison against your own history stays fair instead of drifting. Turn on comparison and the table adds relative CTR change per row, a percentage move against the prior window, not a percentage-point shift — read it alongside the color coding, since a lower gap is progress but only a green row has actually cleared this site’s own bar.
- Before and after, same curve — no shifting benchmark to argue against.
- Per page, per query — see exactly which snippet edit worked.
- Or point the query elsewhere — a page far below expectation is often the wrong page for that intent; sometimes redirecting attention beats editing copy.
assumed — every curve point is fitted from this site’s own data
No industry benchmark stands in for your actual click-through behavior. The curve refits weekly, so the comparison always stays fair.
See Striking DistanceFind Organic CTR Gaps
Your own click-through curve, refitted weekly, flags exactly which queries and pages are underperforming their position — and how many clicks that’s costing.
Ready to find the ranks earning less than they should?
Free check · 7-day trial · card required