


Data Health for Reliable Profit Reporting
Every margin figure is only as good as the data behind it. Data Health starts with warehouse reconciliation assertions, shows the share of revenue backed by mapped purchase costs versus estimates, ranks the missing-cost worklist, and exposes operational return and expense-source signals that qualify downstream profit reports.
Warehouse and Cost Coverage Checks
Warehouse assertions compare observed and expected money, order and date totals, each with its observation count and repair action. They run before the coverage and operations sections so a reconciliation failure is visible before anyone treats a plausible margin as decision-ready. The measured-versus-assumed split then makes cost readiness a tracked figure of its own.
- Pass, fail or not enough data — checks do not force a verdict when values or the minimum evidence are missing.
- Measured vs assumed coverage — mapped-cost revenue against revenue using an estimate, summed from components rather than averaged across days.
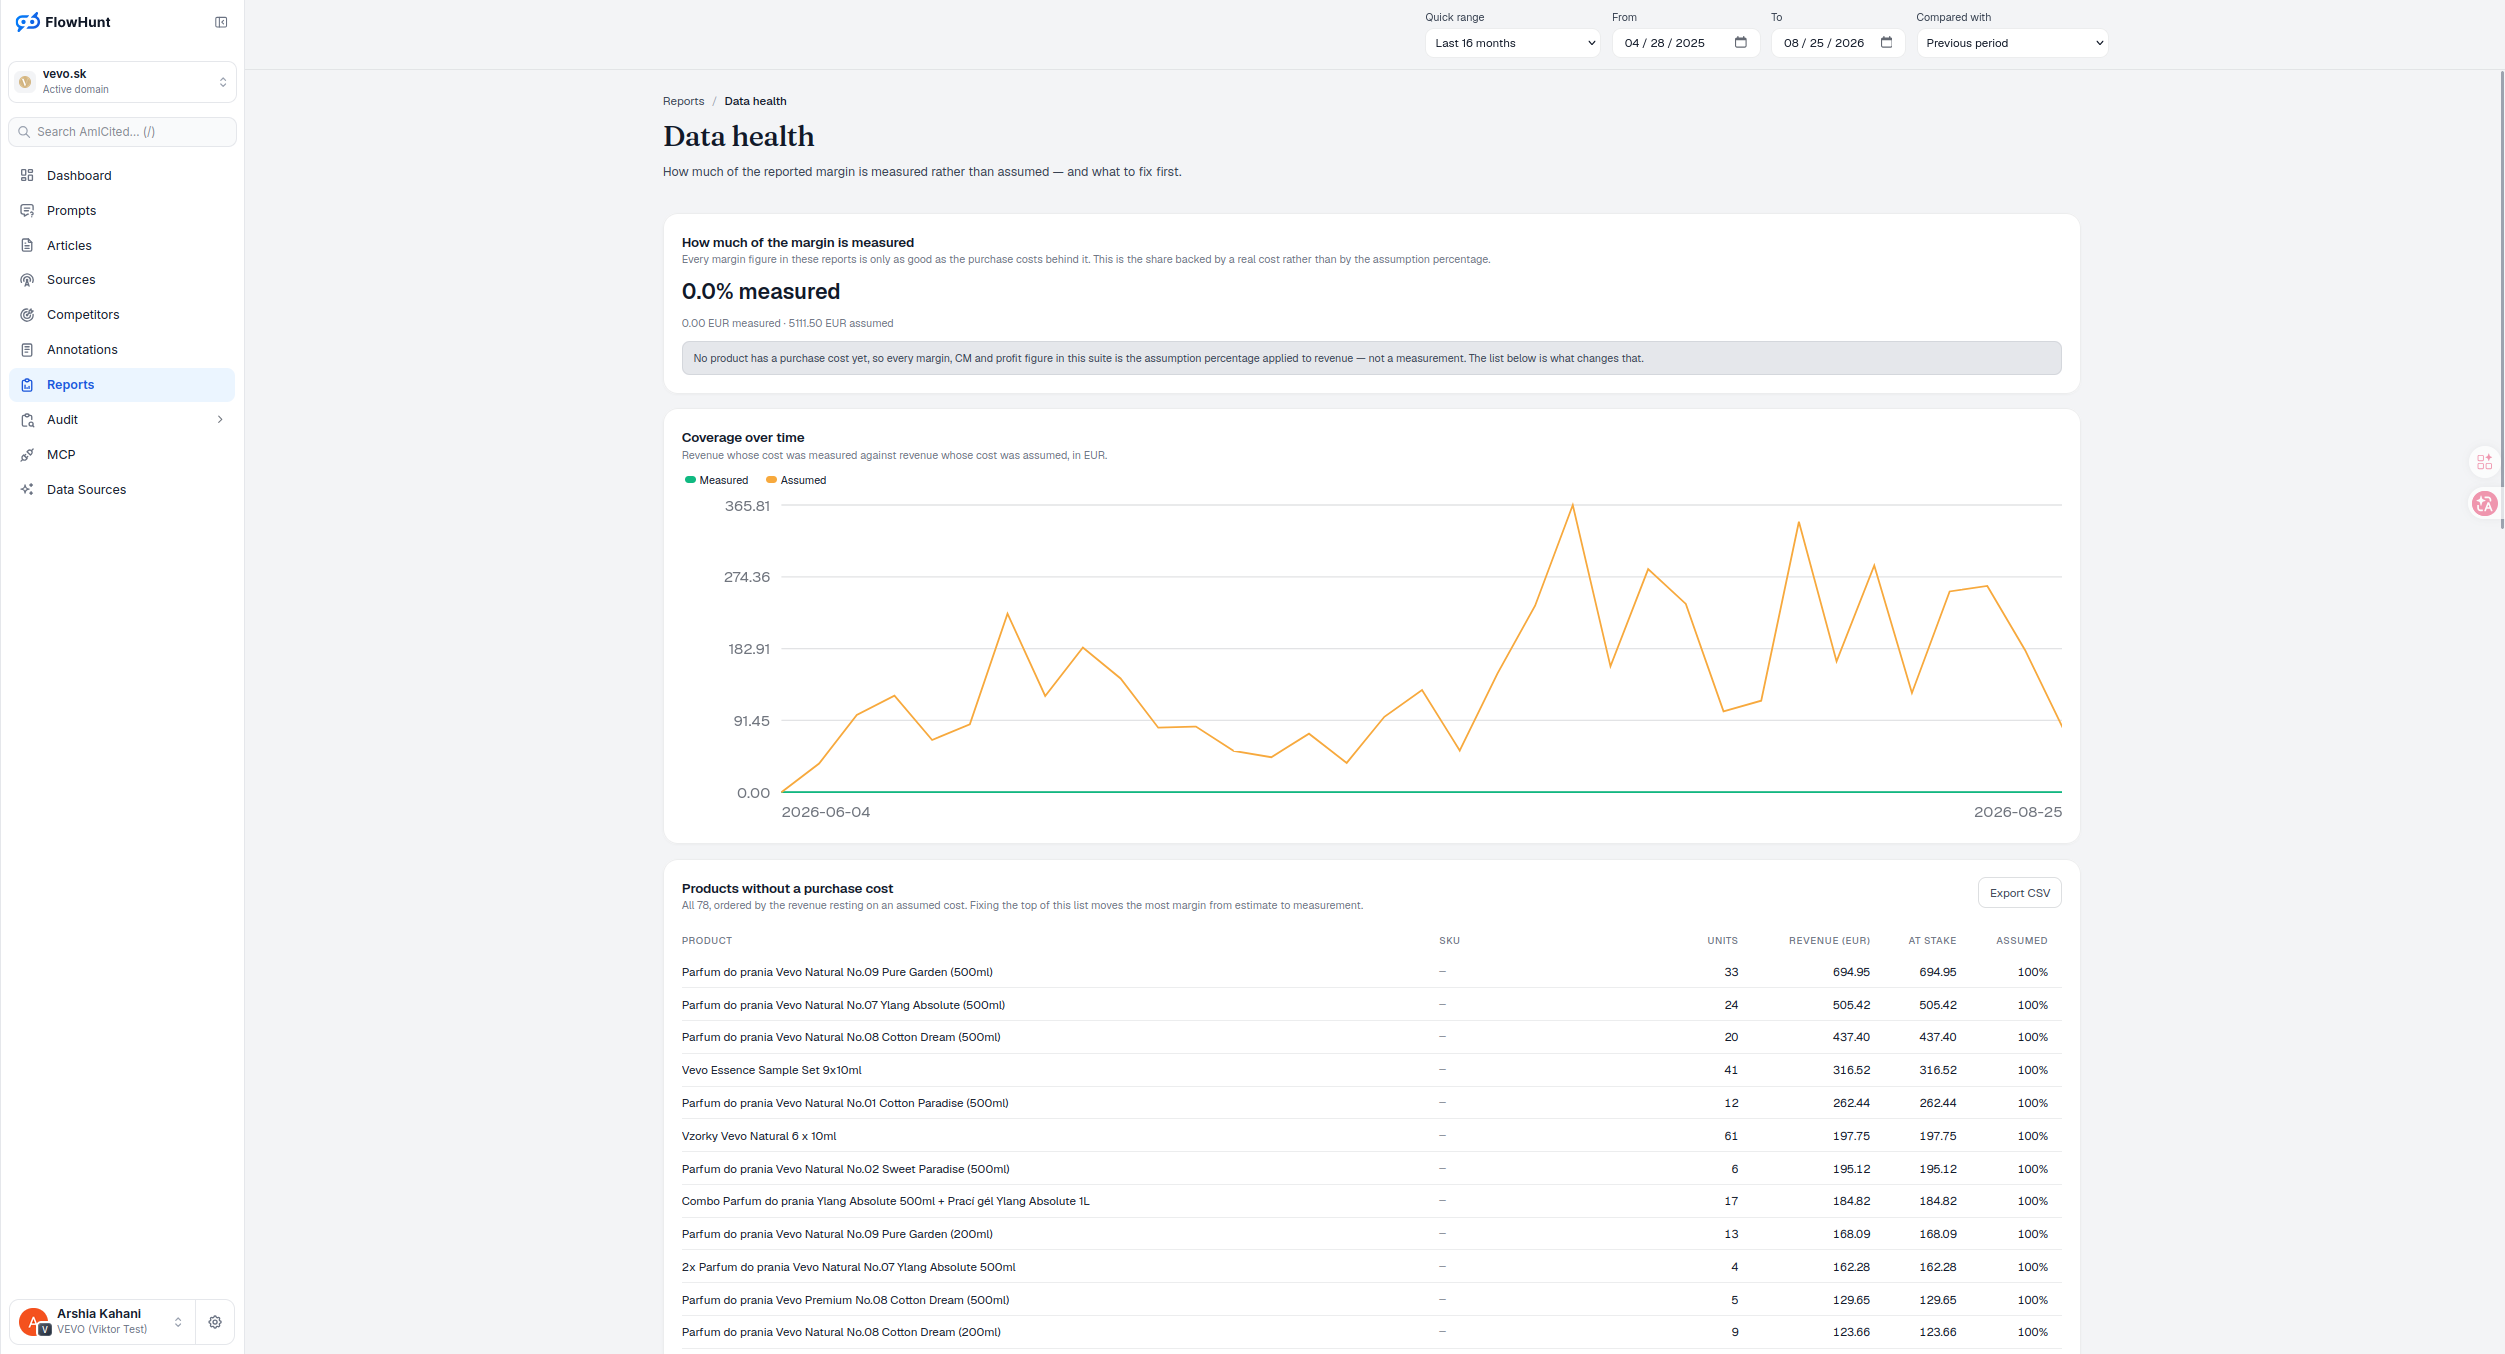
- Coverage over time — measured revenue (green) against assumed revenue (orange), in EUR, so you can watch the split move as costs get filled in.
- Products without a purchase cost, ranked — all 78, ordered by the revenue resting on an assumed cost, so fixing the top of the list moves the most margin from estimate to measurement.
- Export CSV — take the exact ranked list into wherever purchase costs actually get entered.
- Every downstream contribution figure inherits this — incomplete product costs qualify CM1, CM2, CM3, profit and the Meta contribution reports.
Measured and Assumed Cost Coverage
This is the share of margin backed by a real cost rather than the assumption percentage — not a health score against some ideal. At 0.0% measured, every margin, CM and profit figure in this suite is currently the assumption percentage applied to revenue, and Coverage over time tracks that split in EUR as purchase costs get added.
- 0.0% measured — 0.00 EUR measured against 5111.50 EUR assumed, the whole of reported revenue.
- Coverage over time — a chart of measured revenue against assumed revenue, in EUR, legend Measured (green) / Assumed (orange).
- No product excluded — the figure covers every product with reported revenue, not a sample.
Products Missing Purchase Costs
Products missing a purchase cost are ordered by the revenue resting on an assumed cost — not alphabetically, not by unit count. A product can be partly covered when a cost period began after some orders, so its own assumed share is retained rather than flattened to an all-or-nothing flag.
- Complete list, ordered by revenue at stake — the products where an assumed cost is standing in for the most real revenue come first.
- PRODUCT, SKU, UNITS, REVENUE (EUR), AT STAKE, ASSUMED — six columns, everything needed to prioritise without leaving the table.
- Export CSV — hand the exact ranked list to whoever enters purchase costs.
Returns and Cost Source Readiness
Carrier rows combine shipments, returned orders, credit notes, net refunds and fulfilment cost; low-volume carriers remain observations without a decision-ready return rate. A separate monthly status proxy shows how orders sit in mapped refund-related states, while Expense Source Mix splits order lines and revenue between mapped, estimated and missing product cost. Together they explain why a profit or contribution number may be unavailable even when revenue is present.
cost sources kept separate: mapped, estimated and missing
Coverage, source mix and warehouse assertions show exactly what is measured, estimated or unavailable before a downstream margin is trusted.
See Purchase CostsValidate Margin Data Quality
The share of revenue backed by a real purchase cost versus the assumption percentage standing in for it, plus a ranked list of exactly which products to fix first.
Ready to see how much of your margin is real?
Free check · 7-day trial · card required