


Ecommerce Contribution Margin Calculator and Trends
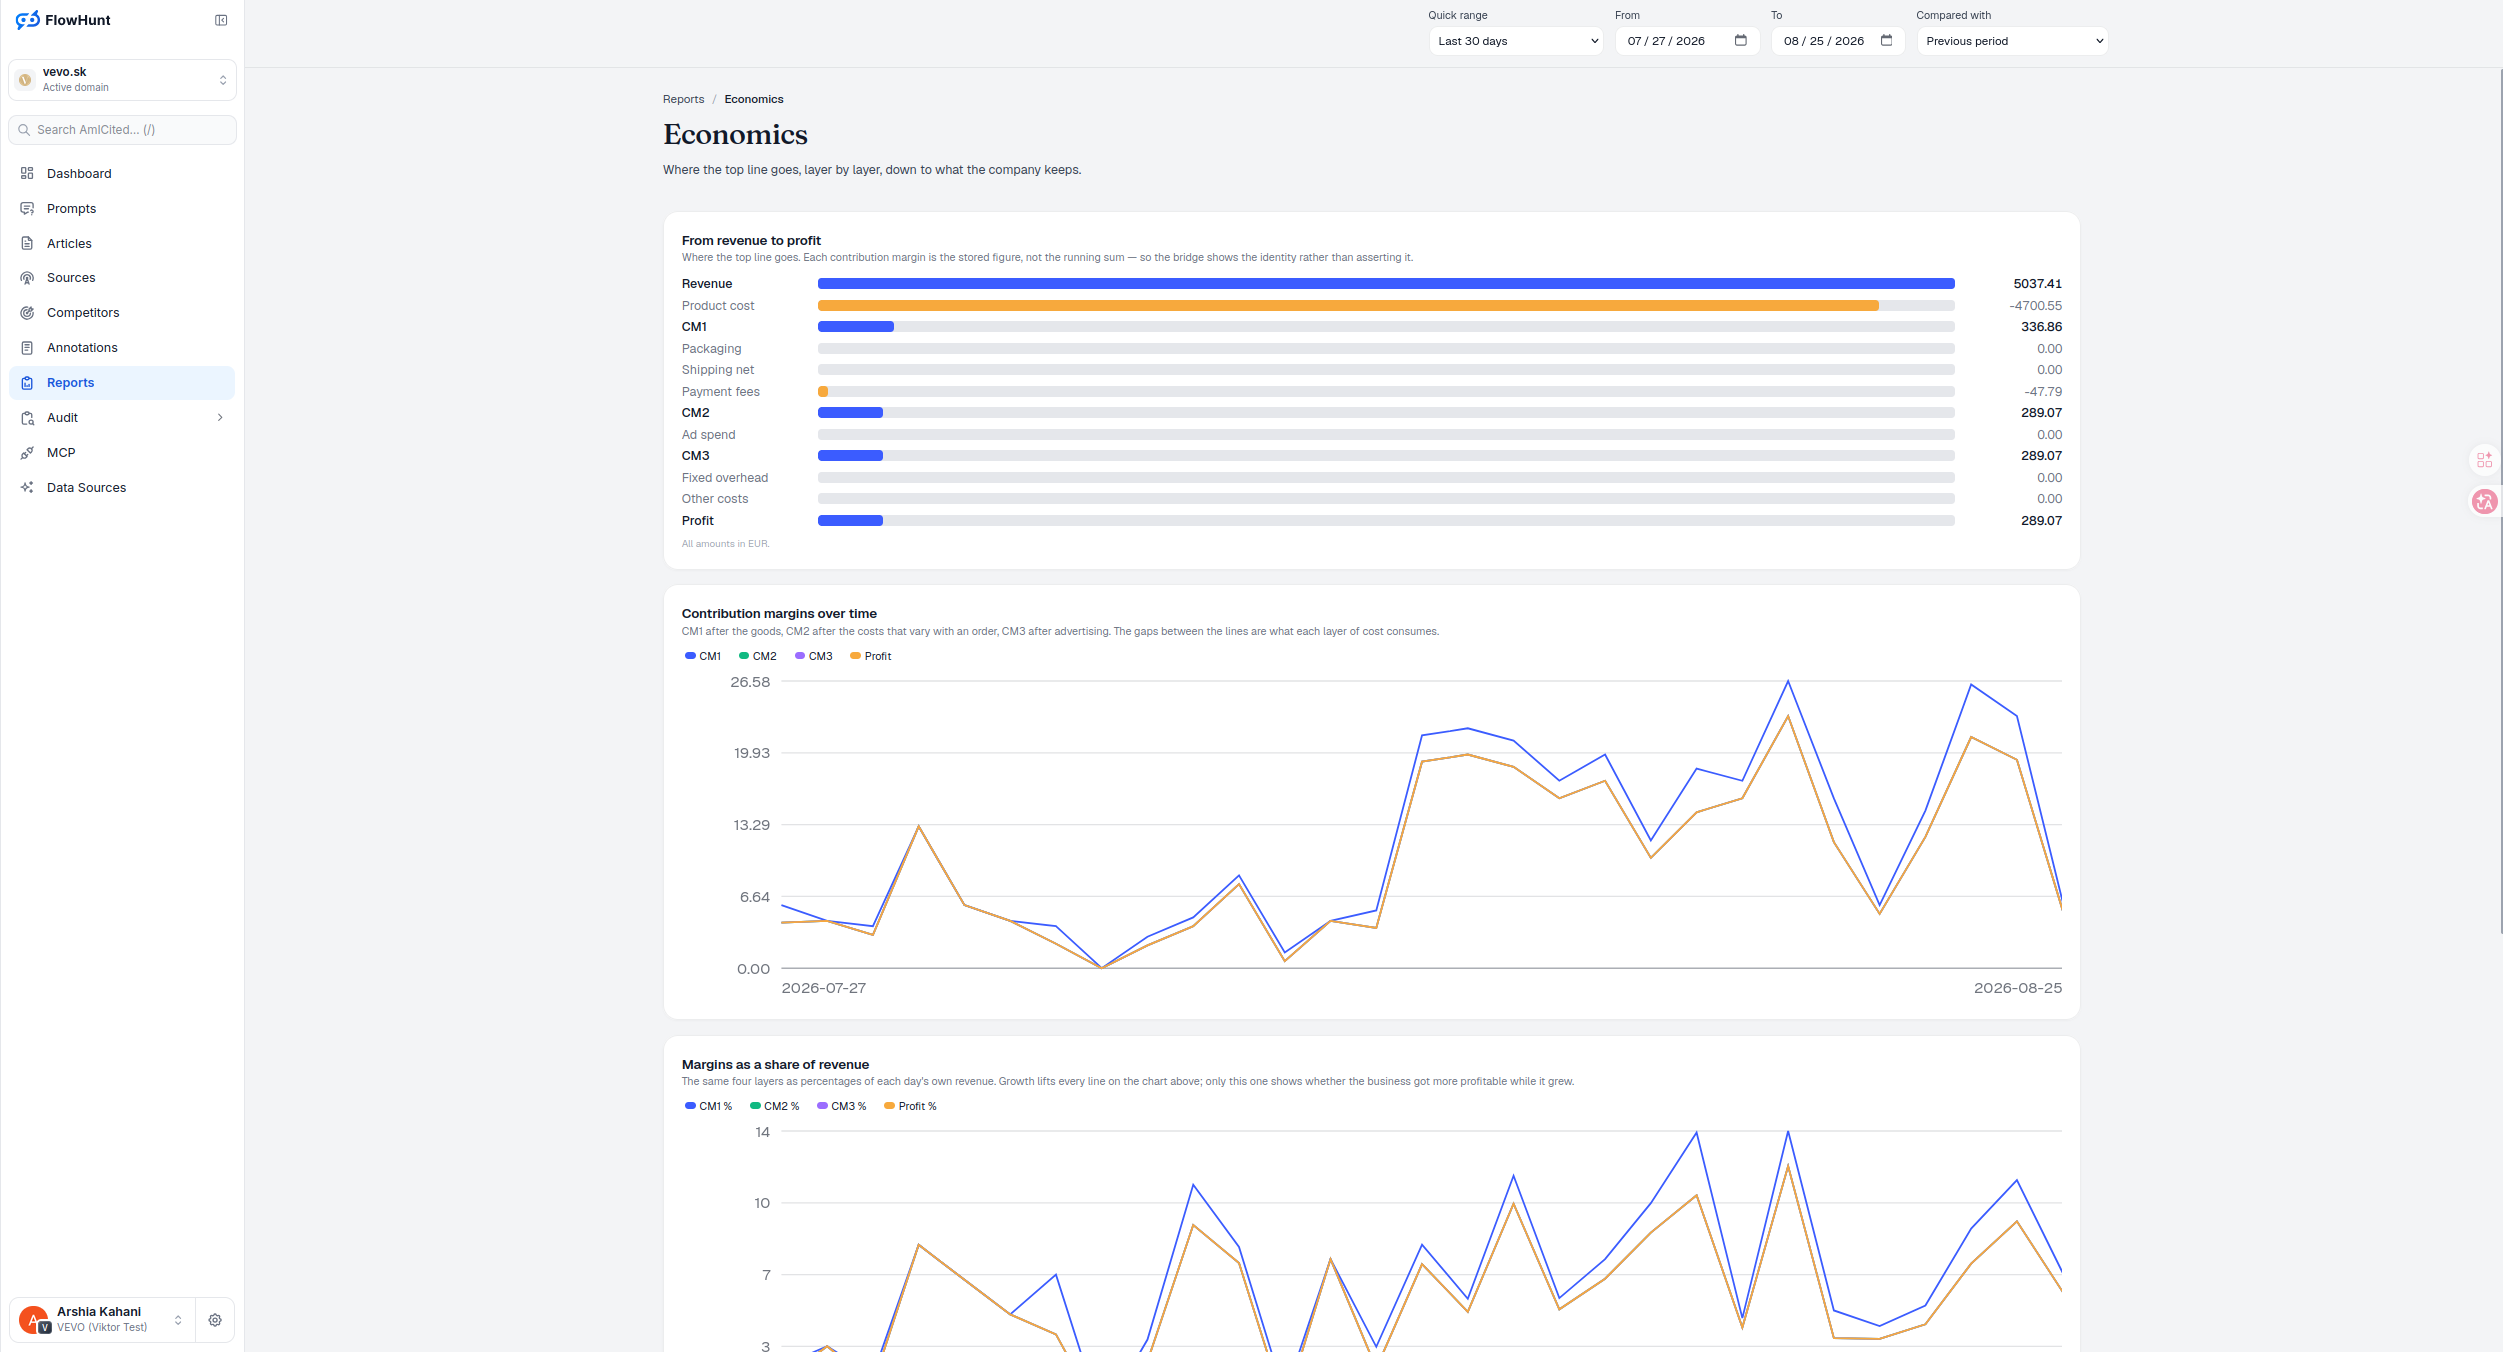
Economics is a contribution margin calculator built as a bridge: revenue down to profit through three margins — CM1 after the cost of goods, CM2 after the costs that vary with an order, CM3 after advertising — each one the stored figure, not a running sum, so the bridge shows the identity rather than asserting it.
CM1, CM2, and CM3 Margins
Revenue 5037.41 EUR loses 4700.55 to product cost, leaving CM1 at 336.86. CM1 loses 47.79 to payment fees (packaging and shipping net flat this window), leaving CM2 at 289.07. CM3 matches CM2 with ad spend flat, and profit matches CM3 with fixed overhead and other costs flat — each step a stored figure, not a calculation you have to trust blind.
- CM1 — after cost of goods — revenue minus product cost; the margin before any operating cost is counted.
- CM2 — after variable order costs — CM1 minus packaging, shipping net and payment fees.
- CM3 — after advertising — CM2 minus ad spend.
- Profit — after overhead — CM3 minus fixed overhead and other costs; what the company actually keeps.
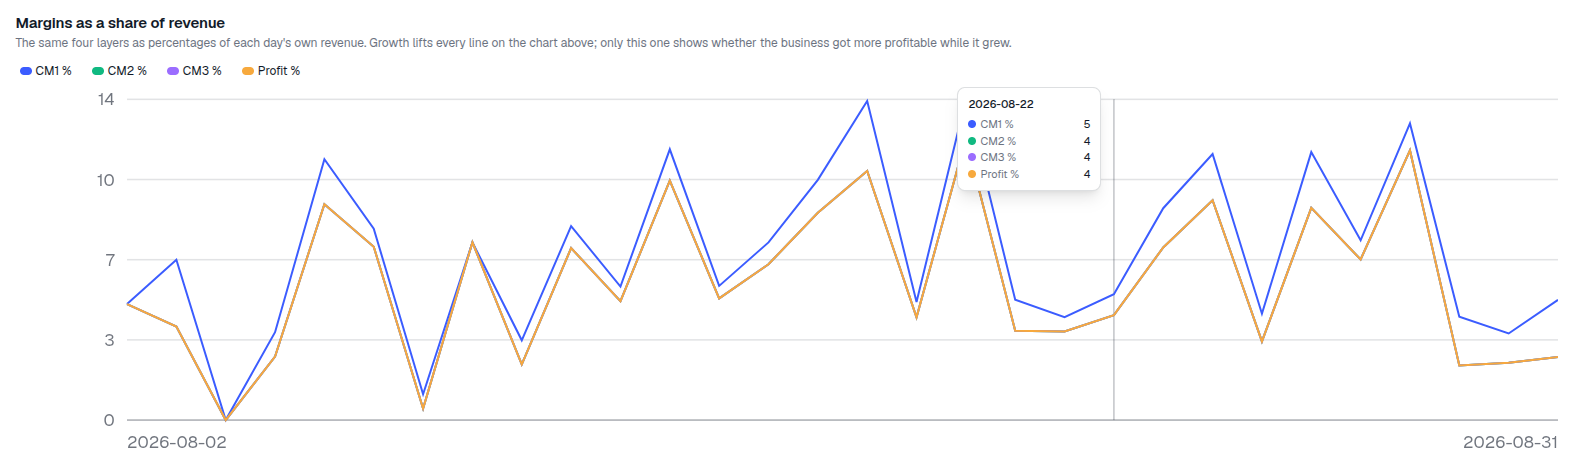
- Margins as a share of revenue — a contribution margin ratio calculator for each of the four layers, since growth lifts every absolute line but only the percentage view shows whether the business got more profitable while it grew.
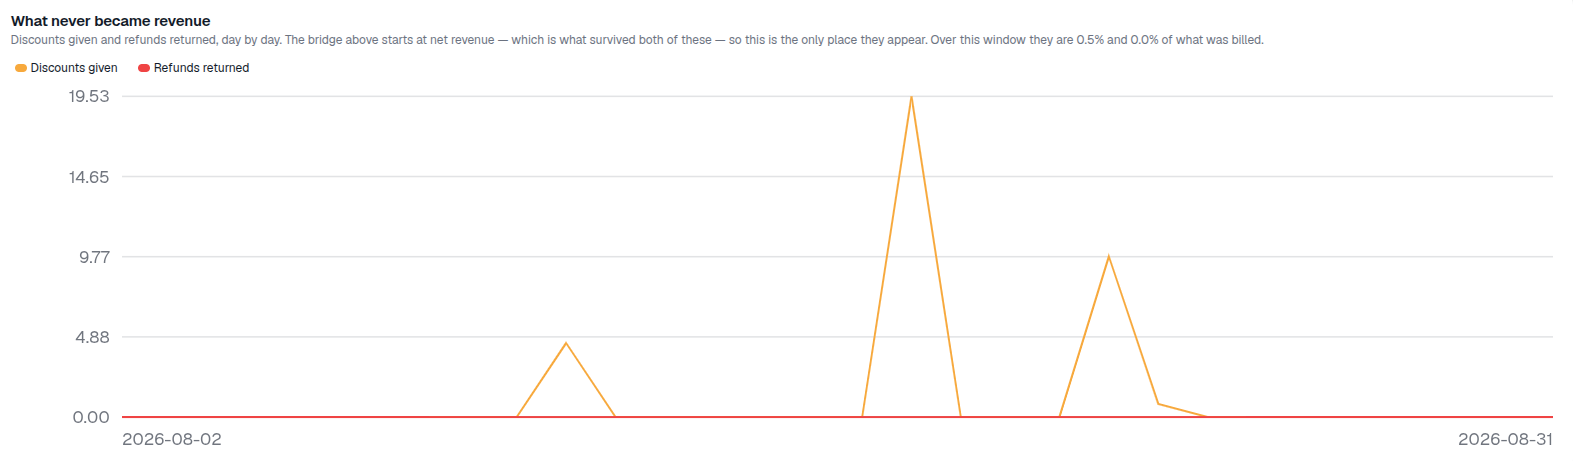
- What never became revenue — discounts and refunds, tracked separately, since the bridge starts at net revenue and this is the only place they appear.
- Checked, not just drawn — the stored margin totals are checked against the component arithmetic behind them; a mismatch produces a reconciliation notice instead of a bridge forced to balance.
Contribution Margin Trends and Rates
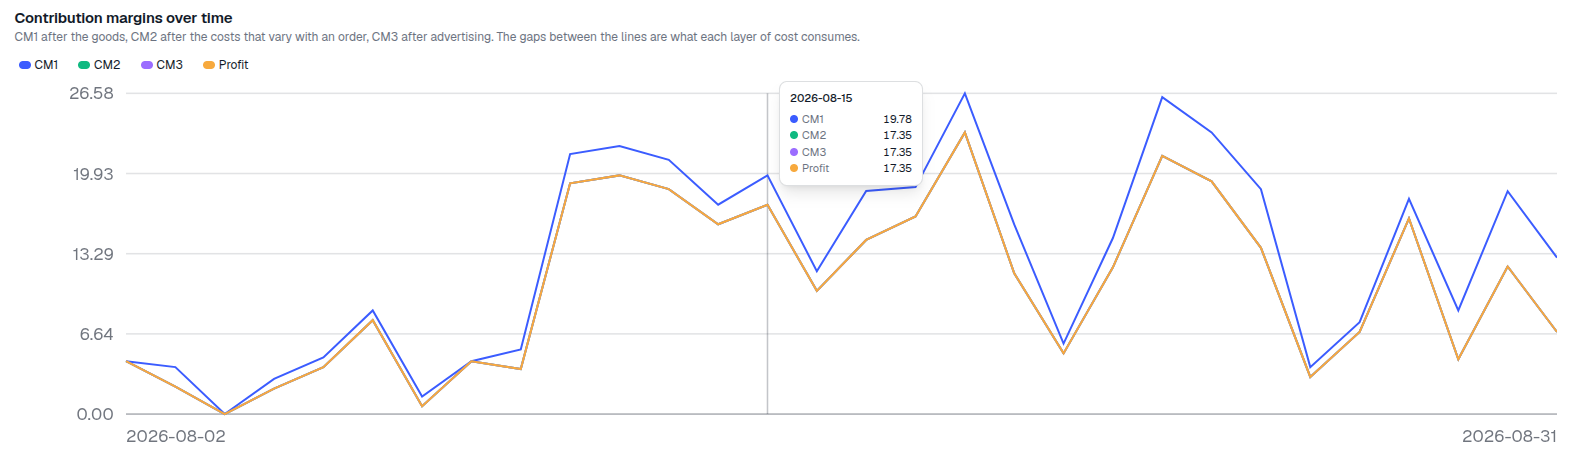
Contribution margins over time draws CM1 (blue), CM2 (green), CM3 (purple) and Profit (orange) day by day in EUR — the gaps between the lines are what each layer of cost consumes. Margins as a share of revenue redraws the same four as percentages of that day’s own revenue, so growth and profitability can be told apart.
- CM1, CM2, CM3, Profit — the same four series, absolute EUR on one chart, percent of revenue on the other.
- Gaps as cost — the space between any two lines on the EUR chart is exactly what that layer of cost consumed that day.
- Percent view isolates profitability — the only place growth and margin improvement don’t get conflated.
- Read the gap, not just the line — a widening CM1-to-CM2 gap points at order-variable costs, CM2-to-CM3 points at ads, CM3-to-Profit points at overhead and other costs; rising revenue with a shrinking margin percentage means the business grew and got less efficient at the same time.
Discount and Refund Trends
Discounts given (orange) and refunds returned (red), day by day. The bridge above starts at net revenue — which is what survived both of these — so this chart is the only place they show up at all.
- Discounts given — 1.1% of what was billed over this window.
- Refunds returned — 0.0% of what was billed over this window.
- Not double-counted — net revenue in the bridge already reflects both, so this is context, not a subtraction you need to do yourself.
Revenue to Profit Cost Bridge
The bridge above walks revenue down through cost of goods, per-order costs, ads and overhead as stacked steps. This view redraws the same window as deductions against a centre line — each cost pulling left in proportion to product cost, the largest single deduction, with what survived to profit pulling right. Colour marks direction here, not judgment: a flat bar means that layer took nothing this window, not that it is healthy or unhealthy.
- Product cost dominates — every other bar is sized against it, since nothing else came close this window.
- Flat is not the same as good — packaging, shipping, ad spend, fixed overhead and other costs were all zero this window; that is a fact about this window, not a permanent state.
- Profit is what is left, not a fourth cost — it pulls the opposite direction from every deduction, because it is what survived them.
- Meta relationship — Profit-true ROAS divides realized revenue, CM2 and CM3 by filtered Meta spend; this Economics bridge remains the shop-wide source of what those contribution layers mean.
margins in the bridge: CM1, CM2, CM3, Profit
Each contribution margin is the stored figure, not the running sum — so the bridge shows the identity rather than asserting it.
See Cost mixAnalyze Ecommerce Contribution Margins
A revenue-to-profit bridge through CM1, CM2 and CM3, plus margin trends, margin share of revenue, and what never became revenue.
Ready to see where your revenue actually goes?
Free check · 7-day trial · card required