


Product Purchase Cost Tracking
Purchase costs is where product cost of goods is entered, product by product — the purchase cost tracking behind every margin figure downstream. Products with no cost on record fall back to the assumed margin from Cost Inputs, so this is the page that closes that gap.
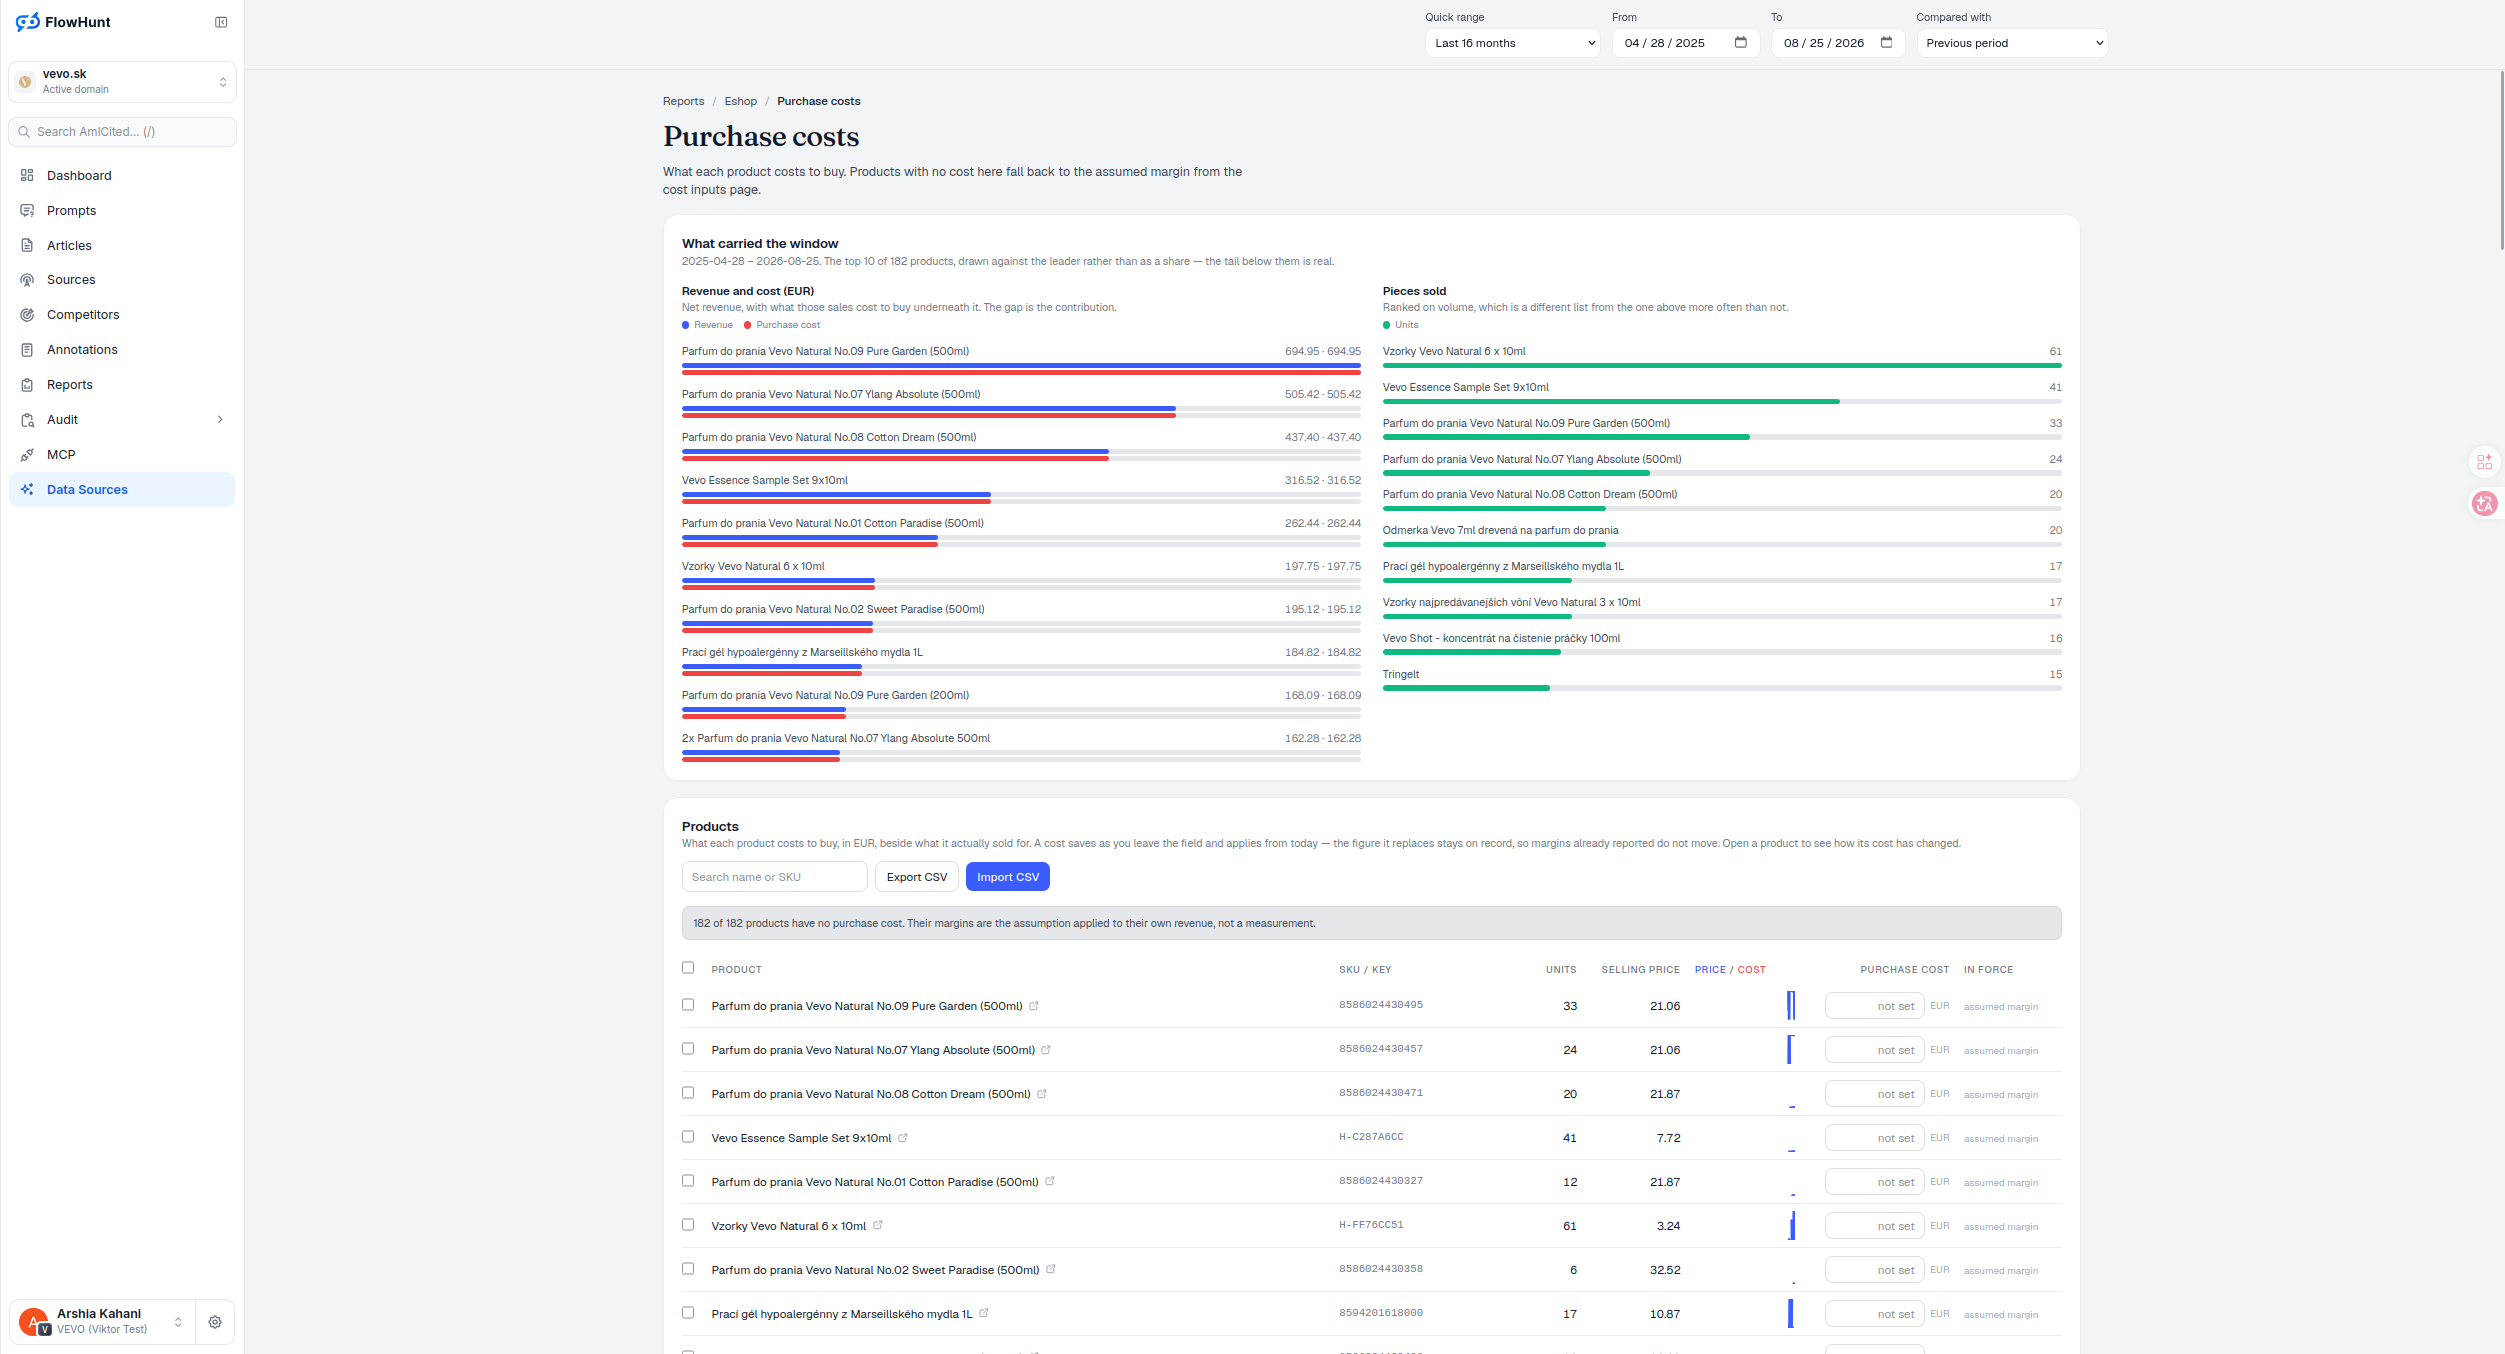
Relative Product Cost Rankings
The summary charts plot the top 10 of 182 products against the leading product rather than as a percentage of the whole — because the tail below the top 10 is real, and a share-of-total chart would erase it. Revenue and purchase cost run side by side so the gap between them — the contribution — is visible at a glance, alongside a separate ranking by units sold, which is a different list more often than not.
- Revenue vs purchase cost, top 10 of 182 — plotted against the leader, not as a share, so the tail below the top 10 stays visible as real.
- The gap is the contribution — revenue and purchase cost drawn side by side make the margin per product visible without doing the subtraction yourself.
- Pieces sold, ranked separately — a volume ranking that is a different list from the revenue ranking more often than not.
- Saves on blur, applies from today — a purchase cost saves as you leave the field and applies from today; the figure it replaces stays on record, so margins already reported don’t move.
- Closes the gap Data health flags — a product missing a purchase cost is exactly what this page is for; set it here and the fallback to assumed margin goes away.
Product Revenue Cost and Unit Trends
The Revenue and cost panel draws revenue in blue against purchase cost in red for the top 10 products, both on one shared linear scale capped by the largest value shown — bar length is relative to that leader, not a share of the top 10, so the gap between the two bars is the contribution. The Pieces sold panel ranks the same products on volume in green, sorted independently, and it’s a different list from the revenue ranking more often than not — a product can sell heavily without being where the money is. Products that sold nothing this window are excluded from both; the ones below the top 10 still exist, they’re just off the chart.
- Revenue (blue) vs Purchase cost (red) — a wide gap generally means more contribution before other costs; bars that nearly meet mean little contribution, and cost above revenue is negative product-level contribution.
- Pieces sold (green) — ranked on volume, a different list from revenue more often than not.
- Top 10 of 182 — drawn against the leader rather than as a share, so the tail below it stays real instead of vanishing into rounding.
- Prioritise by what’s unmeasured — a high-revenue or high-volume product with no recorded cost is running on the assumed-margin fallback, not evidence; those are the ones worth fixing first.
Effective-Dated Product Cost Updates
The Products table lists every product sold in the window plus current catalogue listings, with a product link, SKU or fallback key, units sold, achieved unit price, a daily price-versus-cost sparkline, and an editable purchase cost. That sparkline plots each calendar day, achieved price in accent against purchase cost in red, both on a shared y-scale from the lowest to the highest known value rather than zero — so the gap between the lines is comparable and real variation is visible. Missing days show as gaps; cost stays flat through its effective period, while price only appears on days something actually sold. Type a number and leave the field — comma decimals are accepted, it saves on blur or Enter and applies from today forward; blank, non-numeric or negative input reverts, and zero is a valid cost. There’s no table-level Save. Until a real cost is set, ‘In force’ reads ‘assumed margin’, the same fallback figure from Cost Inputs.
- Search, Export, Import CSV — search matches name, SKU or key case-insensitively; export gets the full history as product-costs.csv, import replaces the whole domain cost table atomically against the header product_key, effective_from, effective_to, unit_cost, cost_source.
- Bulk costing — tick the visible rows you want and set a positive percentage of each product’s own achieved selling price, defaulting to 60%; products with no sale in the window are disclosed and skipped rather than silently zeroed.
- Price/cost bar — a visual read on margin health per product, at a glance.
- In force — shows ‘assumed margin’ until a real purchase cost is set, so it’s always clear which figures are fact and which are placeholders.
- Saves as you leave the field, from today only — the prior figure stays on record, so a correction never moves a margin already reported. If every row is missing a SKU, the page explains that matching fell back to EAN or a hash of the product name — a sign the catalogue’s import codes need filling in.
products, each with its own purchase cost or an assumed margin fallback
Every product without a purchase cost on record falls back to the assumed margin set on Cost Inputs — flagged as an assumption, not reported as fact, until a real cost is entered here.
See Order StatusesTrack Actual Product Purchase Costs
Purchase cost beside selling price for every product, saved from today forward without rewriting margins already reported.
Ready to see what your products actually cost?
Free check · 7-day trial · card required