


Market Profitability by Country and Region
Geo Profitability takes the same choropleth as Geography but shades it by contribution first — because a market can sell well and keep little, or sell modestly and keep most of it, and revenue alone won’t show which is which.
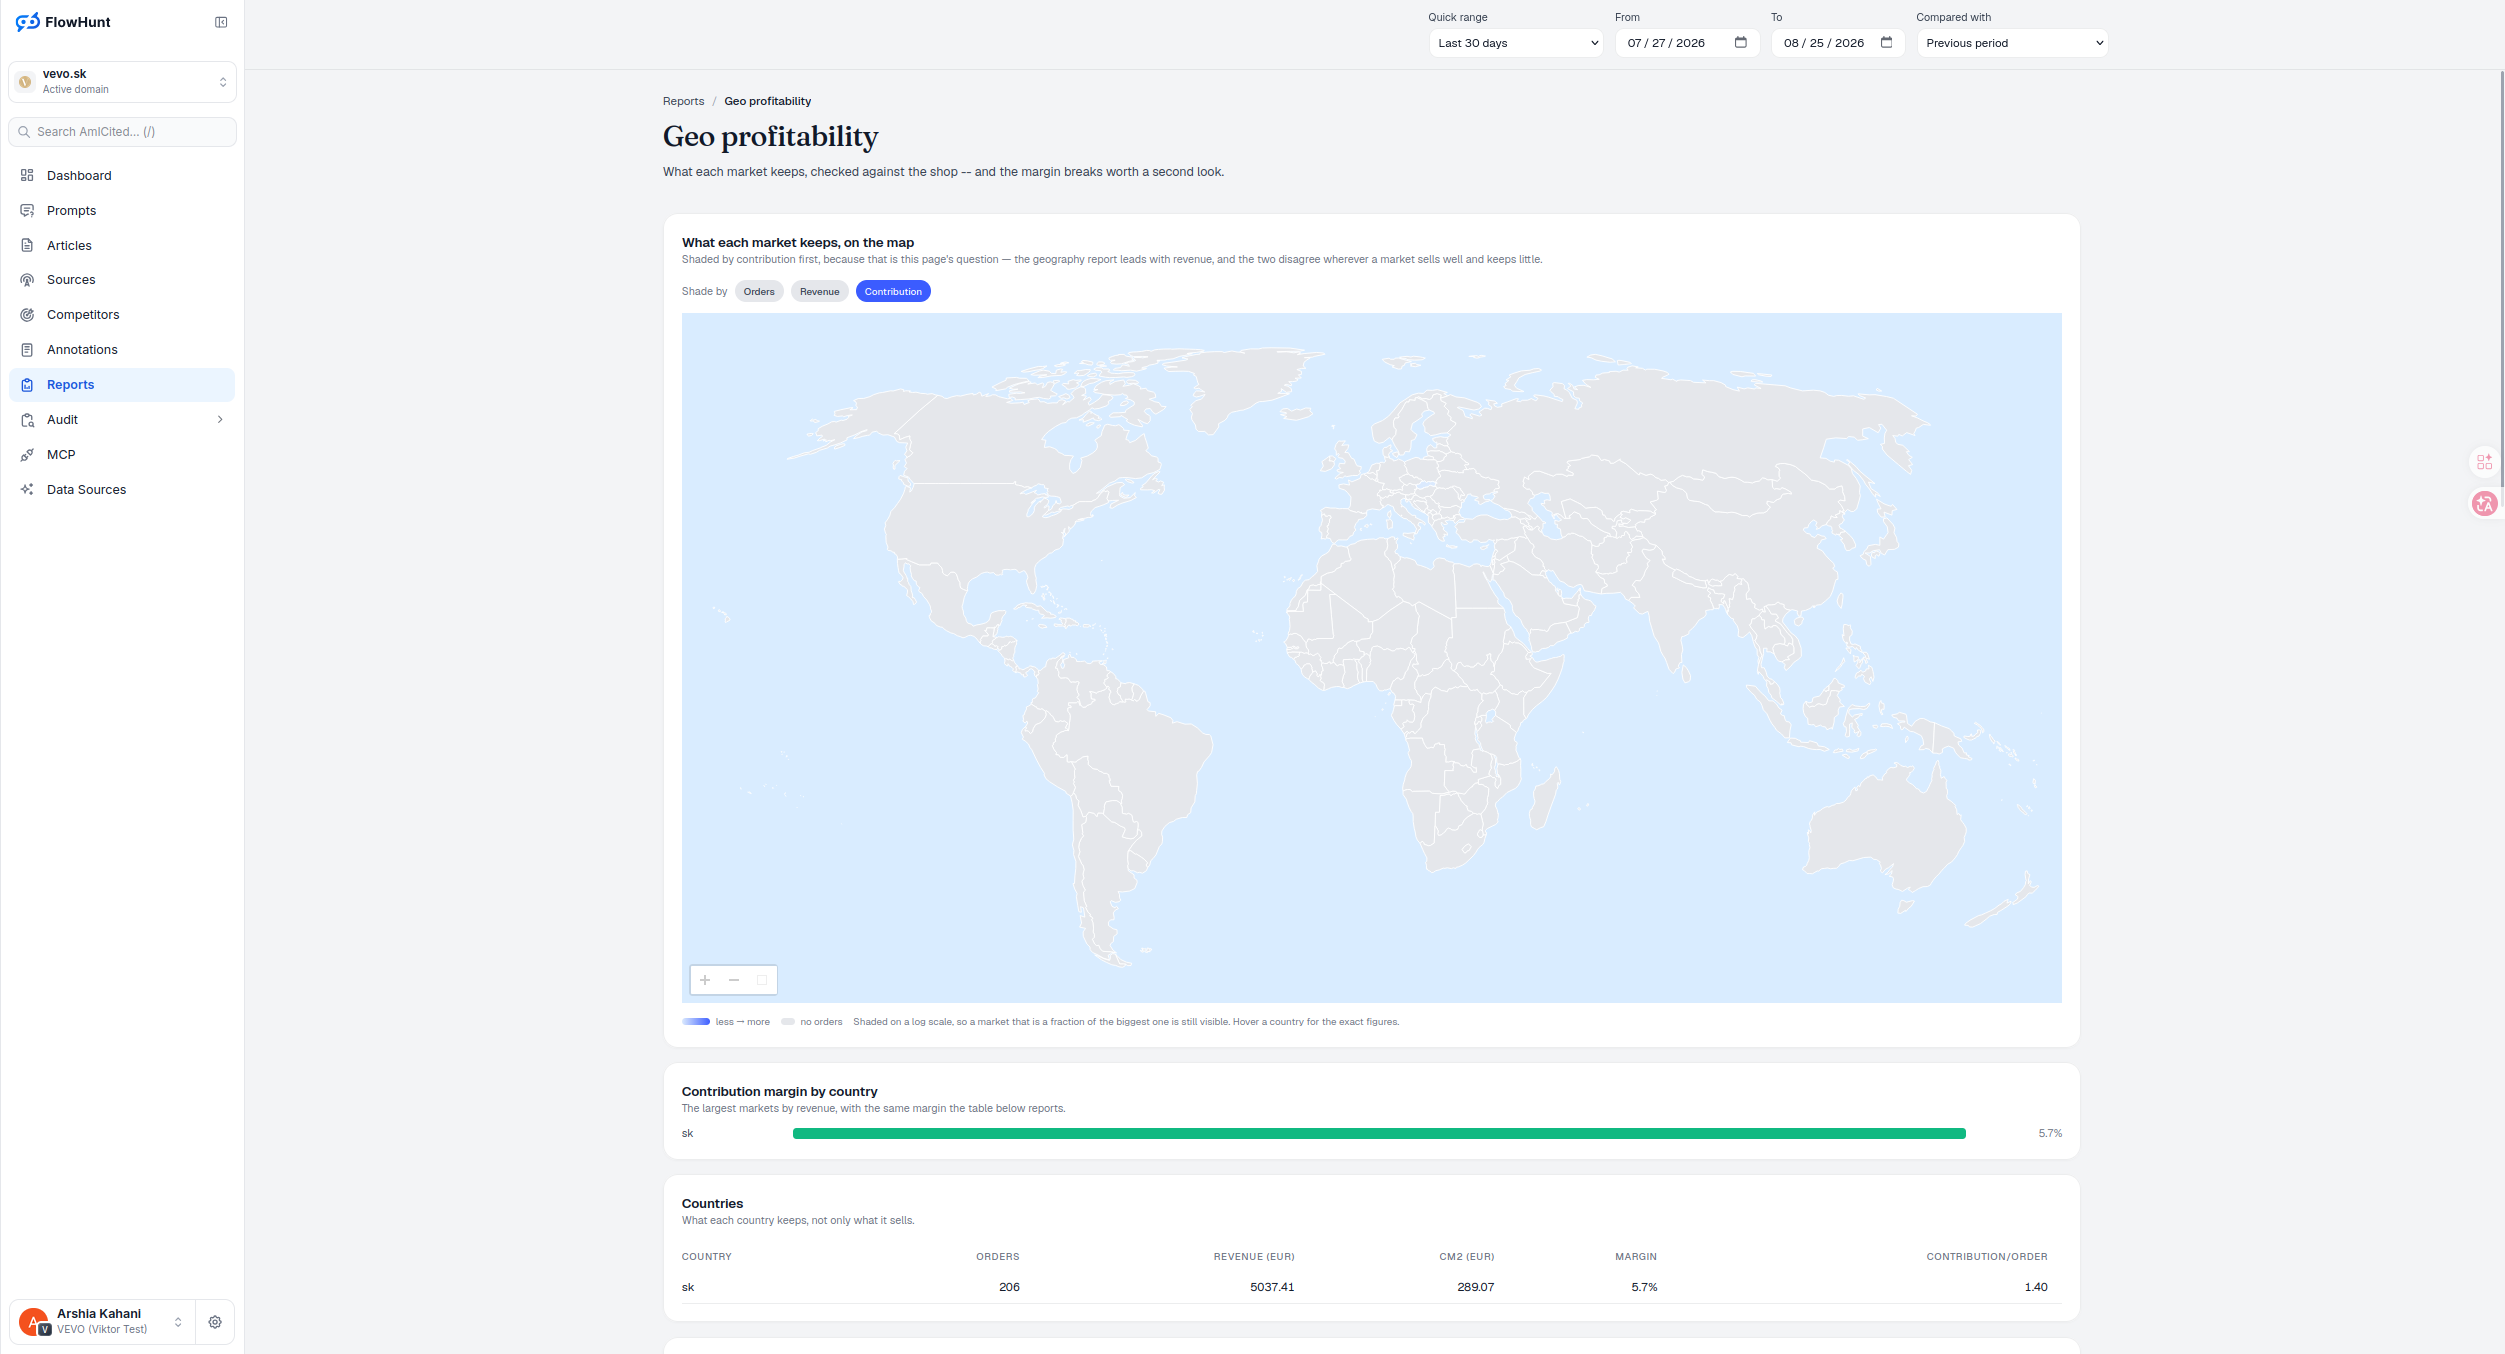
Contribution-Based Market Profitability
Geography leads with revenue; this report leads with contribution, because that is its question. The two disagree wherever a market sells well and keeps little — the map makes that disagreement visible before a single row is read, the fastest way to see which markets are profitable.
- Shade by Orders, Revenue or Contribution — the same three options as Geography, but Contribution is the default here.
- Same map, different question — Geography asks where revenue comes from; this report asks what each market keeps.
- Contribution margin by country, charted — a bar chart of the largest markets by revenue, with margin shown alongside.
- Countries table swaps the columns that matter — CM2 and contribution per order replace AOV and cost per order.
- Large and unprofitable, or small and efficient — the map and table together show which markets are which.
Market Contribution Map
Shaded by contribution first, because that is this page’s question — the geography report leads with revenue, and the two disagree wherever a market sells well and keeps little. Country shade runs on a logarithmic relative scale, not a straight linear one, so a market a fraction the size of the biggest one is still visible instead of fading to nothing; grey means no orders. Only markets that clear the order-confidence floor enter the map at all — the full country table below has no such floor. Right now that’s one market: sk, 206 orders, 5,037.41 EUR revenue, 289.07 EUR CM2, a 5.7% margin. Hover any shaded country for its exact orders, revenue and contribution.
- Contribution first — because that is this page’s question; Geography leads with revenue instead.
- Log scale, not linear — shade runs light-to-accent on a logarithmic relative scale, so a market a fraction the size of the biggest one stays visible.
- A confidence floor for the map only — a market needs enough orders to be shaded at all; the complete country table underneath carries every market regardless.
- Exact numbers on hover — orders, revenue and contribution, precise, in every tooltip.
CM2 Market Performance Table
Contribution margin by country charts up to eight markets, sorted by net revenue — not by margin — so the bars show the biggest markets, while bar height and direction show how each one is actually doing. The Countries table reports country, orders, revenue, CM2, margin and contribution per order for every market, confident or not; a market with too few orders for a stable ratio shows “needs N orders” or an em dash instead of a number that looks precise but isn’t. Right now sk is the only row: 206 orders, 5,037.41 EUR revenue, 289.07 EUR CM2, 5.7% margin, 1.40 EUR contribution per order.
- Up to eight markets, sorted by revenue — the bar chart picks the biggest markets, not the best ones; margin is what the bar height then shows.
- Countries — country, orders, revenue (EUR), CM2 (EUR), margin, contribution per order, for every market regardless of confidence.
- Small samples are withheld, not zeroed — a market below the order floor shows “needs N orders” or an em dash rather than a misleading ratio.
- CM2 and contribution/order, not AOV and cost/order — the plain Geography report answers what a market sells; this one answers what it keeps.
Market Margin Comparison
Country and city margin charts are vertical diverging bars around a center zero line — green above for positive contribution margin, red below for negative — scaled symmetrically off the largest absolute margin on screen, with a one-percentage-point floor so a tiny value doesn’t vanish. Behind that same margin, two checks run: Consistency with Daily Totals reconciles the geo aggregation against whole-shop totals and marks each check green Matches or red Mismatch — a mismatch is a data-integrity warning, not a market judgment. Margin Breaks smooths each market’s margin over a fixed window and only alerts once it has run outside its usual corridor for the required number of consecutive days, listing the date range, corridor low/high, and Above or Below.
- Zero-centered, symmetric — green above the line for positive CM2, red below for negative, scaled to the largest absolute margin shown.
- Consistency with Daily Totals — the geo aggregation is checked against whole-shop totals; each check reads Matches or Mismatch.
- Margin Breaks need a sustained run — smoothed margin has to sit outside its usual corridor for the required number of consecutive days before an alert fires, not just one bad day.
- Reconcile before you rank — a Mismatch means the geo numbers and the daily totals disagree; fix that before comparing markets against each other.
columns swapped, one point made
AOV and cost per order become CM2 and contribution per order — the countries table here reports what a market keeps, not what it sells.
See Calendar patternsAnalyze Market Revenue and Contribution
The same map as Geography, shaded by contribution by default, backed by a margin bar chart and a countries table built around CM2.
Ready to see what each market actually keeps?
Free check · 7-day trial · card required