


Ecommerce Revenue by Country and Region
Geography breaks revenue by country and contribution down by market — a world map shaded by orders, revenue or contribution, a countries table and a top-cities table — with margin held back below 30 orders rather than guessed at from a sample too thin to trust.
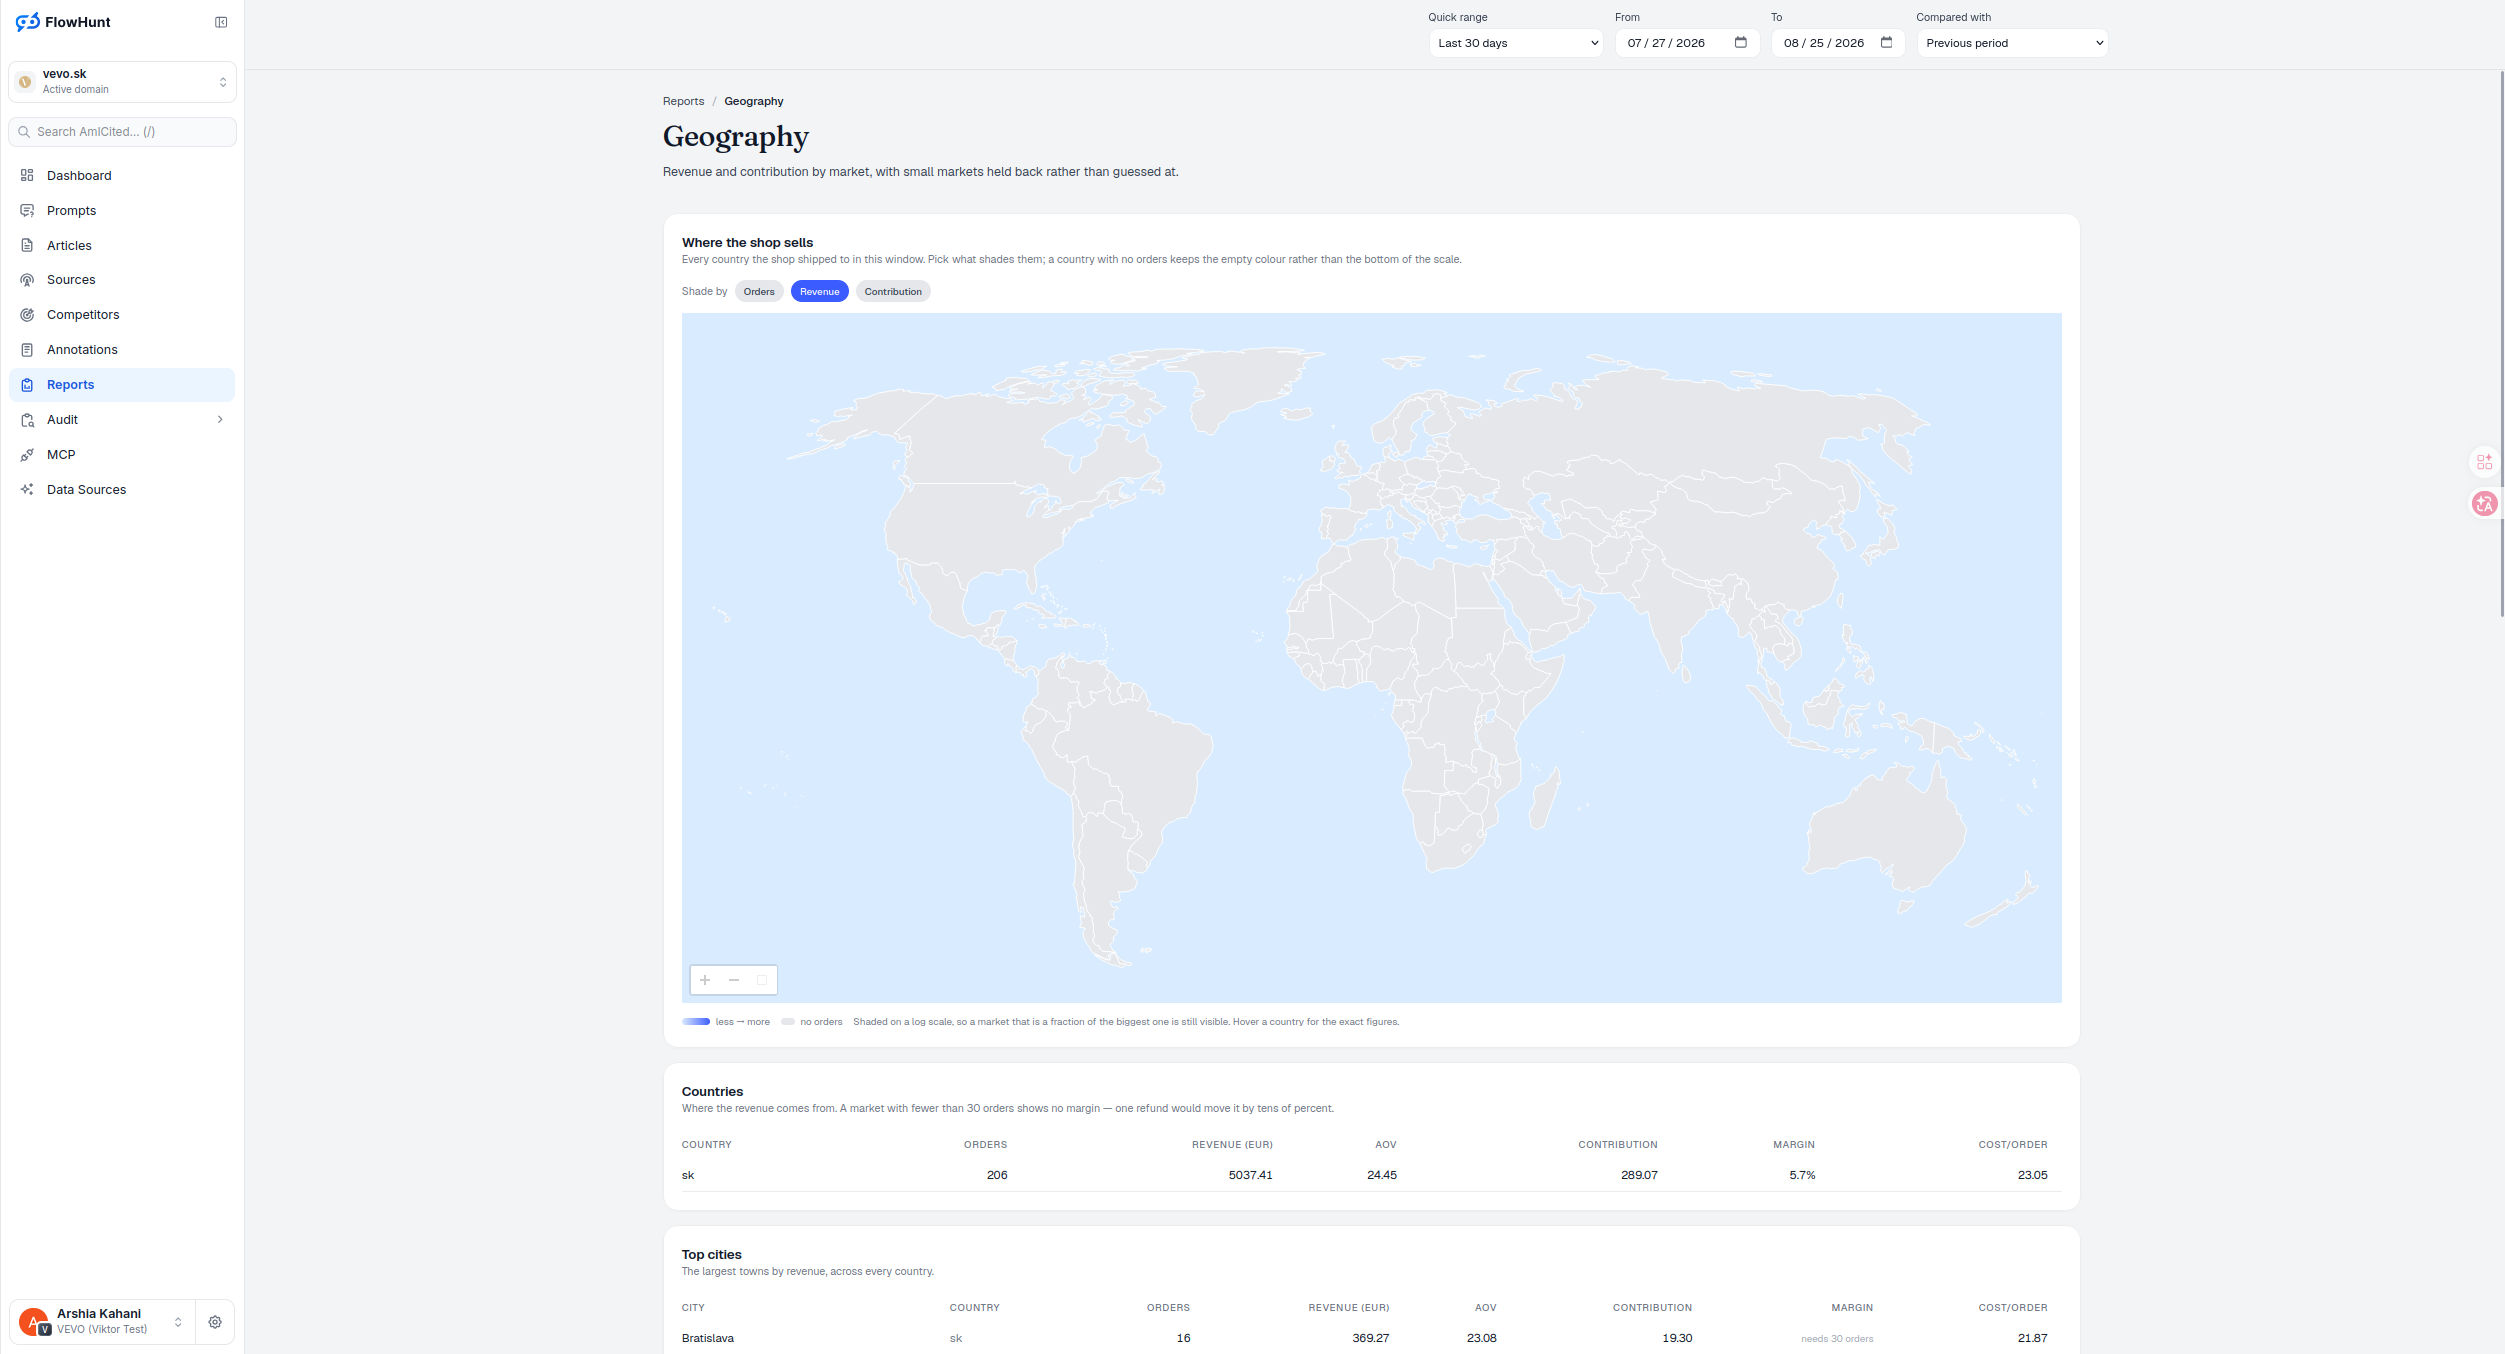
Revenue-Based Market Map
This sales by region dashboard opens shaded by revenue — Orders and Contribution are one click away. Shading runs on a log scale, so a market that is a fraction of the biggest one is still visible instead of flattening into the bottom of a linear one. Only countries with a confidence flag get placed on the map at all; a country with a code the map can’t resolve is skipped there and counted in a note, but still keeps its row in the table below. Hover any country for the exact figures behind its shade.
- Shade by Orders, Revenue or Contribution — three lenses on the same map; Revenue is the default.
- Log-scaled choropleth — a market a fraction of the size of the biggest one stays visible instead of disappearing into the bottom of the scale.
- No orders, no colour — a country the shop never shipped to keeps the empty shade rather than reading as the bottom of the range.
- Unlocated revenue, called out — the confidence card states the amount and share of revenue that couldn’t be tied to a location, and flags it once it clears 5%.
- Countries table — country, orders, revenue, AOV, contribution, margin and cost per order, one row per market, in the order the API returns it.
- Top cities, every country — the largest towns by revenue, regardless of which country they’re in.
- 30-order margin floor — a market or city under 30 orders shows “needs 30 orders” instead of a figure one refund could move by tens of percent.
Market Map by Revenue and Contribution
Every country the shop shipped to in this window. Pick what shades them; a country with no orders keeps the empty colour rather than the bottom of the scale. Shading runs on a log scale, so a market that is a fraction of the biggest one is still visible — hover a country for the exact figures, since the scale is relative and recomputed for whatever’s on screen, not a fixed percentage you can read off the color alone. A country dark by orders but light by contribution is telling you something real: demand volume there isn’t converting into kept value at the same rate.
- Every country the shop shipped to — this window, not all-time.
- Pick the shade — Orders, Revenue or Contribution, without leaving the map.
- No orders ≠ lowest shade — an unshipped country keeps the empty colour instead of reading as the bottom of the range.
- Log scale — a market a fraction of the biggest one stays visible instead of flattening to nothing.
Country and Region Performance Tables
Countries: where the revenue comes from — a market with fewer than 30 orders shows no margin, because one refund would move it by tens of percent. Top cities: the largest towns by revenue, across every country, with the same 30-order floor applied per city.
- Countries — country, orders, revenue (EUR), AOV, contribution, margin and cost per order, one row per market.
- Top cities — city, country, orders, revenue (EUR), AOV, contribution, margin and cost per order — the largest towns by revenue across every country.
- Margin held back below 30 orders — one refund could move a thin sample by tens of percent, so the table shows “needs 30 orders” instead of a number.
- Table order is the API’s — rows aren’t re-sorted client-side, so a country with a code the map can’t place still keeps its row here.
Market Ratio Data Requirements
Positive contribution and a stronger margin are generally the healthier reading, but high revenue alone isn’t. Below the order floor, treat the ratio as unmeasured rather than zero or poor — the guardrail exists so a thin sample never gets compared like a proven one. Fix unlocated shipping data first if it’s over 5% of revenue, then wait for the floor before ranking small countries or cities against each other.
orders before a market’s margin is shown
Below that, one refund can move the figure by tens of percent — the table shows “needs 30 orders” instead of a number built to mislead.
See Geo profitabilityAnalyze Revenue and Contribution by Market
A world map shaded by orders, revenue or contribution, countries and top cities tables, and a 30-order floor before margin is shown at all.
Ready to see where your shop actually sells?
Free check · 7-day trial · card required