


Customer Lifetime Value and Payback Analysis
Lifetime Value is a customer lifetime value calculator for the ecommerce shop — what a customer is worth, how that builds after they arrive, and whether the ones you’re winning now are worth what earlier ones were — cumulative spend by cohort, by order count, and broken down by everything from first product to acquisition channel.
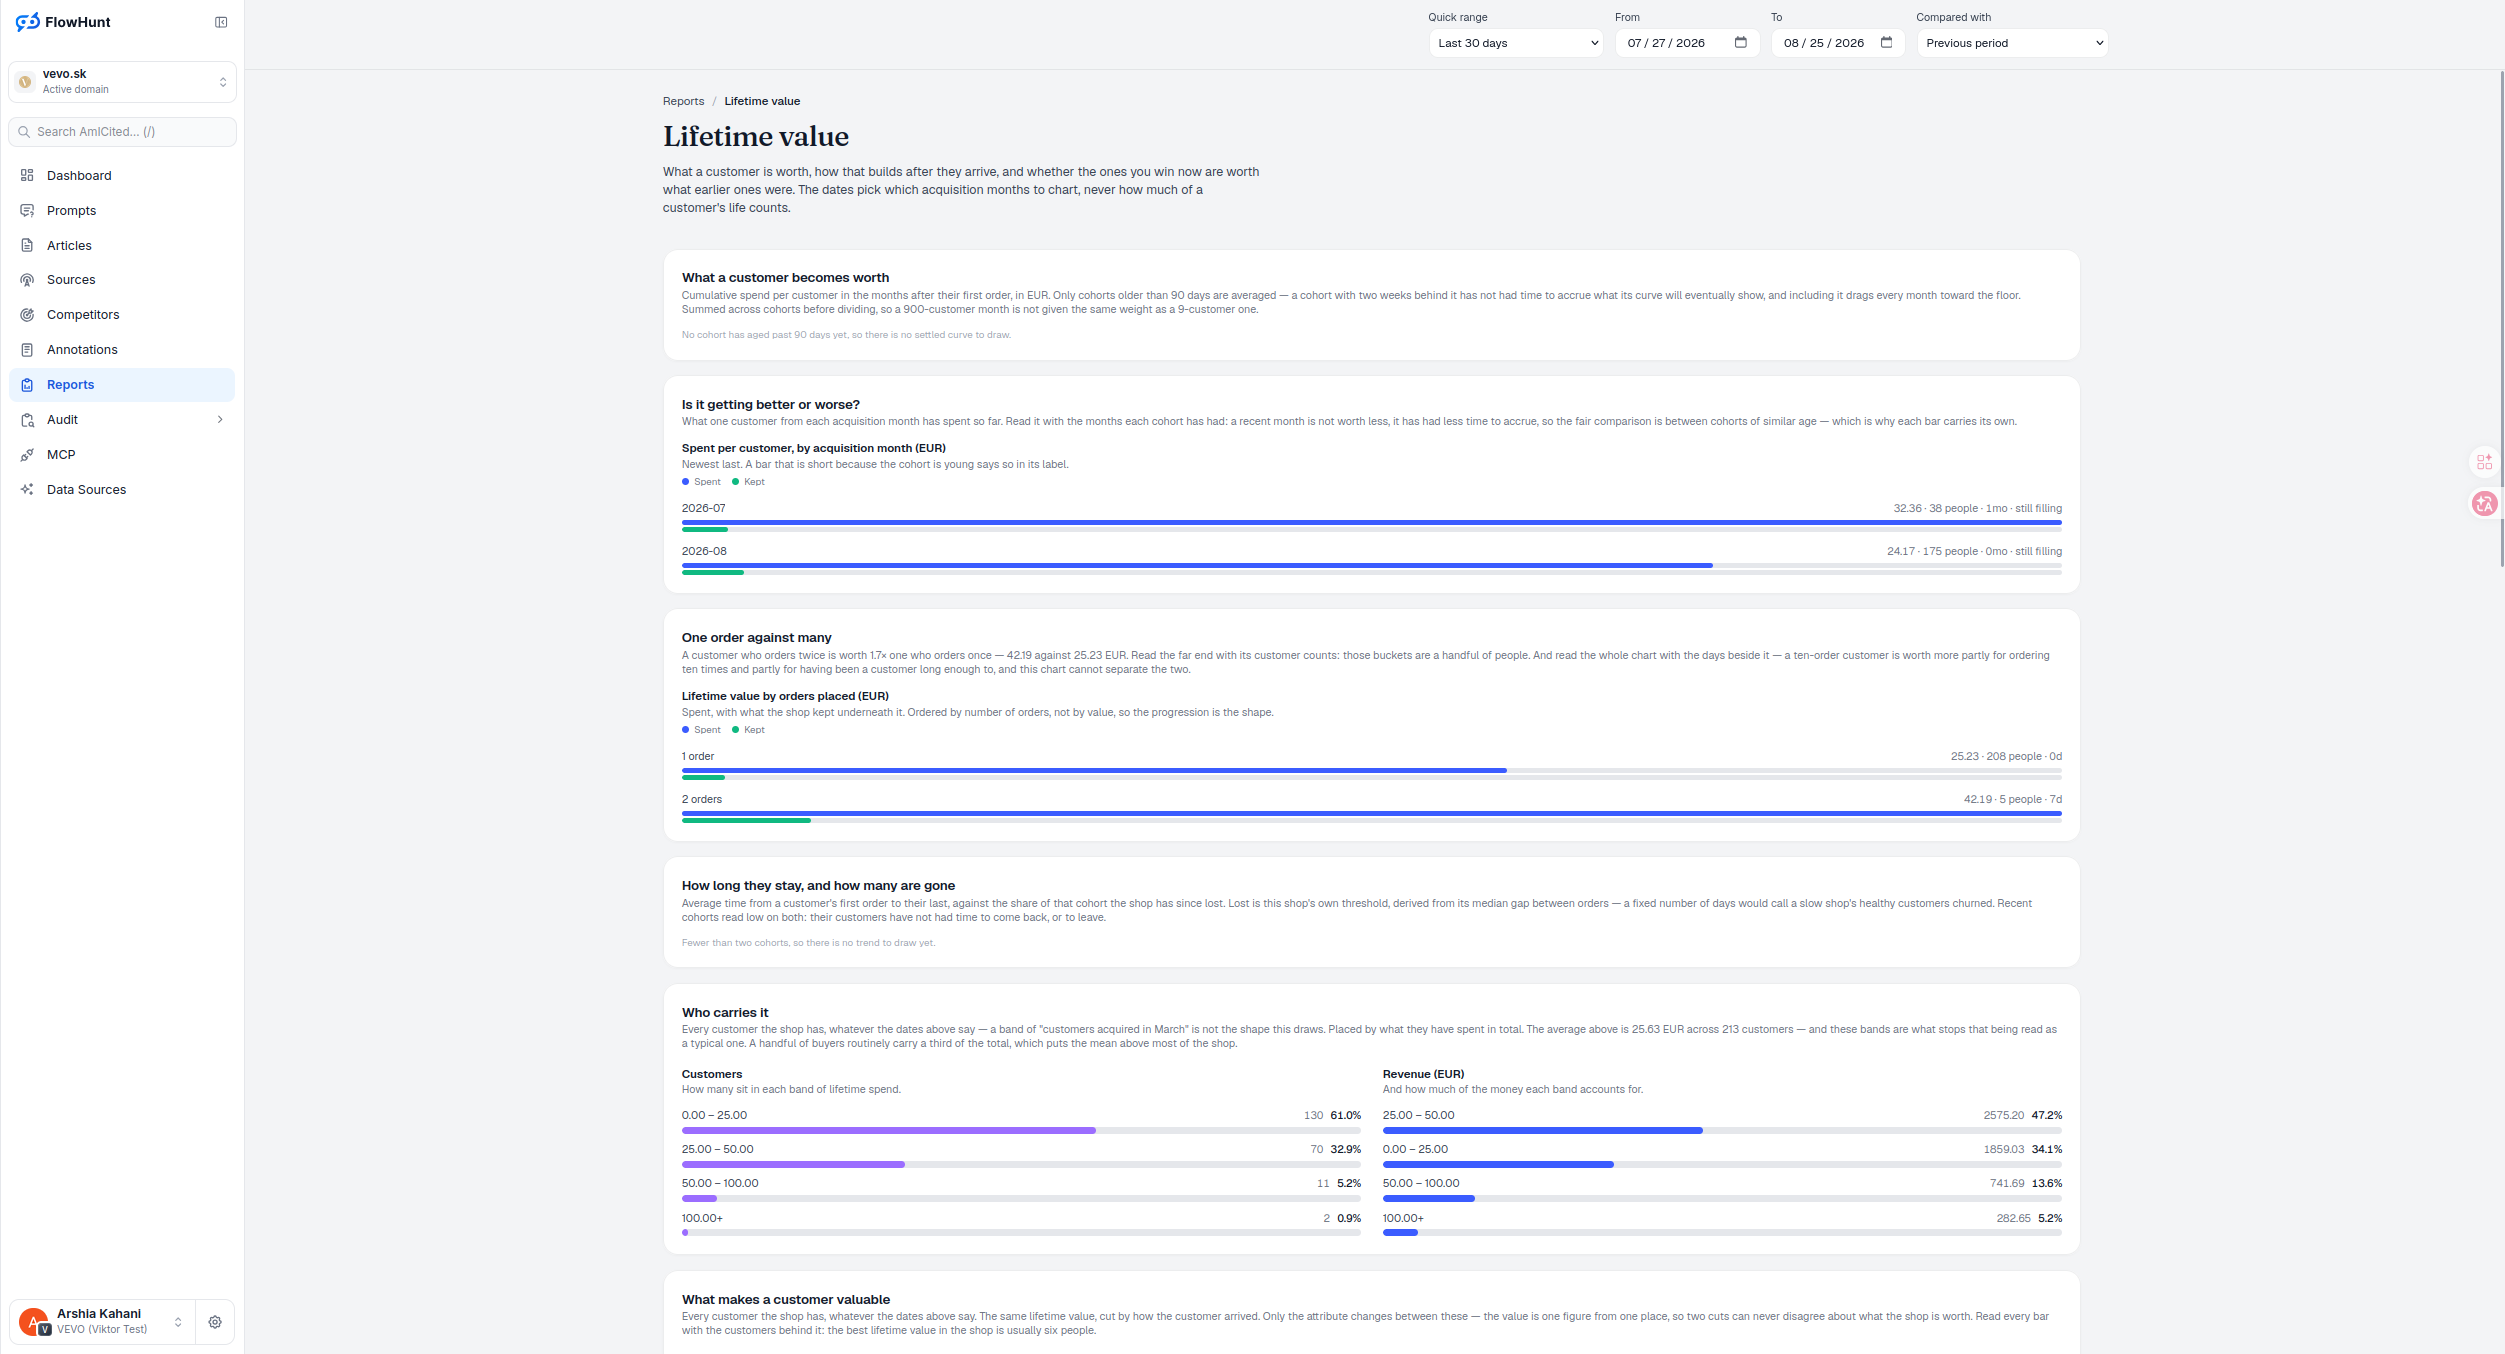
Mature Cohort Lifetime Value Curves
LTV by cohort: cumulative spend per customer in the months after their first order, in EUR — summed across cohorts before dividing, so a 900-customer month isn’t weighted the same as a 9-customer one. Only cohorts older than 90 days are averaged; a two-week-old cohort hasn’t had time to accrue what its curve will eventually show.
- What a customer becomes worth — cumulative spend per customer in the months after their first order, in EUR, only from cohorts old enough to mean something.
- 90-day floor — cohorts under 90 days are excluded from the average; including them drags every month toward the floor.
- Is it getting better or worse — what one customer from each acquisition month has spent so far, each bar carrying its own age so recent months aren’t unfairly compared.
- One order against many — a customer who orders twice is worth 1.7x one who orders once, 42.19 against 25.23 EUR.
- Later buckets describe, they don’t prove — long-tenured customers have simply had more time both to order and to accrue value; the chart can’t separate the two, so treat order-count buckets past the first step as descriptive, not causal.
- How long they stay, and how many are gone — average time from first order to last, against the share of the cohort lost, using this shop’s own median gap between orders as the churn threshold.
- Cohort payback, without extrapolation — customers, months observed, blended acquisition cost, and the month cumulative contribution covered it; cost is all-channel ad spend since individual customers aren’t attributed to a platform, and payback is never projected past what’s actually been observed.
- Who carries it — every customer placed by total spend; a handful of buyers routinely carry a third of the total, pulling the average above most of the shop.
Customer Lifespan and Churn Distribution
Average time from a customer’s first order to their last, plotted against the share of that cohort the shop has since lost. Lost is this shop’s own threshold, derived from its median gap between orders — a fixed number of days would call a slow shop’s healthy customers churned when they’re simply on a longer cycle.
Cohort Acquisition Payback Analysis
For each acquisition month, the report shows customer count, months observed, blended acquisition cost and the first observed month when cumulative contribution covered that cost. The cost remains all-channel because the shop does not identify which platform caused each customer. Use Meta New-customer CAC for a Meta-spend window ratio, or Meta Profit Scaling for marginal CAC against mature contribution LTV; neither changes this cohort table into individual attribution.
Customer Value Segmentation Dimensions
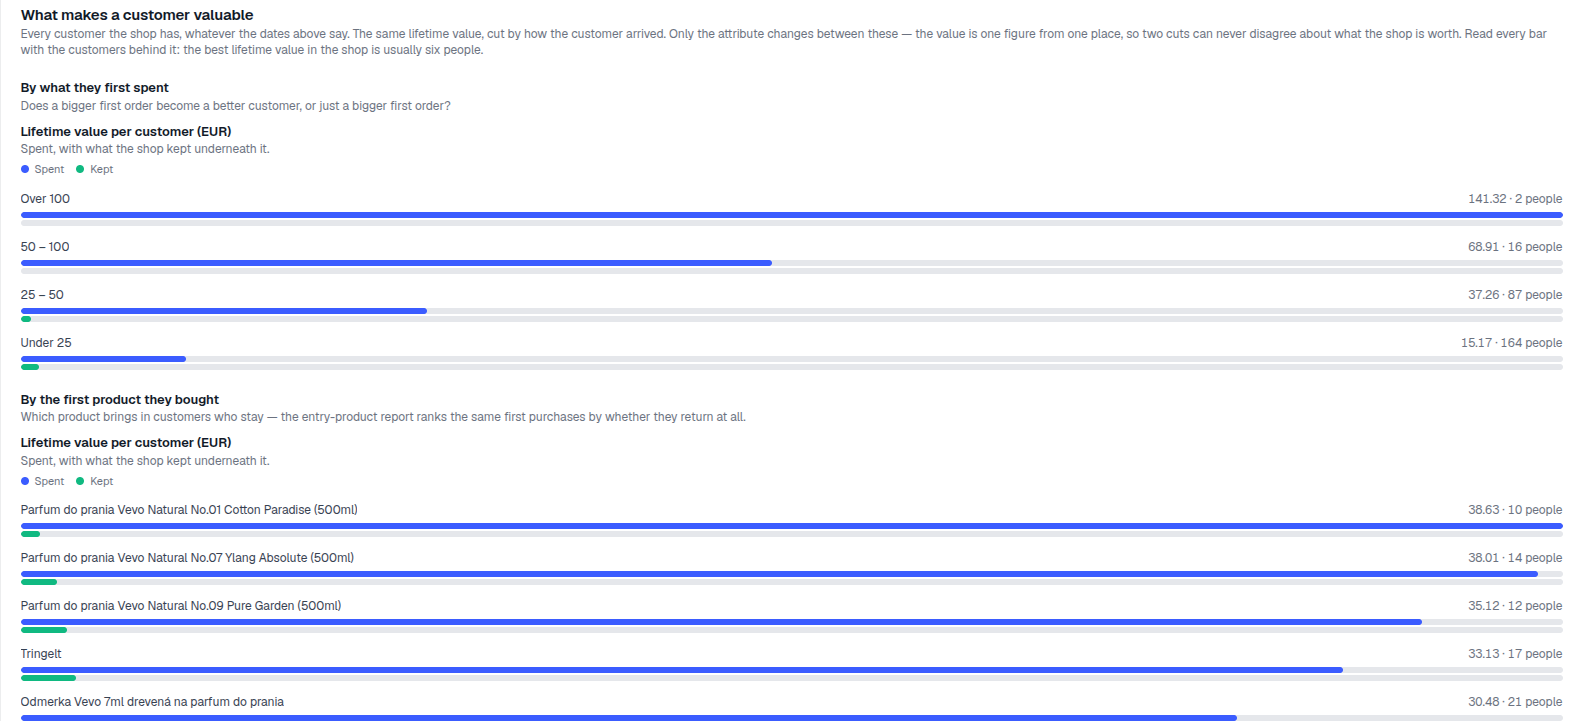
By what they first spent, the first product they bought, the category they arrived through, the brand, the market, whether they’re a company or a consumer buyer, and the channel or campaign they arrived through — every breakdown shares the same Spent (blue) / Kept (green) pattern, drawn from the same customers, so the cuts can never disagree about what the shop is worth. By first spend, customers who opened over 100 EUR average 141.32 EUR lifetime against 14.66 EUR for those who opened under 25.
what a two-order customer is worth over a one-order one
42.19 EUR against 25.23 EUR — the Lifetime value by orders placed chart orders customers by how many orders they’ve placed, not by value, so the pattern reads in the right order.
See SegmentsAnalyze Customer Lifetime Value Drivers
Cumulative value by cohort and order count, churn against tenure, and lifetime value broken down by first spend, product, category, brand, market and channel.
Ready to know what a customer is really worth?
Free check · 7-day trial · card required