


Repeat Purchase Rate and Customer Value
Repeat Purchase tracks the repeat purchase rate — how often customers come back, how long they take, and what each order is worth along the way — from same-item repurchase rate to the value of a customer’s 2nd, 3rd and 6th order.
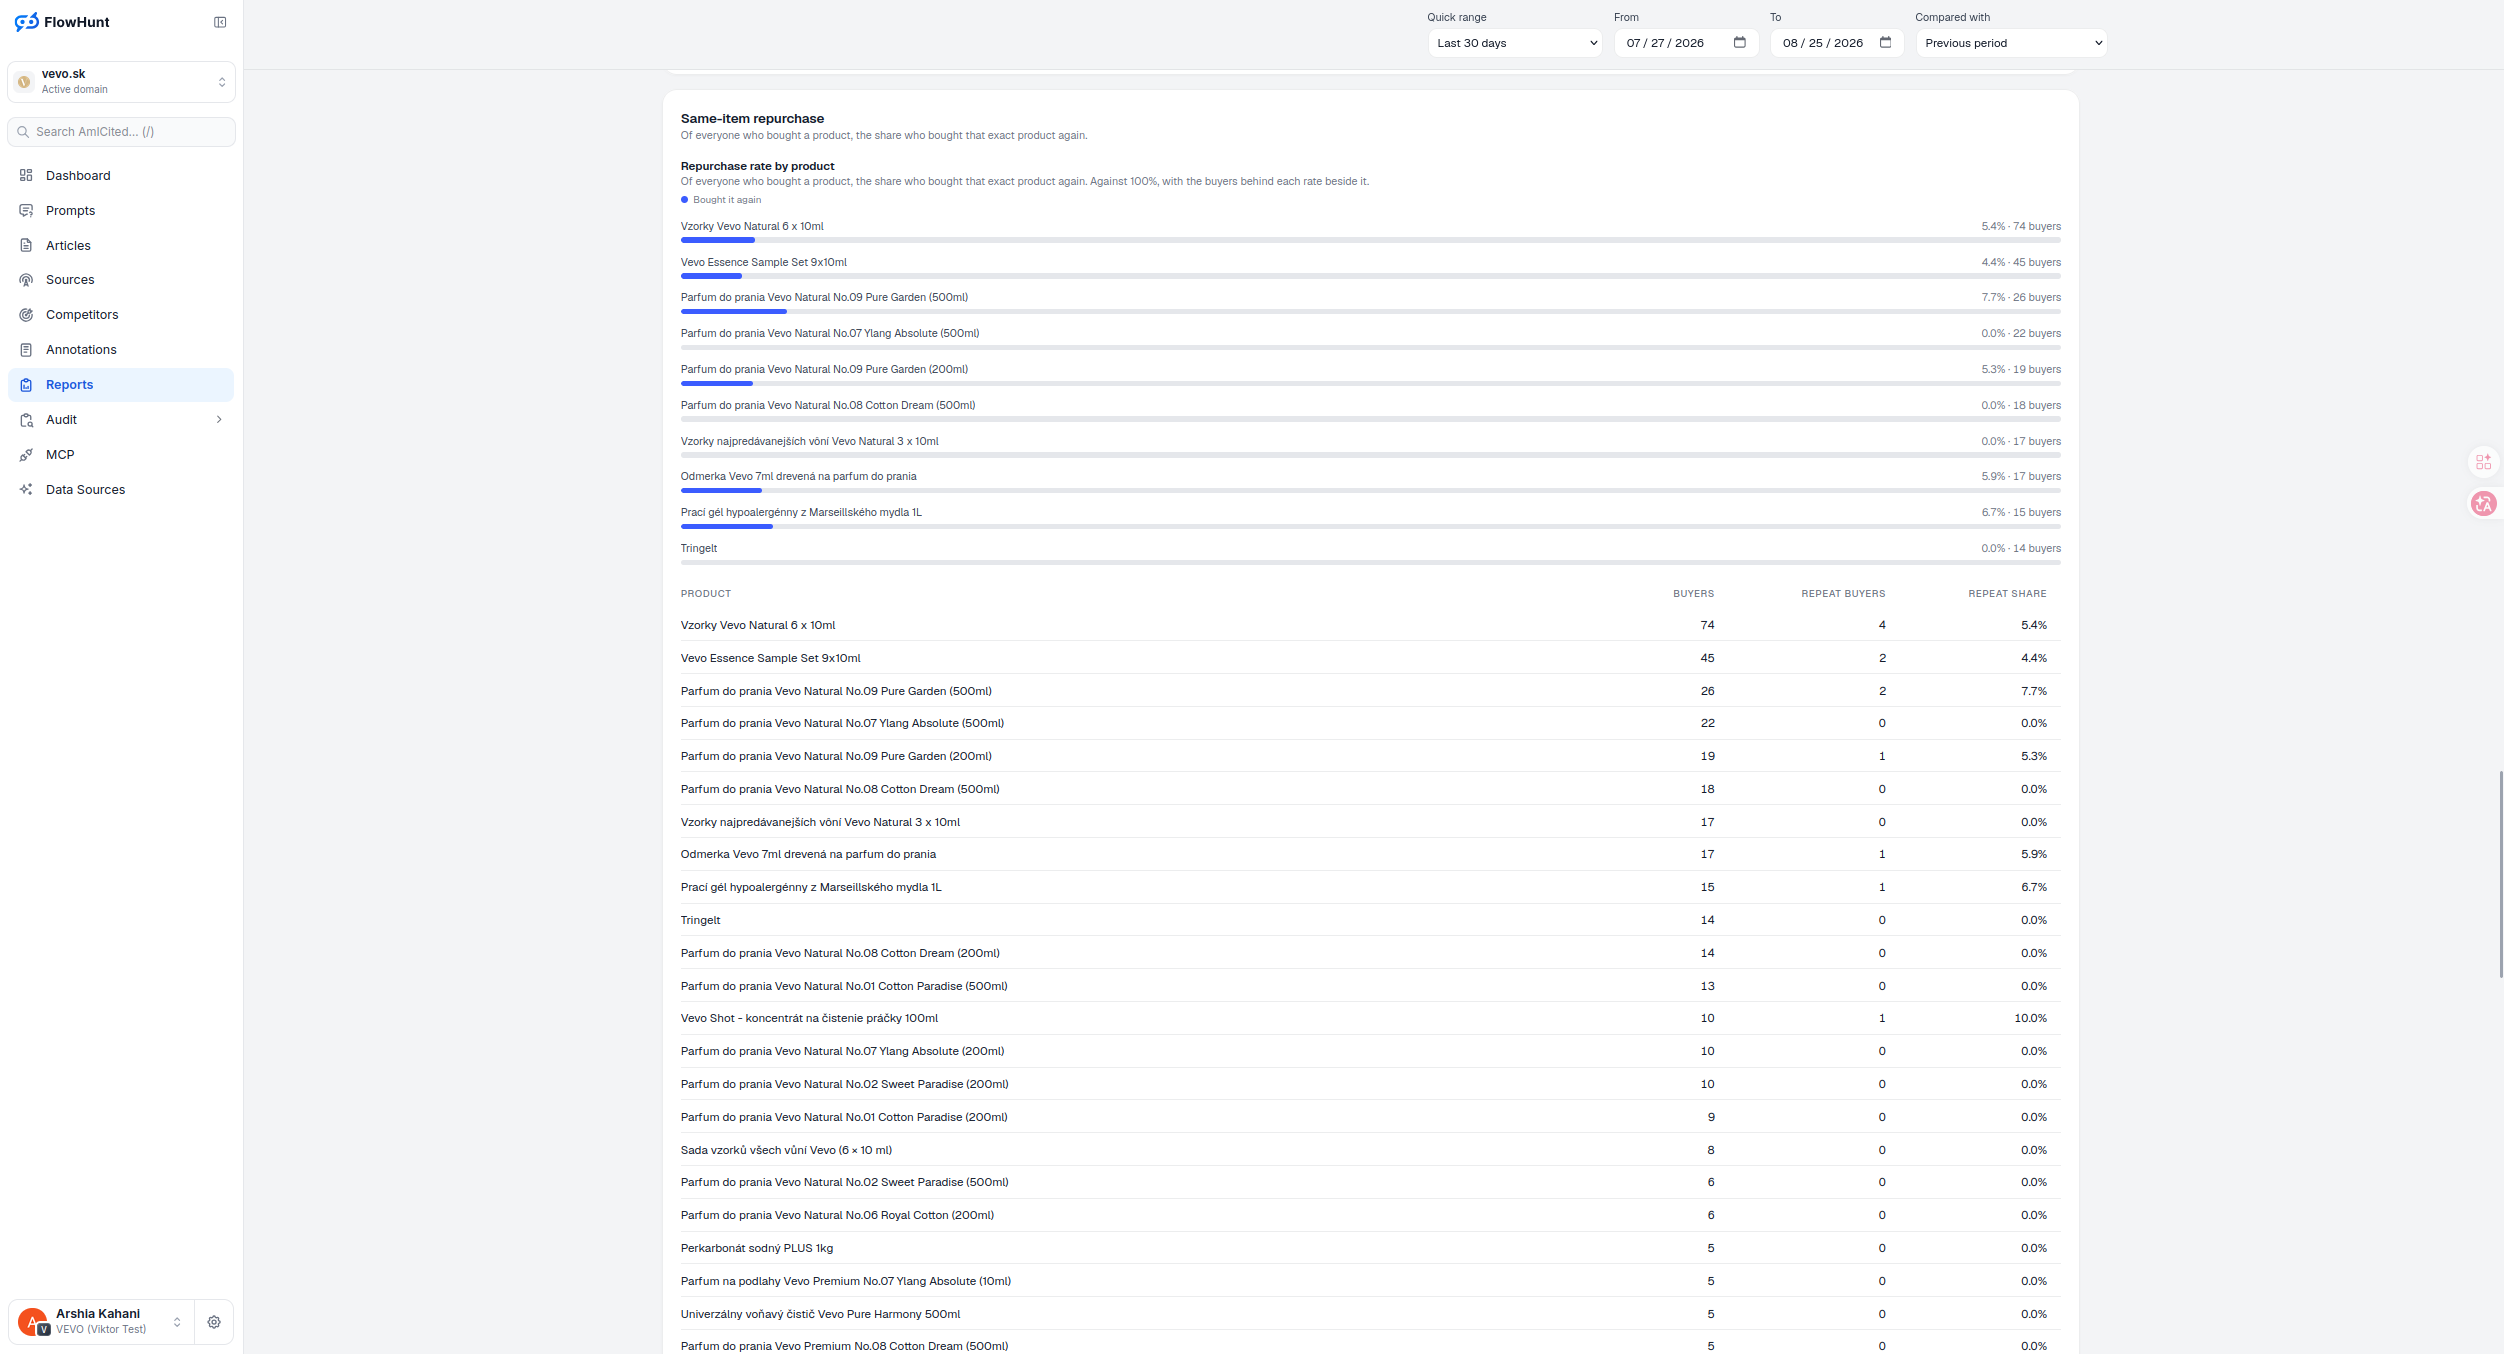
Repeat Purchase Rate Calculation
The customer repurchase rate: of everyone who bought a product, the share who bought that exact product again — plotted against 100%, with the buyers behind each rate beside it. Same logic runs through the gaps between orders and the value each position in a customer’s history carries.
- Same-item repurchase rate — of everyone who bought a product, the share who bought it again, against 100%, with buyer counts beside each rate.
- Time between orders — every gap between one order and the next, bucketed from 0-7 days to 180+, counted only when both orders fall inside the window.
- Order-to-order transitions — median and average days between order 1→2, 2→3 and beyond, by which orders in a customer’s history the pair was.
- Median is the number to plan a campaign around — when the average runs well above the median, a handful of very late returns are pulling it up, not a shift in typical behavior.
- Time to nth order — days from a customer’s first order to their 2nd through 6th, measured against the real first order even when it predates this window.
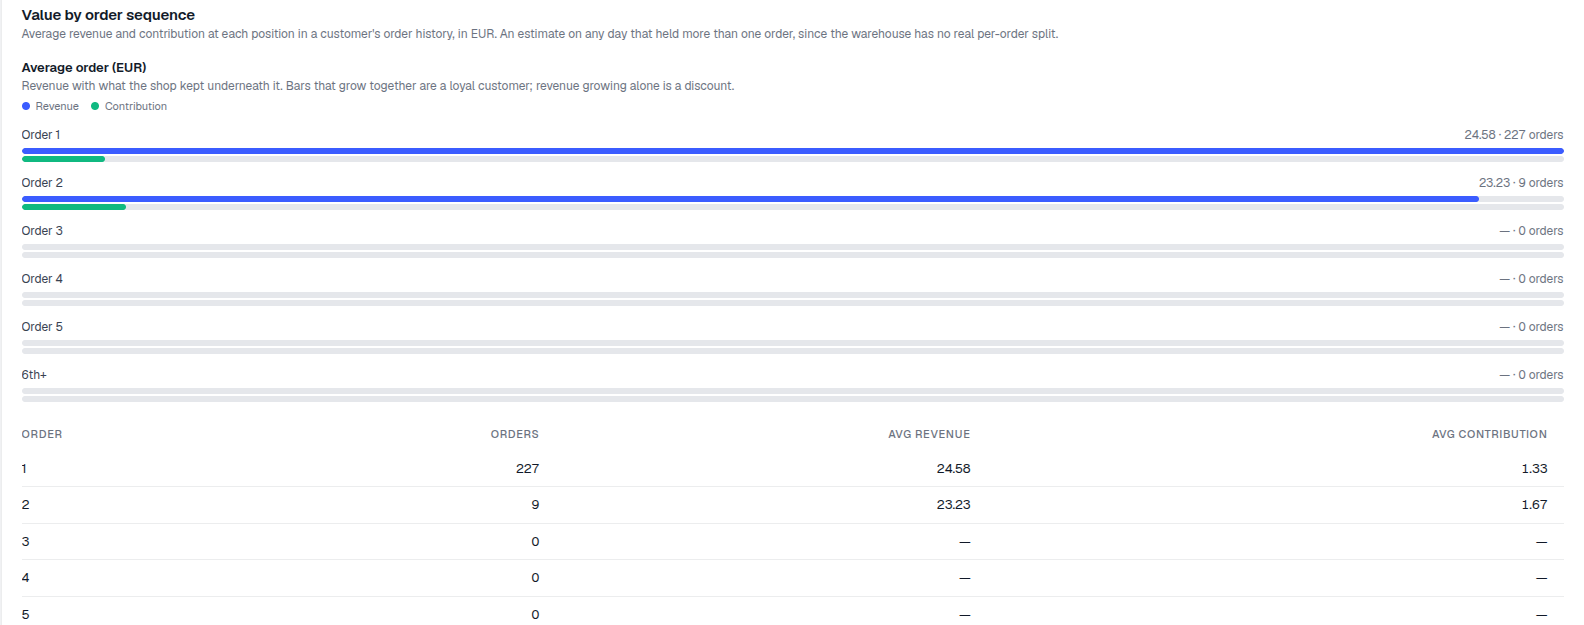
- Value by order sequence — average revenue and contribution, in EUR, at each position in a customer’s order history.
- Multi-order days split evenly — when a customer places more than one order on the same day, the day’s total is divided evenly across them before averaging, since a true per-order split can’t be recovered.
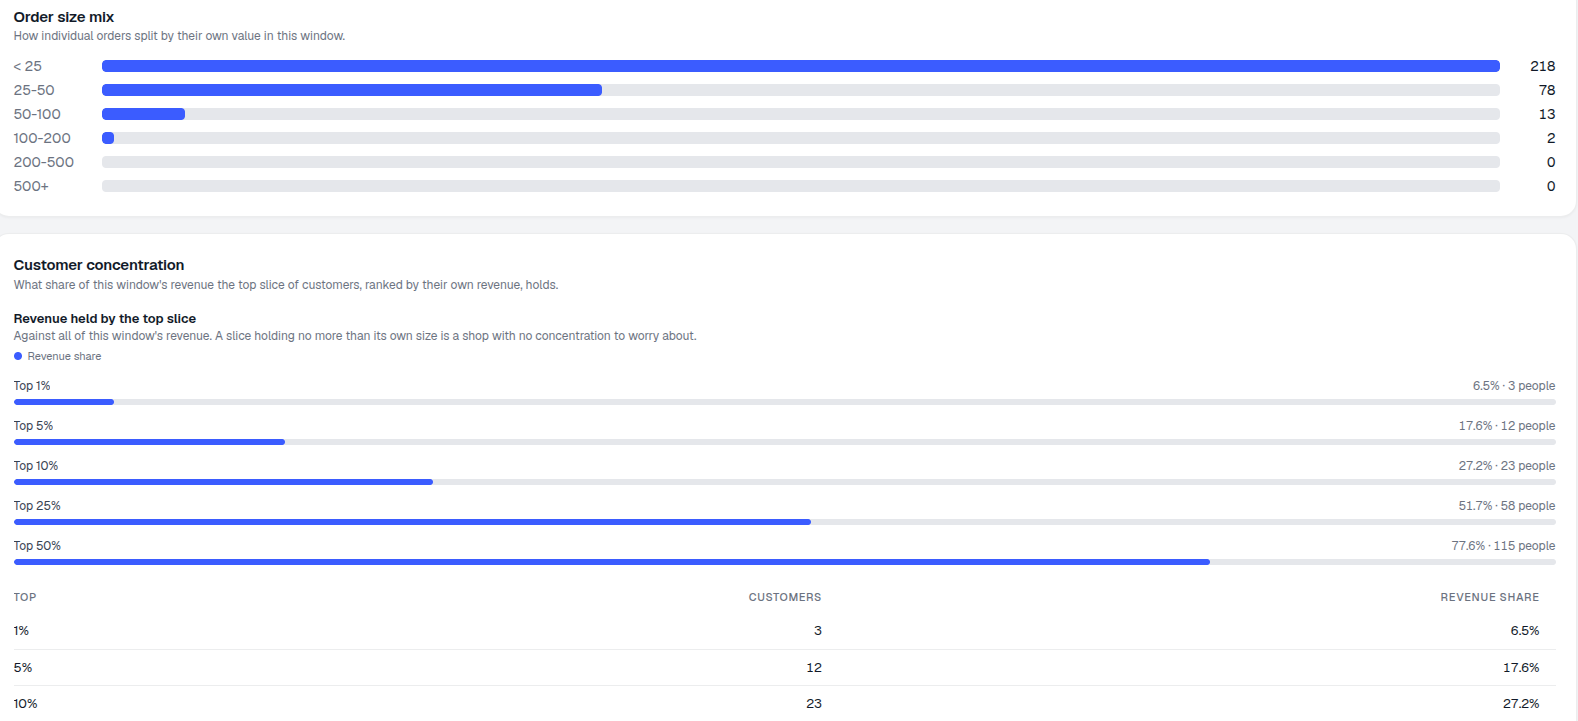
- Customer concentration — what share of this window’s revenue the top 1%, 5%, 10%, 25% and 50% of customers hold, ranked by their own revenue.
Revenue From New and Repeat Customers
Net revenue per calendar month, in EUR, split by whether the order came from a customer new that day (accent) or one returning (green) — plus the returning share of each ISO week’s orders, so a slow month reads as an acquisition problem or a retention one, not just a smaller number.
Customer Revenue Concentration
Rank customers by their own revenue and ask what share the top slice holds. In this window the top 1% — 3 people — already account for 7.3% of revenue; the top 10% (21 people) account for 27.2%; and the top 50% (101 people) account for 76.5%. That shape is the real measure of dependency, not a single average.
- Top 1% — 7.3% of revenue, 3 customers.
- Top 5% — 17.9% of revenue, 11 customers.
- Top 10% — 27.2% of revenue, 21 customers.
- Top 25% — 50.6% of revenue, 51 customers.
- Top 50% — 76.5% of revenue, 101 customers.
- Read the slice against its own size — a top 10% holding close to 10% of revenue is unconcentrated; holding far more, as here, is customer-loss risk worth watching, not just a number to report.
of this window’s revenue held by the top 1% of customers
Just 3 people. The same table runs to top 10% (27.2%, 21 people) and top 50% (76.5%, 101 people) — the shape of dependency, not a single average.
See Customers and RetentionAnalyze Repeat Purchase Customer Value
Same-item repurchase rate, time between orders, and the value of every position in a customer’s order history — all in EUR.
Ready to see who actually comes back?
Free check · 7-day trial · card required