Split Testing
Split testing divides website traffic between different versions to identify the highest-performing variant. Learn how A/B testing drives conversion optimizatio...
14 min read
A/B testing is a controlled experimental methodology that compares two versions of a webpage, application, or marketing asset to determine which performs better for a specific goal. By randomly splitting traffic between a control version (A) and a variation (B), organizations use statistical analysis to make data-driven optimization decisions.
A/B testing is a controlled experimental methodology that compares two versions of a webpage, application, or marketing asset to determine which performs better for a specific goal. By randomly splitting traffic between a control version (A) and a variation (B), organizations use statistical analysis to make data-driven optimization decisions.
A/B testing, also known as split testing or bucket testing, is a controlled experimental methodology that compares two versions of a webpage, application, email, or marketing asset to determine which performs better for a specific business objective. The process involves randomly dividing traffic or users between a control version (A) and a variation (B), then measuring performance through statistical analysis to identify which version achieves superior results. This methodology transforms decision-making from opinion-based to data-driven, enabling organizations to optimize user experiences with confidence. A/B testing has become fundamental to conversion rate optimization (CRO), digital marketing, and product development, with approximately 77% of firms globally conducting A/B tests on their websites according to recent industry data.
The concept of A/B testing emerged from classical statistical experimentation principles, but its application to digital marketing gained prominence in the early 2000s. Google first implemented A/B testing in 2000 to determine the optimal number of search results per page, demonstrating the methodology’s power in large-scale digital environments. Since then, the practice has evolved dramatically, with major technology companies like Amazon, Facebook, and Booking.com each conducting over 10,000 controlled experiments annually. The global A/B testing tools market is projected to reach USD 850.2 million in 2024, with a compound annual growth rate (CAGR) of 14.00% from 2024 to 2031, reflecting the growing recognition of experimentation’s business value. This expansion has democratized testing, making it accessible to organizations of all sizes, from startups to enterprises, fundamentally changing how businesses approach optimization and innovation.
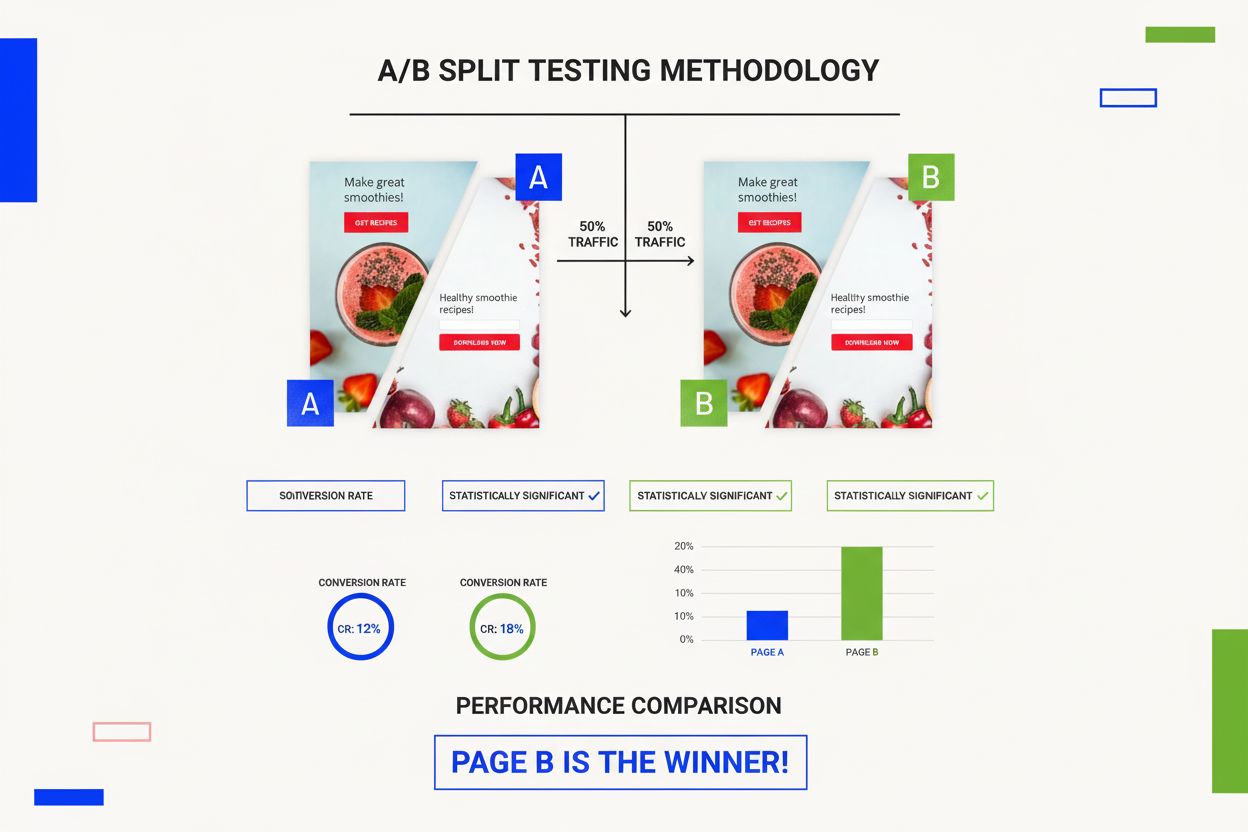
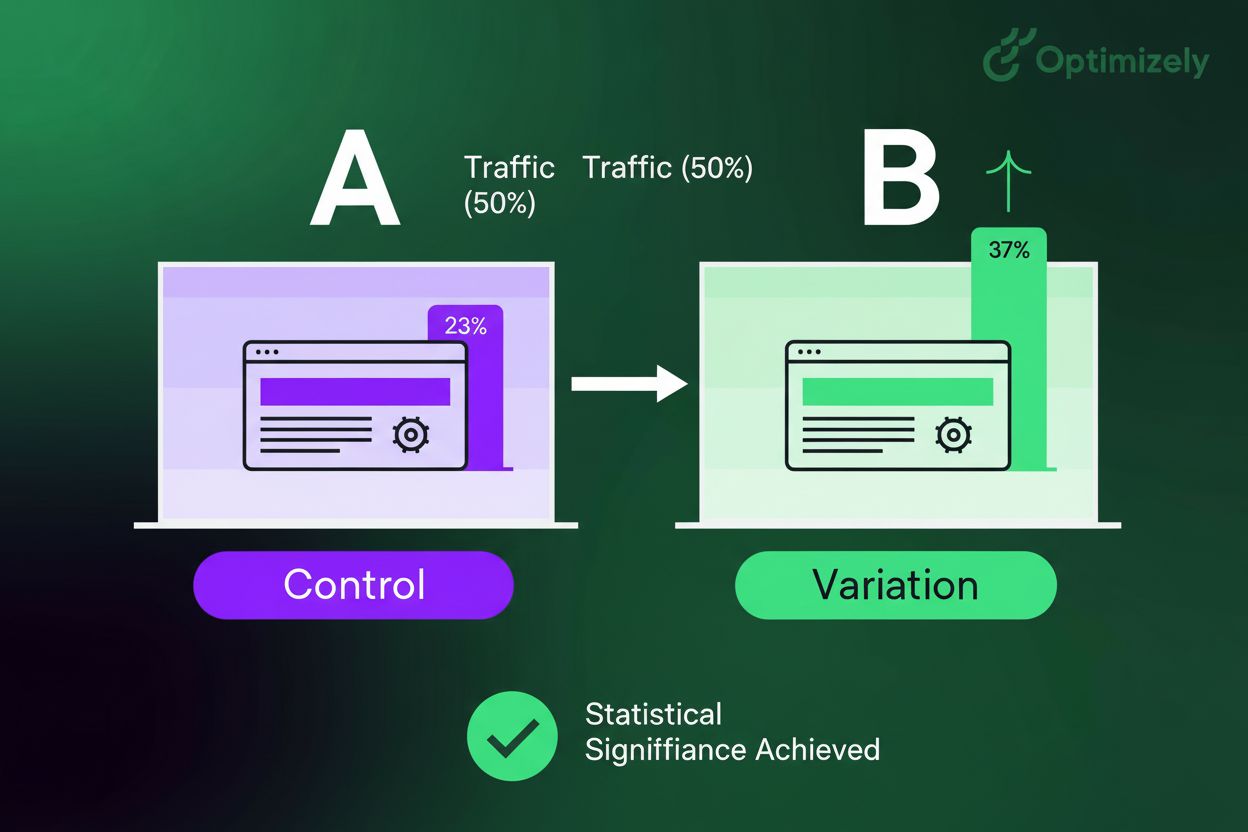
The A/B testing process follows a structured framework designed to minimize bias and ensure reliable results. First, organizations identify a hypothesis—a specific prediction about how a change will impact user behavior or business metrics. Next, they create two versions: the control (A), which represents the current experience, and the variation (B), which includes the proposed change. Traffic is then randomly split between these versions, ensuring that differences in performance result from the tested change rather than external factors or user characteristics. During the test period, both versions are monitored through analytics dashboards that track key performance indicators (KPIs) such as conversion rates, click-through rates, bounce rates, and revenue per visitor. The test continues until sufficient data is collected to achieve statistical significance, typically defined as a 95% confidence level, meaning there is only a 5% probability that observed differences occurred by chance. Finally, results are analyzed to determine whether the variation outperformed the control, underperformed it, or showed no significant difference, informing the decision to implement, discard, or refine the tested change.
| Aspect | A/B Testing | Multivariate Testing | Split URL Testing | Multipage Testing |
|---|---|---|---|---|
| Number of Variables | One variable tested | Multiple variables tested simultaneously | Single or multiple changes | Single change across multiple pages |
| Sample Size Required | Smaller | Larger (exponentially increases with variables) | Medium to large | Medium to large |
| Test Duration | 1-2 weeks typically | 2-4 weeks or longer | 1-3 weeks | 2-4 weeks |
| Complexity | Simple to implement | Complex analysis required | Moderate complexity | Moderate complexity |
| Best Use Case | Incremental optimization | Understanding element interactions | Major redesigns or backend changes | Optimizing entire user journeys |
| Statistical Analysis | Straightforward p-value calculation | Complex interaction analysis | Standard significance testing | Funnel-level analysis |
| Implementation Method | Client-side or server-side | Typically server-side | Server-side (different URLs) | Server-side or client-side |
| Cost | Low to moderate | Moderate to high | Moderate | Moderate |
Organizations must choose between client-side testing and server-side testing based on the nature of changes being tested. Client-side testing uses JavaScript executed in the user’s browser to deliver variations, making it ideal for front-end changes such as button colors, headline text, layout adjustments, and visual elements. This approach is quick to implement and requires minimal backend involvement, making it popular for marketing teams and designers. However, client-side testing can cause flicker—a brief moment where users see the original page before the variation loads—which may negatively impact user experience. Server-side testing, conversely, delivers variations before the page reaches the user’s browser, eliminating flicker and enabling testing of backend changes like database queries, API responses, and page load performance. Server-side testing is more robust and suitable for testing structural changes, checkout processes, and performance optimizations. The choice between these methods depends on your technical infrastructure, the scope of changes, and the level of control required over the testing environment.
Statistical significance is the cornerstone of reliable A/B testing, determining whether observed differences between variations reflect genuine performance improvements or random fluctuation. Achieving statistical significance requires collecting sufficient data from enough users, a concept quantified through sample size calculations. The required sample size depends on several factors: the baseline conversion rate (your current performance), the minimum detectable effect (the smallest improvement you consider meaningful), and the confidence level (typically 95%, meaning a 5% acceptable error rate). For example, if your baseline conversion rate is 3% and you want to detect a 20% relative improvement (0.6 percentage points), you might need 5,000-10,000 visitors per variation. Conversely, if you’re testing a high-traffic page with a 10% baseline conversion rate, you might achieve significance with fewer visitors. Many organizations use sample size calculators to determine optimal test duration before launching experiments. Failing to achieve statistical significance can lead to false conclusions, where random variation is mistaken for genuine performance differences, resulting in poor optimization decisions.
A/B testing delivers measurable business value across multiple dimensions of digital optimization. Conversion rate optimization (CRO) represents the primary application, with 60% of companies specifically using A/B testing on landing pages to improve lead generation and sales. The methodology enables organizations to identify and eliminate friction points in user journeys—confusing navigation, unclear value propositions, complicated forms, or poorly designed checkout processes—that cause visitors to abandon their intended actions. Real-world results demonstrate the impact: Dell reported a 300% increase in conversion rates through systematic A/B testing, while Bing conducts over 1,000 A/B tests monthly to continuously refine search results and user experience. Beyond conversion optimization, A/B testing improves customer acquisition costs by identifying which messaging, design, and targeting approaches most efficiently convert visitors into customers. Organizations also use A/B testing to reduce bounce rates, increase average order value, improve email open rates (with 59% of firms conducting A/B tests on email campaigns), and enhance user engagement across digital touchpoints. The cumulative effect of continuous testing creates compounding improvements, where each successful optimization builds on previous wins to drive exponential business growth.
Different industries exhibit distinct A/B testing patterns and success rates, reflecting their unique user behaviors and business models. The gaming and sports industries demonstrate the highest variation success rates, with 60-70% of tests producing variations that outperform controls, primarily because these sectors focus on engagement optimization where user preferences are highly responsive to design and feature changes. The travel sector shows more conservative results, with only 40% of test variations outperforming controls, likely due to the complexity of travel decision-making and the diverse preferences of international audiences. The media and entertainment industry runs the most tests, exceeding 60 experiments per year on average, reflecting the rapid content cycles and audience preference shifts in these sectors. Retail companies allocate more than 90% of their traffic to testing, demonstrating their commitment to continuous optimization and their ability to generate statistically significant results quickly due to high traffic volumes. SaaS companies run an average of 24-60 tests per account annually, with some mature organizations conducting five or more tests monthly, indicating a sophisticated testing culture focused on product optimization and user experience refinement. These industry variations highlight the importance of benchmarking against peers and understanding sector-specific testing dynamics when planning experimentation strategies.
Organizations can test virtually any element of their digital experience, but certain variables consistently deliver high-impact results. Call-to-action (CTA) buttons represent the most tested element, with 85% of businesses prioritizing CTA triggers for A/B testing due to their direct impact on conversions and ease of implementation. Testing CTA variations—including button color, text, size, and placement—often yields dramatic improvements; for example, PriceCharting achieved a 620.9% increase in click-throughs by simply changing CTA text from “Download” to “Price Guide.” Landing page elements are tested by 60% of companies, including headlines, hero images, form fields, and value propositions. Email marketing variables tested by 59% of firms include subject lines, preview text, sender names, send times, and message content. Paid advertising elements are tested by 58% of companies, optimizing ad copy, images, targeting parameters, and bidding strategies. Beyond these primary elements, organizations test navigation structures, page layouts, checkout processes, product recommendations, pricing displays, social proof elements, and personalization triggers. The key principle is to test elements that directly influence user behavior and business metrics, prioritizing high-traffic areas and high-impact changes to maximize the value of testing efforts.
Selecting appropriate metrics is critical to ensuring A/B tests measure meaningful business outcomes. Primary success metrics directly align with business objectives and include conversion rate (percentage of visitors completing desired actions), click-through rate (CTR), revenue per visitor, and average order value (AOV). These metrics provide clear evidence of whether a variation achieves the test’s primary goal. Supporting indicators provide context and reveal secondary effects, including time on page, bounce rate, pages per session, and user journey patterns. These metrics help identify whether variations improve the primary metric through intended mechanisms or through unintended side effects. Technical performance metrics measure infrastructure and user experience quality, including page load time, error rates, mobile responsiveness, and browser compatibility. Monitoring technical metrics ensures that performance improvements don’t come at the cost of site stability or accessibility. Modern A/B testing platforms increasingly employ warehouse-native analytics, which maintains test data in-house and enables analysis against real business outcomes like customer lifetime value, retention, and profitability. This approach provides deeper insights than surface-level metrics alone, connecting experimentation directly to long-term business value rather than isolated conversion events.
Organizations progress through distinct maturity stages in their experimentation capabilities, from Beginners (0-20% maturity) lacking foundational testing infrastructure, to Transformative organizations (81-100% maturity) leading their industries with sophisticated, continuous experimentation programs. Beginner organizations should focus on establishing basic infrastructure, adopting A/B testing tools, and building awareness of experimentation benefits across teams. Aspiring organizations (21-40% maturity) have implemented some testing elements but face internal silos and stakeholder alignment challenges; they should prioritize breaking down departmental barriers and establishing cross-functional collaboration. Progressive organizations (41-60% maturity) recognize testing’s value and have foundational elements in place; they should refine processes, improve hypothesis quality, and increase testing frequency. Strategic organizations (61-80% maturity) employ comprehensive experimentation approaches with strong organizational support; they should maintain standards, provide ongoing training, and document results systematically. Transformative organizations (81-100% maturity) are industry leaders; they should explore advanced methods like AI-driven experiments, personalization, and multivariate testing while mentoring less mature departments. Building testing culture requires leadership buy-in demonstrated through early wins and success stories, team empowerment through tools and training, and process integration that makes testing part of standard workflows. Approximately 49% of organizations report lacking cultural support for innovation and learning from failure, highlighting the importance of leadership commitment to establishing experimentation as a core organizational value.
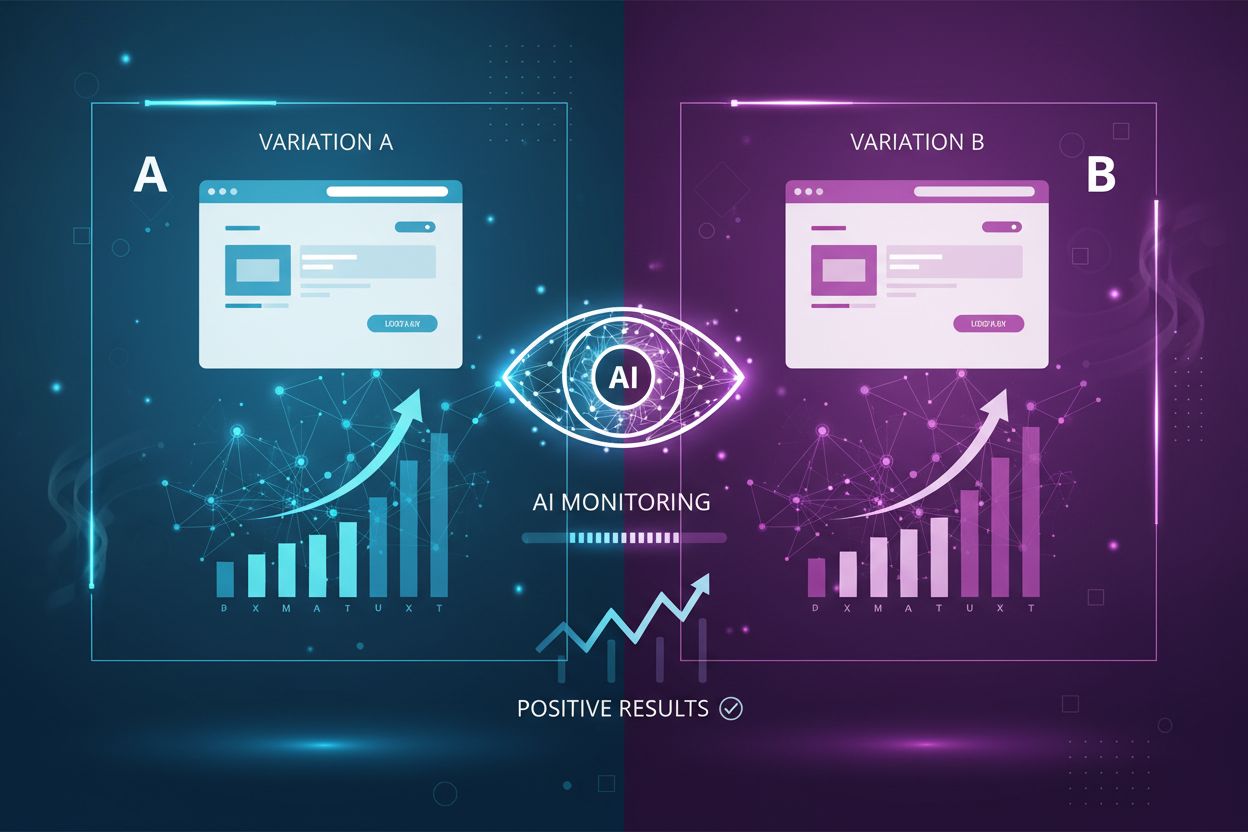
A/B testing continues to evolve with emerging technologies and methodologies reshaping how organizations approach experimentation. AI-driven experimentation represents a significant frontier, with machine learning algorithms automating hypothesis generation, sample size optimization, and result interpretation. These systems can identify testing opportunities based on historical data patterns and recommend high-impact experiments, accelerating testing velocity while improving quality. Bayesian statistics is gaining adoption as an alternative to traditional frequentist approaches, enabling organizations to review results mid-test and call winners early when one variation clearly outperforms the other, reducing test duration and accelerating implementation. Personalization and segmentation are becoming more sophisticated, with organizations testing variations for specific user segments rather than applying one-size-fits-all optimizations. Real-time experimentation powered by edge computing and serverless architectures enables faster test deployment and result collection. Cross-channel testing integrates A/B testing across web, mobile, email, and paid advertising, providing holistic optimization rather than siloed channel-specific improvements. The integration of behavioral data platforms with A/B testing tools enables deeper analysis of why variations perform differently, moving beyond surface-level metrics to understand user psychology and decision-making processes. As the A/B testing tools market continues its projected 14% annual growth, these technological advances will make sophisticated experimentation accessible to organizations of all sizes, democratizing data-driven optimization and establishing continuous testing as a competitive necessity rather than a differentiator.
Successful A/B testing requires adherence to established best practices while avoiding common mistakes that compromise result reliability. Formulate clear hypotheses before launching tests, grounding predictions in data and user research rather than assumptions. Test one variable at a time in standard A/B tests to isolate the impact of specific changes; testing multiple variables simultaneously creates confounding effects that obscure which change drove results. Ensure sufficient sample size by using calculators to determine appropriate test duration; stopping tests prematurely due to early positive results introduces bias and false positives. Avoid peeking at results during test execution, as this tempts early stopping and increases the risk of false conclusions. Monitor for technical issues throughout the test period, ensuring both variations load correctly and tracking functions properly. Document all tests and results in a centralized repository, with approximately 50% of organizations lacking such documentation, missing opportunities to learn from past experiments and avoid duplicating efforts. Avoid the HiPPO effect (Highest Paid Person’s Opinion), where senior leaders’ preferences override data; A/B testing’s power lies in letting data guide decisions rather than deferring to authority. Recognize that not all tests produce winners; approximately 40% of tests in the travel sector show no improvement, but these “failures” provide valuable learning that prevents poor decisions. Continue testing after wins, as optimization is iterative; successful variations become the control for future tests, enabling continuous improvement rather than one-time optimization.
A/B testing compares two single variations of a page or element, while multivariate testing examines multiple variables simultaneously to understand how different elements interact with each other. A/B tests provide faster results with simpler analysis, whereas multivariate tests require larger sample sizes but reveal complex interactions between page elements. Choose A/B testing for incremental changes and multivariate testing for comprehensive redesigns involving multiple elements.
A/B tests typically run for 1-2 weeks to account for traffic patterns and user behavior variations, though duration depends on traffic volume and desired statistical confidence level. Most businesses target a 95% confidence level, which requires sufficient sample size and time. Using a sample size calculator helps determine the optimal test duration based on your baseline conversion rate, minimum detectable improvement, and traffic volume.
Statistical significance indicates that observed differences between test variations are unlikely to be due to random chance, typically measured at a 95% confidence level. A p-value below 0.05 suggests the results are statistically significant and actionable. Without statistical significance, you cannot confidently determine which variation truly performs better, making it essential to run tests long enough to achieve this threshold.
Start with high-impact, easy-to-implement elements like call-to-action buttons, headlines, and form fields, as 85% of businesses prioritize CTA triggers for testing. These elements typically show measurable results quickly and require minimal resources to implement. Landing pages and email subject lines are also excellent starting points, as 60% and 59% of companies respectively test these elements for conversion optimization.
A/B testing is a core methodology within conversion rate optimization (CRO) that systematically identifies which changes improve conversion metrics. By testing variations against a control, businesses can pinpoint exactly which elements drive conversions, allowing them to optimize their funnel incrementally. This data-driven approach transforms CRO from guesswork into measurable, repeatable improvements.
No, A/B testing does not inherently harm SEO when implemented correctly. Google explicitly permits and encourages A/B testing, but you must avoid cloaking, use rel='canonical' tags for split URL tests, and employ 302 redirects instead of 301s. These best practices ensure search engines understand your test structure and continue indexing your original URL properly.
There is no universal minimum; sample size depends on your baseline conversion rate, minimum detectable effect, and desired confidence level. While some sources cite 25,000 visitors as a benchmark, this varies significantly by industry and test parameters. Use a sample size calculator to determine the appropriate size for your specific test, considering that larger effects require smaller samples.
Analyze results by comparing the conversion rates of both variations, checking for statistical significance, and calculating the confidence interval around the difference. If variation B shows a statistically significant improvement over control A, implement the winning version. If results are inconclusive, continue running the test or refine your hypothesis for future iterations.
Start tracking how AI chatbots mention your brand across ChatGPT, Perplexity, and other platforms. Get actionable insights to improve your AI presence.
Split testing divides website traffic between different versions to identify the highest-performing variant. Learn how A/B testing drives conversion optimizatio...
Master A/B testing for AI visibility with our comprehensive guide. Learn GEO experiments, methodology, best practices, and real-world case studies for better AI...
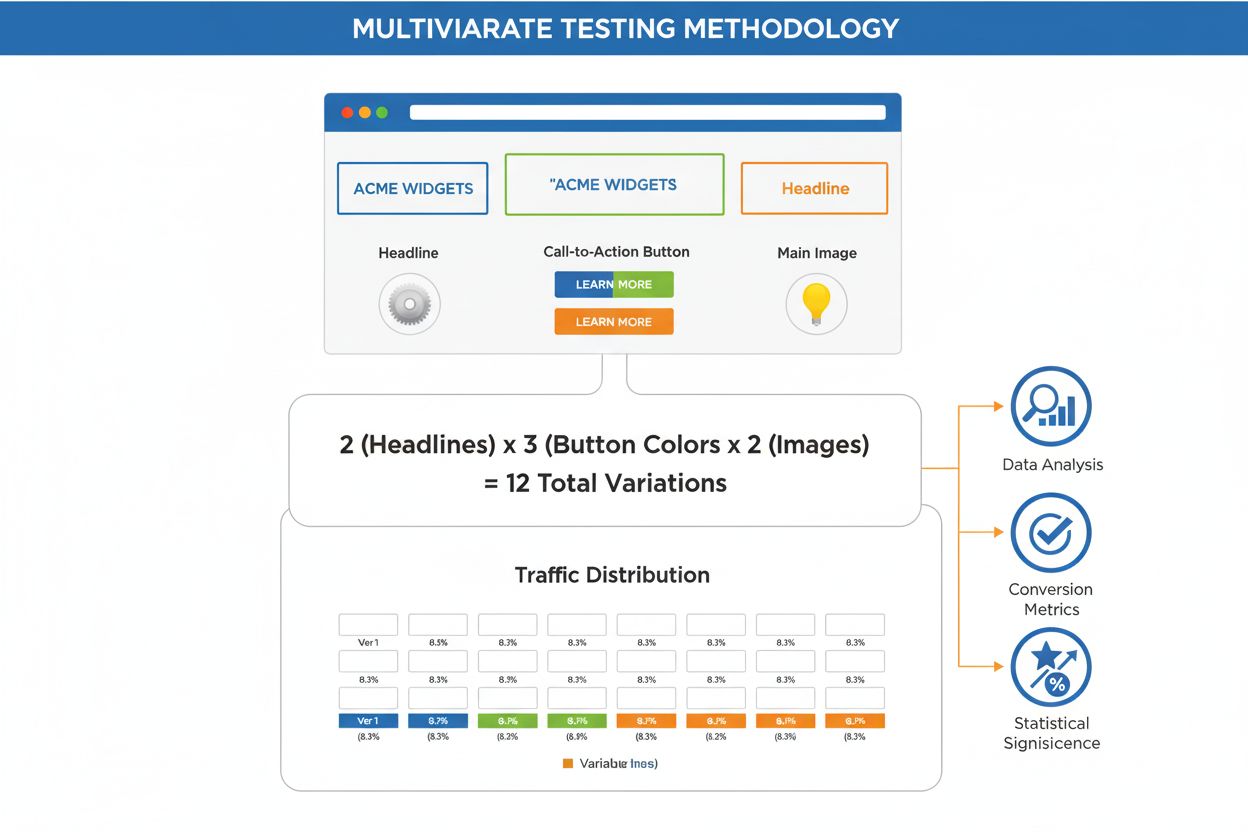
Multivariate testing definition: A data-driven methodology for testing multiple page variables simultaneously to identify optimal combinations that maximize con...