Ranking Position
Ranking position is the location of a webpage in search results (1-10 on page 1). Position 1 gets 39.8% CTR. Learn how ranking position affects traffic and visi...
15 min read
Average Position is an SEO metric that represents the mean ranking of a webpage across all search queries in which it appears on Google Search results pages. It is calculated by dividing the sum of all position values by the total number of impressions, providing a weighted average that reflects how prominently a website ranks across its entire keyword portfolio.
Average Position is an SEO metric that represents the mean ranking of a webpage across all search queries in which it appears on Google Search results pages. It is calculated by dividing the sum of all position values by the total number of impressions, providing a weighted average that reflects how prominently a website ranks across its entire keyword portfolio.
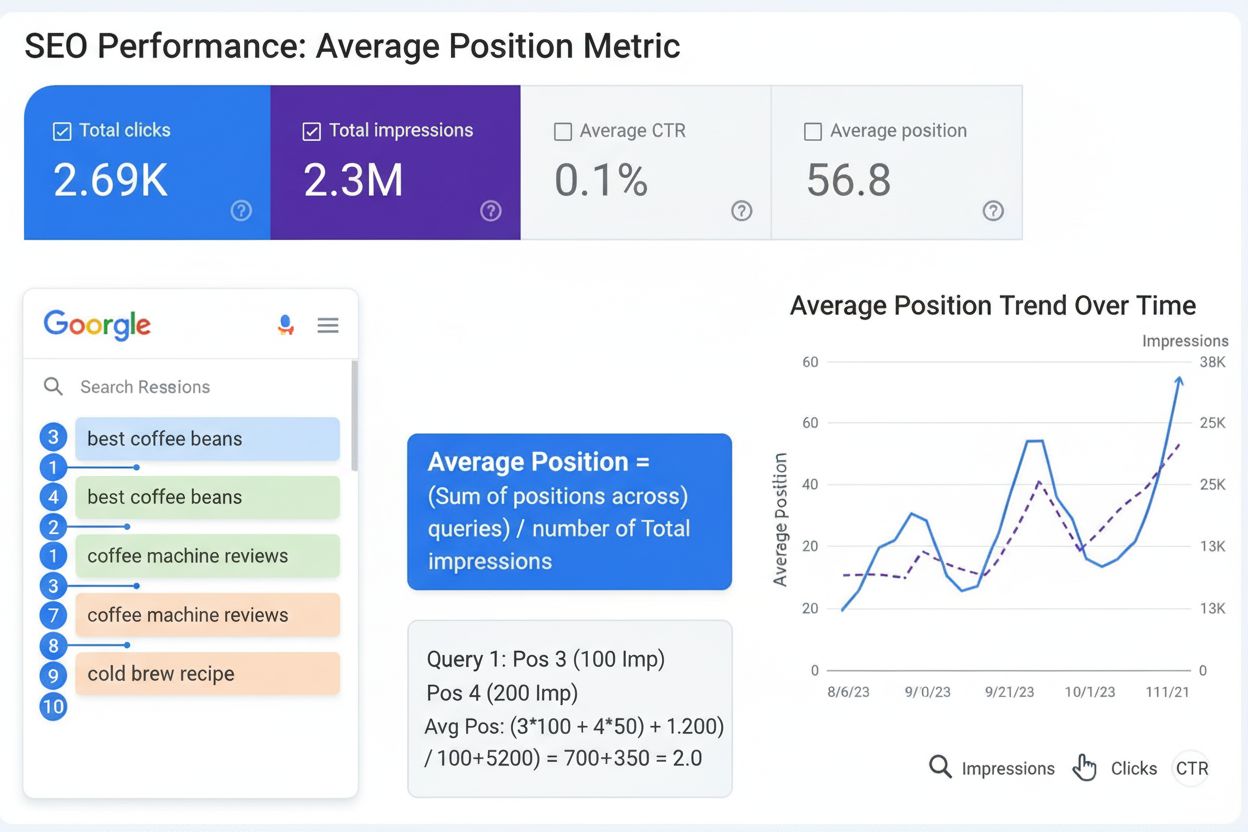
Average Position is a fundamental SEO metric that represents the mean ranking of your webpage across all search queries in which it appears on Google Search results pages. Specifically, it is calculated by dividing the sum of all position values by the total number of impressions, creating a weighted average that reflects how prominently your website ranks across its entire keyword portfolio. This metric is displayed in Google Search Console’s Performance report and serves as a critical indicator of your website’s overall visibility in organic search results. Unlike tracking individual keyword rankings, average position provides a holistic view of your search presence, accounting for the fact that your website ranks for hundreds or thousands of queries at varying positions. Understanding this metric is essential for SEO professionals, content marketers, and digital strategists who need to assess and improve their organic search performance.
The calculation of average position follows a specific mathematical formula that Google Search Console uses to aggregate ranking data. The formula is: Average Position = Sum of all position values / Total number of impressions. To illustrate this concept, consider a practical example: if your website appears at position 2 for one search query and position 5 for another query, your average position would be (2 + 5) / 2 = 3.5. However, Google’s calculation is more sophisticated because it weights positions by impressions. If your website received 100 impressions at position 2 and only 10 impressions at position 5, the calculation would be (2 × 100 + 5 × 10) / (100 + 10) = 2.32, reflecting that the position 2 ranking has greater impact due to higher visibility. This weighted approach ensures that your average position accurately reflects your actual search visibility, prioritizing keywords and queries that generate more impressions. It’s important to note that only the topmost position is counted for each query, even if your website appears multiple times in search results. For instance, if your website appears at positions 3, 7, and 12 for a single query, only position 3 is used in the calculation.
The concept of average position emerged as search engines became more sophisticated and websites began ranking for increasingly diverse keyword sets. In the early days of SEO, professionals tracked individual keyword rankings manually, but as the volume of tracked keywords grew exponentially, the need for aggregate metrics became apparent. Google Search Console introduced the average position metric to provide a simplified view of overall search performance, allowing webmasters to quickly assess whether their SEO efforts were improving or declining. Over the past decade, this metric has become a standard KPI in SEO dashboards and reporting frameworks. However, the metric’s importance has evolved with changes in search behavior and SERP features. The introduction of featured snippets, knowledge panels, AI Overviews, and other rich results has complicated position calculations, as these elements occupy single positions but may contain multiple links. Additionally, the rise of mobile-first indexing and personalized search results means that average position now varies significantly by device and user location. Recent industry research shows that approximately 78% of enterprises use AI-driven content monitoring tools to track their brand visibility, and average position remains a core metric in these platforms. The metric has also become increasingly relevant for monitoring AI search visibility, as platforms like ChatGPT, Perplexity, and Google AI Overviews now display website citations in their responses, creating a new dimension of “average position” tracking beyond traditional SERPs.
| Metric | Definition | Calculation | Primary Use | Limitations |
|---|---|---|---|---|
| Average Position | Mean ranking across all queries | Sum of positions / Total impressions | Overall search visibility assessment | Affected by outliers; doesn’t show individual keyword performance |
| Median Position | Middle value when positions are ranked | Middle value of sorted position data | Represents typical ranking | Less commonly used; harder to calculate |
| Best Position | Highest ranking for any keyword | Minimum position value | Identifies top-performing keywords | Doesn’t reflect overall performance |
| Impressions | Number of times website appears in SERPs | Count of SERP appearances | Measures search visibility volume | Doesn’t indicate ranking quality |
| Click-Through Rate (CTR) | Percentage of impressions that result in clicks | (Clicks / Impressions) × 100 | Measures search result appeal | Varies by position and industry |
| Visibility Score | Estimated organic traffic potential | Weighted calculation of rankings and search volume | Predicts traffic impact | Requires external data sources |
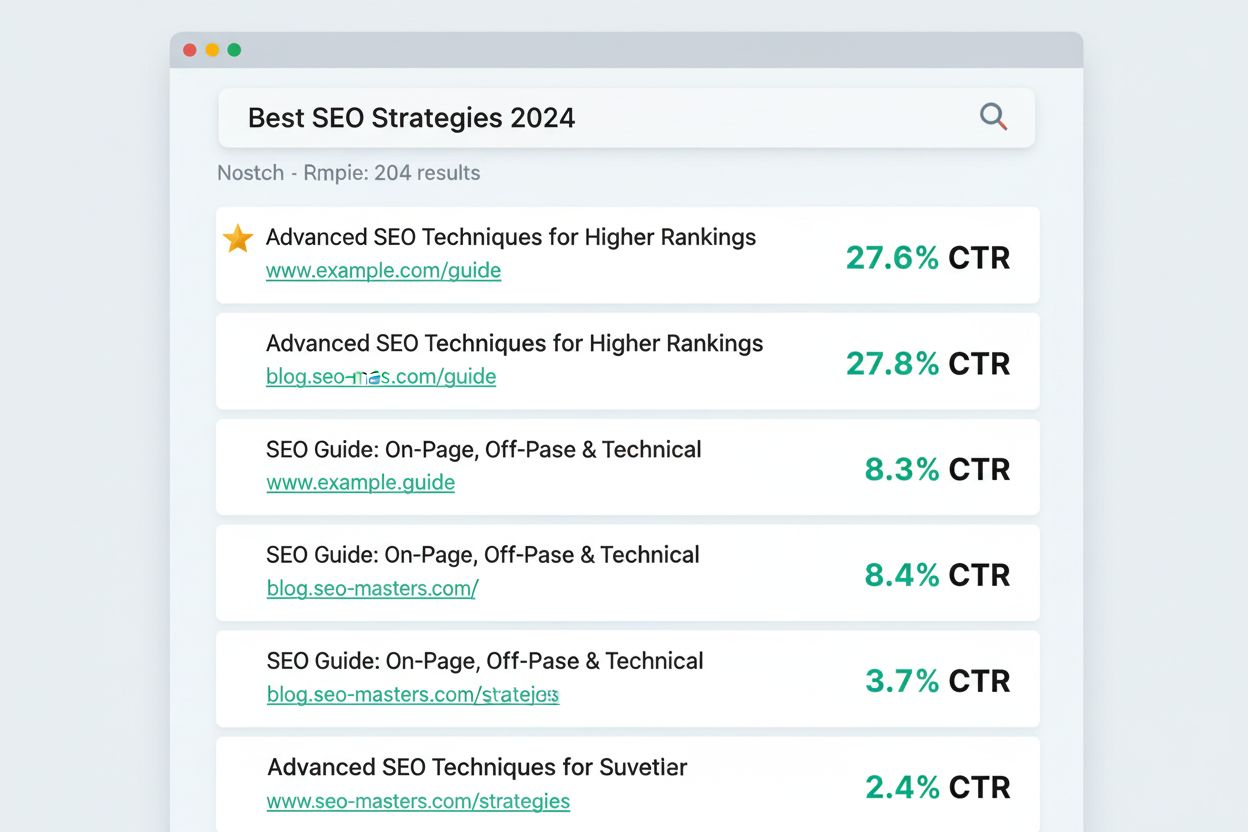
The average position metric operates within the complex architecture of Google Search results pages, where multiple elements compete for visibility. Google’s position calculation methodology counts from top to bottom on the primary side of the page (left side in left-to-right languages), then continues on the secondary side (right side). Each search result element occupies a single position, whether it contains one link or multiple links. For example, a knowledge panel with ten different links all occupies position 6 if the panel itself is in the sixth position on the page. This means that all links within that knowledge panel are credited with position 6 in the average position calculation. Importantly, query refinement links—links that perform new Google searches rather than directing to external websites—do not occupy positions and are not counted in the calculation. This distinction is crucial because it means your average position reflects only links that direct users away from Google’s platform. The position value is recorded only when a user receives an impression, meaning the result must be visible on the current page of results without requiring pagination. For infinite scrolling results (common in mobile image search), the item must be scrolled into view to register an impression and thus contribute to the position calculation. Additionally, ads do not occupy search positions, so sponsored results above organic listings do not affect your average position metric. The calculation also accounts for multiple appearances of your website on a single SERP; only the topmost position is used, ensuring that your average position reflects your most prominent visibility for each query.
From a business perspective, average position serves as a critical indicator of your website’s competitive standing in organic search. Research from Advanced Web Ranking’s Q4 2024 analysis reveals that websites ranked in position 1 on desktop achieved an average CTR of 19.06% in the Science industry, while the same position generated 38.45% CTR in Law, Government, & Politics—demonstrating that position’s direct correlation with traffic generation. This relationship underscores why improving average position is a primary objective for most SEO strategies. A website with an average position of 5 will typically receive significantly more organic traffic than one with an average position of 15, all else being equal. However, the business value of average position extends beyond simple traffic metrics. It reflects your brand authority and competitive positioning in your industry. When your average position improves, it signals to both users and search engines that your content is increasingly relevant and authoritative. This can create a positive feedback loop where improved rankings lead to more clicks, which signals quality to Google, potentially leading to further ranking improvements. Conversely, a declining average position may indicate that competitors are outranking you or that algorithm changes have affected your visibility. For e-commerce businesses, average position directly impacts revenue, as higher rankings typically correlate with increased product visibility and sales. For SaaS companies, improved average position increases qualified lead generation. For content publishers, better average position drives advertising revenue through increased page views. Understanding and optimizing average position is therefore not merely an SEO metric—it’s a fundamental business performance indicator.
Google Search Console remains the primary source for average position data in traditional organic search, but the metric’s relevance has expanded significantly with the emergence of AI search platforms. In Google Search Console, average position is calculated specifically for Google Search results, with separate calculations available for Image Search, Video Search, and News Search. Each search type has distinct position calculations because the layout and positioning logic differ. For instance, image search results are counted left to right, then top to bottom, with position values varying based on screen width and image dimensions. News search results follow different position rules, and AI Overviews (Google’s AI-generated summaries) occupy a single position at the top of results, with all cited links within the overview sharing that position value. Beyond Google, emerging AI search platforms like ChatGPT, Perplexity, and Claude now display website citations in their responses, creating a new dimension of “average position” tracking. Tools like AmICited monitor where your brand appears in AI-generated responses, tracking citation frequency and position within AI outputs. This represents a fundamental shift in search visibility monitoring, as your website’s “position” in an AI response may be more valuable than a position 5 ranking in traditional Google results, depending on the context and user intent. Perplexity’s AI search shows cited sources in a sidebar, and your “position” in that citation list affects visibility. Google AI Overviews integrate citations directly into the summary, and being cited early in the overview is increasingly important for driving traffic. The average position metric in these AI contexts is still evolving, but it’s becoming clear that multi-platform position tracking is essential for comprehensive search visibility monitoring. Organizations that monitor average position only in Google Search Console are missing significant visibility opportunities in AI search channels.
The relationship between average position and overall search visibility is complex and non-linear. While a lower average position (closer to 1) generally indicates better visibility, the actual traffic impact depends on multiple factors. Research shows that CTR varies dramatically by position: position 1 results receive approximately 19-20% CTR on desktop, position 2 receives 10-12%, position 3 receives 7-9%, and position 10 receives only 2-3%. However, these percentages vary significantly by industry, search intent, and content type. Informational queries (containing words like “what,” “how,” “why”) show different CTR patterns than commercial queries (containing “buy,” “price,” “best”). Additionally, the introduction of AI Overviews has impacted CTR for informational queries, with research indicating that AI Overviews appeared in 42.51% of informational queries in Q4 2024, up from 33.68% in Q3, resulting in 7.31 percentage points combined CTR loss for websites ranked in positions 1-4 on desktop. This demonstrates that average position alone doesn’t determine traffic; the SERP landscape and feature presence significantly influence actual visibility. A website at position 2 in a SERP with an AI Overview may receive fewer clicks than a website at position 3 in a SERP without an overview. Therefore, effective search visibility optimization requires monitoring average position alongside SERP features, CTR data, and impression volume to understand the complete picture of your search performance.
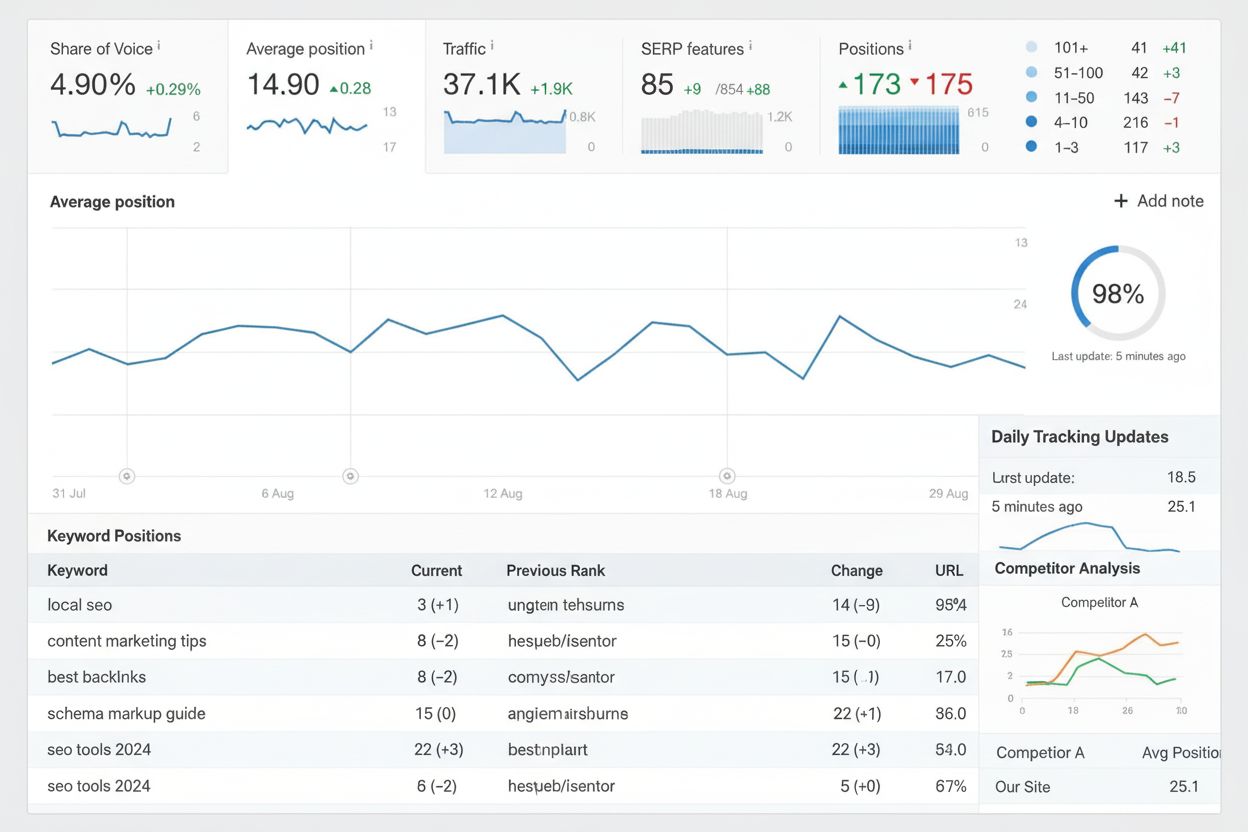
Average position data provides valuable competitive intelligence when analyzed strategically. By comparing your average position across different keyword segments with competitor average positions, you can identify competitive gaps and opportunities. For example, if your average position for “commercial intent” keywords is 8 while competitors average position 3, this indicates a significant competitive disadvantage in high-value keywords. Conversely, if your average position for “informational” keywords is 4 while competitors average position 6, you’ve identified a competitive strength to leverage. Segment-based analysis reveals which content categories or topic clusters your website dominates versus where competitors outrank you. This intelligence informs content strategy, helping you decide whether to double down on areas where you already rank well or invest in improving weak areas. Additionally, tracking average position changes over time reveals the effectiveness of your SEO initiatives. If you implement a comprehensive on-page optimization campaign and average position improves from 6.5 to 5.2 over three months, this quantifies the impact of your efforts. Conversely, if average position declines despite increased content production, it may indicate that your content isn’t meeting search intent or that competitive pressure has increased. Seasonal analysis of average position reveals how your rankings fluctuate throughout the year, helping you anticipate traffic patterns and plan content calendars accordingly. For example, e-commerce websites often see average position improvements during peak shopping seasons as search volume increases and Google’s algorithm prioritizes relevant, high-quality content.
The definition and application of average position is evolving rapidly as search landscapes transform. The rise of AI search platforms represents the most significant shift, as “average position” now extends beyond traditional Google SERPs to include AI-generated response citations. As AI search continues to mature, the metric may need to account for citation prominence within AI outputs, citation frequency across multiple AI platforms, and citation context (whether your brand is cited as a primary source or supporting reference). Google’s continued expansion of SERP features—including AI Overviews, featured snippets, knowledge panels, and rich results—means that traditional position calculations may become less meaningful. Future SEO metrics may need to incorporate pixel depth (how far down the page a result appears visually) rather than relying solely on element position. Additionally, personalization and localization of search results mean that average position will increasingly vary by user segment, location, and device, requiring more granular tracking and analysis. The emergence of voice search and conversational AI introduces new challenges for position tracking, as these interfaces don’t display traditional ranked lists. Organizations will need to adapt their average position monitoring strategies to account for these evolving search paradigms. AmICited and similar AI monitoring platforms are pioneering new metrics for tracking brand visibility in AI responses, potentially creating new “average position” equivalents for AI search. As search continues to evolve, average position will likely remain a core metric, but its calculation, interpretation, and strategic importance will continue to transform. Forward-thinking organizations are already monitoring average position across multiple platforms—traditional Google Search, AI search engines, and emerging search interfaces—to maintain comprehensive visibility intelligence.
Average position remains one of the most important SEO metrics for understanding and improving your website’s search visibility. By representing your mean ranking across all queries, it provides a holistic view of your competitive standing in organic search. However, effective use of this metric requires understanding its nuances: recognizing that it’s weighted by impressions, that it reflects only topmost positions, and that it must be analyzed alongside CTR, impressions, and other contextual data. The metric’s relevance has expanded beyond traditional Google Search to encompass emerging AI search platforms, where your “average position” in AI-generated responses increasingly impacts traffic and brand visibility. Organizations that monitor average position strategically—applying filters, tracking trends, correlating with other metrics, and benchmarking against competitors—gain significant competitive advantages. As search continues to evolve with AI integration, personalization, and new interface paradigms, average position will likely remain a core metric while its calculation and interpretation adapt to new search realities. By understanding average position deeply and monitoring it across all relevant search platforms, you position your organization to maintain and improve search visibility in an increasingly complex and competitive digital landscape.
Average position is calculated by summing all position values and dividing by total impressions, making it sensitive to outliers. Median position represents the middle value when all positions are ranked, making it less affected by extremely high or low rankings. For most SEO purposes, average position is more commonly used because it reflects the weighted impact of all queries, especially those with higher impression volumes.
Average position is calculated across all queries your website ranks for, including long-tail keywords and queries with low search volume where you may rank lower. Your website might rank #1 for one keyword but #50 for another, resulting in an average position of 25. Additionally, Google Search Console only counts positions for queries where your site received an impression, so the metric reflects real visibility rather than theoretical rankings.
A good average position typically falls between 1 and 3, indicating your website frequently appears in the top search results. Positions between 4 and 10 suggest your content is on page one but not at the very top. Positions above 10 indicate your content appears on page two or beyond. However, the ideal average position depends on your industry, competition level, and target keywords. Focus on improving positions for high-volume, high-intent keywords rather than optimizing the overall average.
Average position and CTR are closely correlated but distinct metrics. Research shows that websites ranking in position 1 on desktop have an average CTR of approximately 19-20%, while position 2 drops to around 10-12%, and position 10 averages only 2-3%. However, this relationship varies by industry, search intent, and content type. A high average position with low CTR suggests your title and meta description need optimization, while a low average position with high CTR indicates strong content relevance.
Yes, average position can fluctuate independently of impressions and clicks. For example, if your website starts ranking for new keywords at lower positions, your average position may increase (worsen) even if total impressions remain stable. Conversely, if lower-ranking keywords drop out of results while top-ranking keywords maintain visibility, your average position may improve without significant changes in overall traffic metrics.
As AI search platforms like ChatGPT, Perplexity, and Google AI Overviews grow, monitoring average position becomes increasingly important for brand visibility. Tools like AmICited track where your brand appears in AI-generated responses, similar to traditional SERP position tracking. This emerging metric helps you understand your visibility in AI search results, which complements traditional Google Search Console data and provides a more complete picture of your search presence.
Average position is influenced by on-page SEO factors (title tags, meta descriptions, content quality), off-page factors (backlinks, domain authority), technical SEO (site speed, mobile-friendliness), search intent alignment, and competitive landscape. Google algorithm updates can cause significant position shifts. Additionally, seasonal trends, user behavior changes, and SERP feature changes (like AI Overviews) can impact your average position across your keyword portfolio.
Start tracking how AI chatbots mention your brand across ChatGPT, Perplexity, and other platforms. Get actionable insights to improve your AI presence.
Ranking position is the location of a webpage in search results (1-10 on page 1). Position 1 gets 39.8% CTR. Learn how ranking position affects traffic and visi...
Rank tracking monitors keyword positions in search results over time. Learn how it works, why it matters for SEO, and how to use rank tracking tools effectively...

Position tracking monitors keyword rankings across SERPs to measure SEO performance. Learn how to track rankings, key metrics, and why it matters for AI search ...
Cookie Consent
We use cookies to enhance your browsing experience and analyze our traffic. See our privacy policy.