Exit Page
Exit page definition: the last page users view before leaving your site. Learn how exit pages differ from bounce pages, why they matter for conversions, and how...
8 min read
Bounce rate is the percentage of visitors who land on a website page and leave without interacting further, such as clicking links, viewing additional pages, or triggering conversion events. In Google Analytics 4, it represents sessions lasting less than 10 seconds with no engagement or key events.
Bounce rate is the percentage of visitors who land on a website page and leave without interacting further, such as clicking links, viewing additional pages, or triggering conversion events. In Google Analytics 4, it represents sessions lasting less than 10 seconds with no engagement or key events.
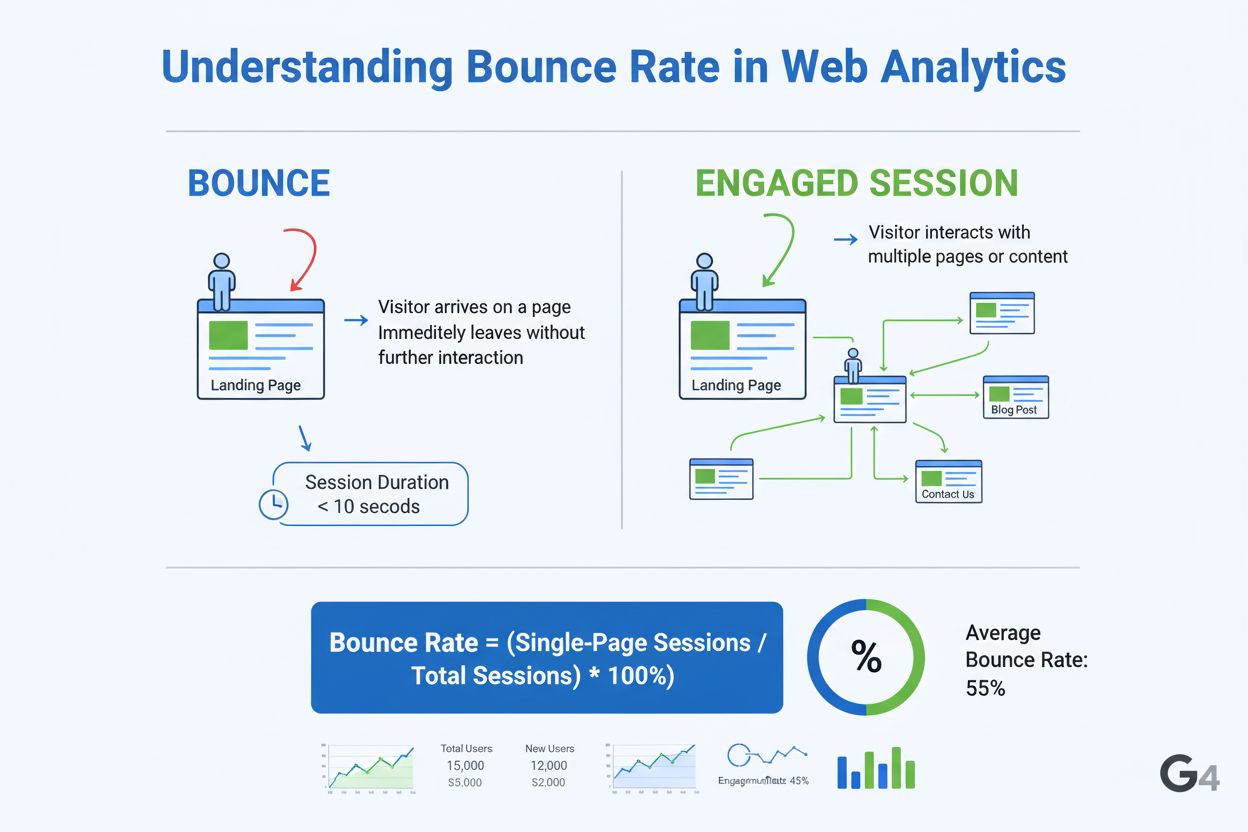
Bounce rate is the percentage of visitors who land on a website page and leave without taking any further action, such as clicking links, viewing additional pages, filling out forms, or triggering conversion events. In modern analytics, particularly Google Analytics 4 (GA4), bounce rate represents sessions that fail to meet engagement criteria—specifically, sessions lasting less than 10 seconds, containing only a single page view, and generating no key events or conversions. This metric serves as a fundamental indicator of user engagement and content effectiveness, helping website owners and marketers understand whether their pages are meeting visitor expectations or driving them away. The term “bounce” metaphorically describes visitors who arrive and immediately depart, much like a ball bouncing off a surface without sticking.
The concept of bounce rate has evolved significantly since its introduction in the early 2000s with Universal Analytics. Originally, bounce rate was calculated simply as the percentage of single-page sessions divided by total sessions, without considering time spent on page or user interactions. This definition created considerable confusion because it treated all single-page visits identically, regardless of whether the visitor spent 30 seconds reading valuable content or 2 seconds accidentally clicking a wrong link. When Google Analytics 4 launched in 2020, Google initially removed bounce rate entirely, recognizing that the metric had become less relevant in an era of infinite-scroll websites, single-page applications (SPAs), and dynamic content. However, due to widespread demand from marketers and agencies who had relied on this metric for over a decade, Google reintroduced bounce rate in GA4 with a fundamentally different definition centered on engagement rather than page count. This evolution reflects the industry’s growing understanding that meaningful engagement matters far more than simple page navigation patterns.
The GA4 bounce rate calculation differs substantially from its predecessor. In GA4, bounce rate is computed using the formula: Bounce Rate = (Unengaged Sessions ÷ Total Sessions) × 100. A session is classified as “unengaged” if it meets all three of these criteria: it lasts less than 10 seconds, contains only one page or screen view, and triggers no key events (conversion events). Conversely, an engaged session is one that lasts 10 seconds or longer, includes 2 or more page/screen views, or triggers at least one key event. This means bounce rate in GA4 is mathematically the inverse of engagement rate—if your engagement rate is 55%, your bounce rate is 45%. For example, if a website receives 1,000 total sessions in a month and 450 of those sessions are unengaged, the bounce rate would be 45%. This engagement-based approach provides more nuanced insights than the old single-page metric, particularly for modern web experiences where users may spend significant time on a single page consuming content, scrolling through feeds, or interacting with dynamic elements without navigating to another page.
Understanding bounce rate benchmarks is essential for contextualizing your website’s performance. According to 2024-2025 data aggregated from over 150,000 marketing campaigns, the median bounce rate across all industries is approximately 44-45%, though this varies considerably by sector. Apparel and Footwear industries report the lowest bounce rates at approximately 35-36%, likely because visitors to these sites have clear purchase intent and tend to browse multiple products. Conversely, Advertising and Marketing services experience higher bounce rates around 61%, reflecting the intent-driven nature of these searches where users may find answers quickly and leave. Travel and Leisure websites typically achieve bounce rates around 38-44%, as users engage deeply with itinerary planning and booking tools. B2B websites average bounce rates around 50-56%, while B2C websites typically range from 40-50%. Blog posts and content-focused pages often have higher bounce rates (60-70%) because readers may find the specific information they sought and leave satisfied. Ecommerce product pages generally maintain lower bounce rates (33-47%) due to the exploratory nature of shopping behavior. Geographic variations also exist—Germany and Denmark report notably lower bounce rates (35-39%), while the United States averages around 56%, suggesting regional differences in user behavior and website optimization practices.
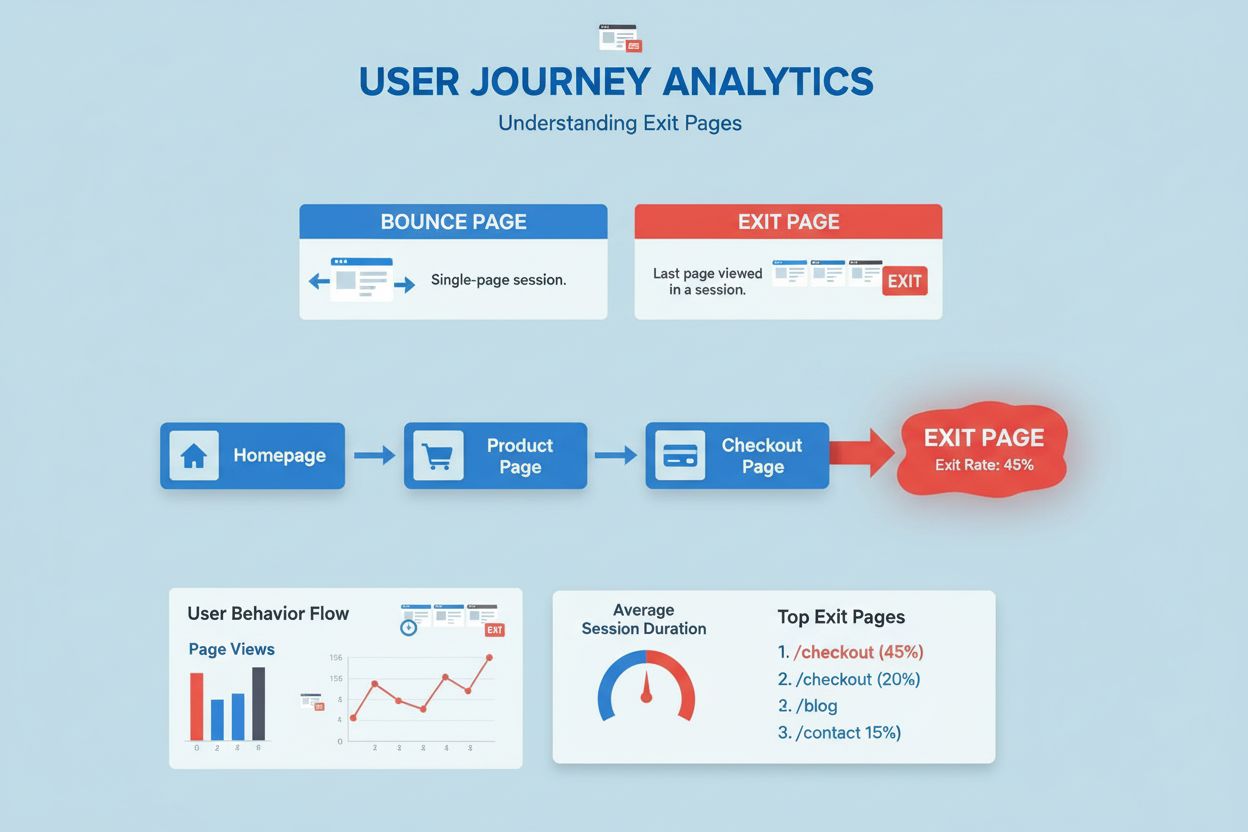
While bounce rate and exit rate are often confused, they measure fundamentally different aspects of user behavior. Bounce rate specifically measures the percentage of visitors who enter your website on a particular page and leave without viewing any other pages or triggering interactions. It focuses exclusively on the initial landing page and represents single-page sessions. Exit rate, by contrast, measures the percentage of all sessions that end on a specific page, regardless of how many pages the visitor viewed beforehand. A visitor could view five pages on your website and then exit on the sixth page—this would not count as a bounce (since they viewed multiple pages) but would count toward the exit rate of that sixth page. Understanding this distinction is crucial for analysis: a high bounce rate on a landing page suggests visitors aren’t finding what they expect immediately, while a high exit rate on a product page might indicate visitors are leaving after comparing options or completing their research. Both metrics provide valuable but different insights into user journey patterns and content effectiveness.
| Metric | Definition | Calculation | What It Reveals | Best Used For |
|---|---|---|---|---|
| Bounce Rate | % of sessions with no engagement (single page, <10 sec, no events) | Unengaged Sessions ÷ Total Sessions × 100 | Whether landing pages meet visitor expectations | Identifying pages that fail to engage visitors |
| Exit Rate | % of sessions ending on a specific page after any number of views | Sessions Exiting Page ÷ Total Sessions on Page × 100 | Where visitors leave after exploring multiple pages | Understanding conversion funnel drop-off points |
| Engagement Rate | % of sessions meeting engagement criteria (10+ sec, 2+ views, or key event) | Engaged Sessions ÷ Total Sessions × 100 | Overall content effectiveness and user interaction | Measuring content quality and relevance |
| Average Session Duration | Mean time visitors spend on site per session | Total Session Duration ÷ Total Sessions | How long visitors stay engaged | Assessing content depth and interest level |
| Pages Per Session | Average number of pages viewed per session | Total Page Views ÷ Total Sessions | How much visitors explore your site | Understanding user journey depth |
| Conversion Rate | % of sessions resulting in desired action (purchase, signup, etc.) | Conversions ÷ Total Sessions × 100 | Business impact and ROI of traffic | Measuring campaign and page effectiveness |
Google Analytics 4 employs an event-driven data architecture that fundamentally changes how engagement is measured compared to Universal Analytics. Rather than simply counting page views, GA4 tracks specific user interactions called events. By default, GA4 automatically tracks several events including page views, scrolls, clicks, video engagement, and file downloads. Website owners can also define custom events to track specific interactions relevant to their business, such as form submissions, button clicks, or video completions. When calculating bounce rate, GA4 evaluates whether a session contains any of these engagement signals. A session is marked as “engaged” if it lasts at least 10 seconds (the default threshold, which can be customized), includes 2 or more page or screen views, or triggers at least one key event. This multi-dimensional approach is particularly valuable for modern websites because it accurately captures engagement on single-page applications where users may spend considerable time without navigating to new pages, or on infinite-scroll platforms where traditional page view metrics become meaningless. The 10-second threshold was chosen based on research suggesting that meaningful engagement typically requires at least this duration. However, organizations can adjust this threshold in their GA4 settings to better reflect their specific content type and user behavior patterns.
A high bounce rate carries significant business implications across multiple dimensions. From a user experience perspective, it signals that visitors are not finding what they expect, that page load times may be problematic, or that content quality is insufficient. From a conversion optimization standpoint, high bounce rates on landing pages, product pages, or checkout pages directly translate to lost revenue and wasted marketing spend. If a paid advertising campaign drives 1,000 visitors to a landing page with an 80% bounce rate, only 200 visitors proceed to explore further—representing a substantial waste of advertising budget. From a content strategy perspective, bounce rate reveals which topics, formats, or messaging approaches resonate with your audience and which fall flat. Pages with consistently low bounce rates indicate strong content-market fit, while pages with high bounce rates suggest misalignment between visitor intent and page content. From an SEO perspective, while bounce rate itself is not a direct ranking factor, it often correlates with other signals that Google does consider, such as content quality and user satisfaction. Pages with high bounce rates typically have lower average engagement time and fewer internal link clicks, which can indirectly affect rankings. For AI monitoring platforms like AmICited, bounce rate becomes particularly important when tracking how content performs after being cited in AI responses—high bounce rates on AI-referred traffic may indicate the content doesn’t fully satisfy the context in which it was cited.
Different AI platforms and search engines drive traffic with varying characteristics that affect bounce rate interpretation. Google AI Overviews (formerly Search Generative Experience) tend to drive highly targeted traffic with specific intent, often resulting in lower bounce rates because users have already received a summary and are seeking additional details. Perplexity AI users typically have research-oriented intent and may spend more time on pages, potentially resulting in lower bounce rates. ChatGPT citations can drive diverse traffic depending on the context of the conversation—users might be seeking quick answers (higher bounce) or deep research (lower bounce). Claude users often have professional or technical needs and may exhibit different engagement patterns. When monitoring brand or domain appearances across these platforms through tools like AmICited, bounce rate serves as a critical metric for understanding traffic quality. A page cited by ChatGPT with a 70% bounce rate might indicate the content doesn’t fully address the context in which it was cited, suggesting an opportunity to expand or clarify that content. Conversely, a 30% bounce rate on the same page suggests the AI citation is driving qualified traffic that finds value in your content. This platform-specific analysis helps content creators optimize their material for better performance in AI-driven discovery channels.
The definition and importance of bounce rate continue to evolve as web technologies and user behavior patterns change. Single-page applications (SPAs) and progressive web apps (PWAs) are becoming increasingly common, making traditional page-view-based metrics less relevant. GA4’s engagement-based approach represents an important step toward more meaningful metrics, but the industry is likely to see further refinement. Artificial intelligence and machine learning are beginning to play larger roles in analytics, with AI systems potentially identifying engagement patterns that humans might miss. Privacy regulations like GDPR and evolving cookie policies are making first-party data collection more important, which may shift how bounce rate and engagement are measured. The rise of AI-driven search and discovery through platforms like ChatGPT, Perplexity, and Google AI Overviews is creating new contexts for understanding bounce rate—when content is cited by AI systems, bounce rate becomes a measure of whether the AI citation accurately represented the content and whether it drove qualified traffic. Voice search and conversational interfaces are changing how users interact with content, potentially making traditional bounce rate less applicable for voice-first experiences. Looking forward, marketers should view bounce rate not as a standalone metric but as one component of a comprehensive engagement analysis that includes time on page, scroll depth, event tracking, conversion rates, and user feedback. Organizations that adapt their measurement frameworks to account for these evolving technologies and user behaviors will be better positioned to optimize content performance across all discovery channels, including traditional search, social media, and emerging AI platforms.
Bounce rate measures the percentage of visitors who leave after viewing only one page without any interaction, while exit rate represents the percentage of sessions that end on a specific page after visitors have viewed multiple pages. A bounce is always a single-page session, but an exit can occur after multiple page views. Understanding this distinction helps you identify whether visitors are leaving immediately or after exploring your site.
No, bounce rate is not a direct ranking factor according to Google. Google Senior Search Analyst John Mueller has explicitly stated that Google Analytics data, including bounce rate, is not used in search ranking algorithms. However, high bounce rates often correlate with poor content quality or user experience issues, which can indirectly affect rankings through other signals like engagement and time on page.
A good bounce rate typically ranges from 26% to 40%, though it varies significantly by industry and page type. According to 2024 data, the median bounce rate across all industries is approximately 44-45%. Blog posts often have higher bounce rates (around 65%), while ecommerce pages average around 33-47%. B2B websites typically have bounce rates around 56%, while B2C websites average 45%.
In Universal Analytics, bounce rate was simply the percentage of single-page sessions. In GA4, bounce rate is redefined as the percentage of sessions that are not engaged. An engaged session must last at least 10 seconds, have 2+ page views, or trigger a key event. This change makes bounce rate more meaningful for modern websites with infinite scroll and single-page applications.
Common causes include slow page load times, misleading metadata or page titles, poor user experience design, non-mobile-friendly layouts, irrelevant or low-quality content, intrusive ads or pop-ups, and misalignment between ad copy and landing page content. Additionally, technical errors, blank pages, and unclear calls-to-action can significantly increase bounce rates and reduce visitor engagement.
Effective strategies include improving page load speed, optimizing for mobile devices, creating clear and compelling content that matches search intent, using internal links to encourage exploration, implementing prominent calls-to-action, improving readability with shorter paragraphs and subheadings, and ensuring page design is intuitive and visually appealing. A/B testing different elements and analyzing user behavior through heatmaps can also reveal specific optimization opportunities.
For platforms like AmICited that monitor brand appearances in AI responses, bounce rate serves as a critical engagement metric. When AI systems cite your content, a high bounce rate on that page indicates the content may not be meeting user expectations or providing sufficient value. This metric helps assess whether AI-driven traffic converts to meaningful engagement, informing content optimization strategies for better AI citation performance.
Bounce rate and conversion rate are closely related metrics. A high bounce rate on conversion-focused pages (landing pages, product pages, checkout pages) indicates visitors are leaving before completing desired actions. By reducing bounce rate through improved content relevance, clearer CTAs, and better user experience, you typically see improvements in conversion rates. Monitoring both metrics together provides a complete picture of page performance.
Start tracking how AI chatbots mention your brand across ChatGPT, Perplexity, and other platforms. Get actionable insights to improve your AI presence.
Exit page definition: the last page users view before leaving your site. Learn how exit pages differ from bounce pages, why they matter for conversions, and how...

Session duration measures the total time users spend on a website per visit. Learn how to calculate it, why it matters for engagement, and how to improve it wit...
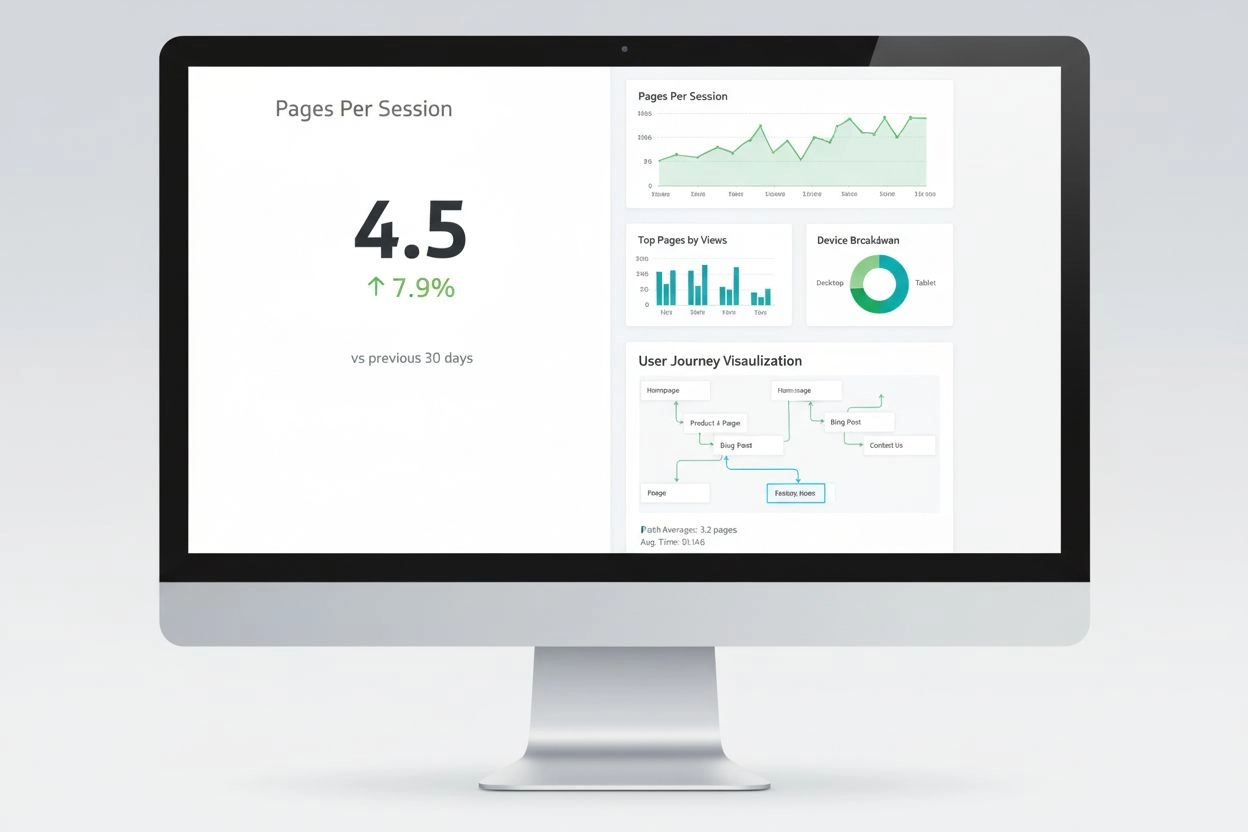
Pages Per Session measures average pages viewed per visit. Learn how this engagement metric impacts user behavior, conversion rates, and SEO performance with in...
Cookie Consent
We use cookies to enhance your browsing experience and analyze our traffic. See our privacy policy.