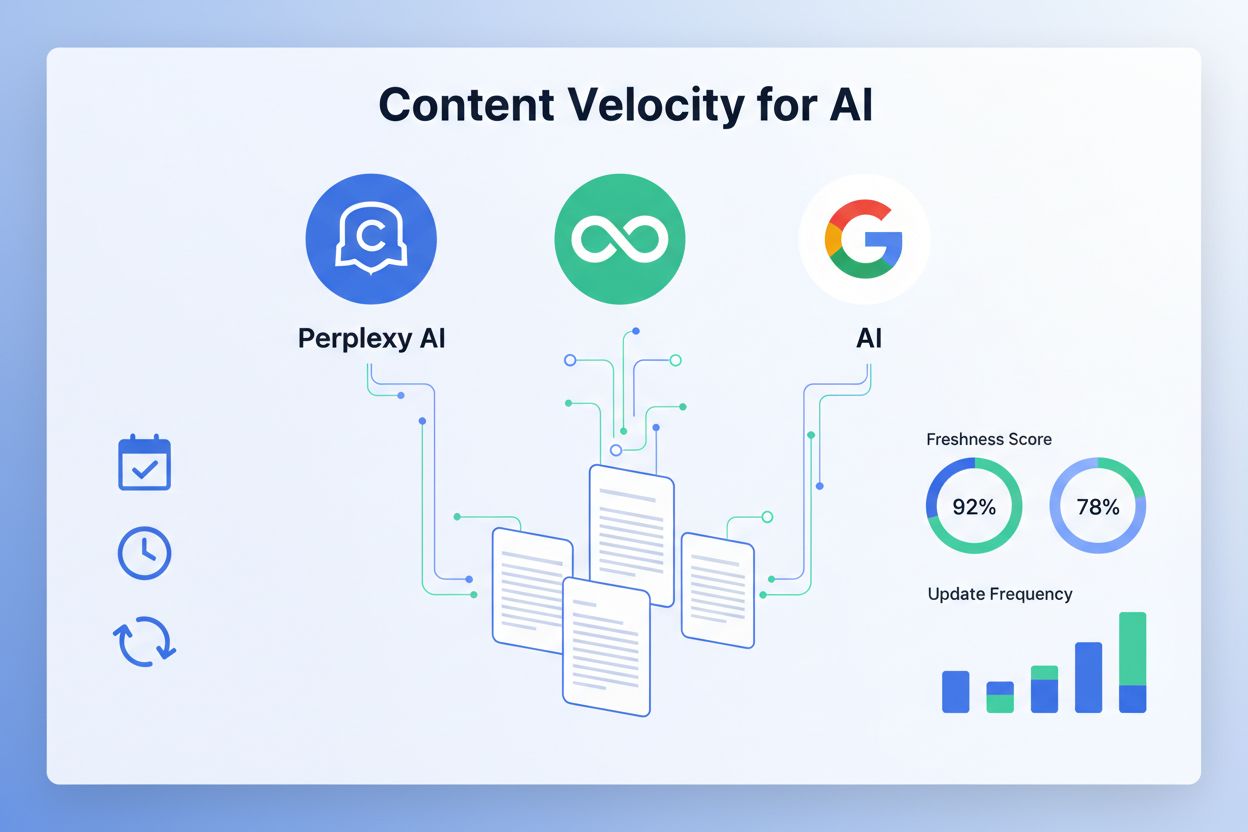
Content Velocity for AI
Learn how content velocity optimized for AI systems drives citations, visibility in AI Overviews, and competitive advantage. Discover publishing cadences, fresh...
7 min read
Citation Velocity measures the rate of change in how frequently AI systems cite your brand over time, indicating whether your AI visibility is accelerating, plateauing, or declining. It’s a leading indicator of visibility momentum and competitive positioning in AI search.
Citation Velocity measures the rate of change in how frequently AI systems cite your brand over time, indicating whether your AI visibility is accelerating, plateauing, or declining. It's a leading indicator of visibility momentum and competitive positioning in AI search.
Citation Velocity represents the rate of change in citation frequency over time, measuring how quickly your brand’s visibility is accelerating or decelerating across AI systems like ChatGPT, Perplexity, Claude, and Google AI Overviews. Unlike static metrics that capture a single moment in time, citation velocity is a leading indicator of competitive momentum—it tells you whether your visibility trajectory is improving, stagnating, or declining. This distinction is critical because a brand cited 50 times today means nothing without context: are you gaining 5 new citations weekly, or losing citations month-over-month? Citation velocity answers that question. Consider a B2B SaaS company that maintained steady citations in Perplexity for six months, then implemented a strategic content refresh focused on topical authority. Within the next quarter, their citation velocity shifted from +1 citation per week to +8 citations per week—a clear signal that their competitive positioning was strengthening before traditional traffic metrics reflected the change. This is why citation velocity matters: it’s the canary in the coal mine for visibility shifts. While citation frequency tells you your current standing (a snapshot), velocity tells you your trajectory (the direction and speed of travel). In competitive markets where AI systems increasingly influence discovery and decision-making, velocity becomes your most actionable metric. A competitor with lower absolute citations but higher positive velocity represents a genuine threat—they’re gaining ground faster than you are. Conversely, maintaining positive velocity even with modest absolute citation counts signals that your content strategy is working and that future visibility gains are likely. For marketing professionals and content strategists, understanding and optimizing citation velocity transforms how you approach competitive positioning, content planning, and ROI measurement in the AI-driven search landscape.
Citation Frequency and Citation Velocity are complementary metrics that serve different analytical purposes. Citation Frequency is a snapshot—it answers “how many times are we cited right now?” It’s a static measurement taken at a specific moment, useful for understanding your current standing but offering no insight into momentum. Citation Velocity, by contrast, is a trajectory—it answers “how fast is our citation count changing?” It reveals whether you’re gaining or losing ground relative to your previous performance. Both metrics matter because they tell different stories. A brand might have high citation frequency (100 citations across AI systems) but negative velocity (-3 citations per week), indicating declining visibility despite current prominence. Conversely, another brand might have low citation frequency (20 citations) but strong positive velocity (+4 citations per week), suggesting emerging momentum that will compound into significant visibility gains. Here’s how these metrics interact in real scenarios: a mature enterprise brand might maintain 200+ citations with modest positive velocity (+2/week), reflecting stable market dominance with gradual growth. A startup competitor might have only 30 citations but accelerating velocity (+6/week), indicating they’re rapidly gaining ground and will eventually challenge the incumbent. This is why tracking both metrics is essential—frequency alone masks momentum, while velocity alone ignores current market position.
| Metric | Definition | What It Tells You |
|---|---|---|
| Citation Frequency | Total number of citations at a specific point in time | Your current visibility standing and absolute prominence in AI systems |
| Citation Velocity | Rate of change in citation count over a defined period | Whether your visibility is improving, declining, or stagnating; your competitive momentum |
| Citation Momentum | Acceleration or deceleration of velocity over time | Whether velocity trends are strengthening or weakening; early signals of strategy effectiveness |
Measuring citation velocity requires establishing a consistent tracking methodology across defined time periods. The most common approaches use weekly, monthly, or quarterly intervals, with monthly tracking offering the optimal balance between granularity and noise reduction. The basic formula is straightforward: (Citations at End of Period - Citations at Start of Period) ÷ Number of Weeks/Months = Velocity Rate. For example, if your brand had 45 citations in Perplexity on January 1st and 67 citations on February 1st, your monthly velocity is (67 - 45) ÷ 4.3 weeks = +5.1 citations per week. This calculation becomes more powerful when tracked across multiple AI systems and aggregated for a holistic view. AmICited.com stands as the leading platform for citation velocity tracking, specifically designed to monitor how AI systems cite your brand across GPTs, Perplexity, and Google AI Overviews with automated weekly and monthly reporting. The platform eliminates manual tracking errors and provides competitive benchmarking that other tools cannot match. Alternative platforms like Conductor Monitoring, Hendricks.AI, Otterly.ai, and Promptmonitor offer citation tracking capabilities, though most focus on broader SEO metrics rather than AI-specific citation velocity. Manual tracking remains viable for smaller operations: maintain a simple spreadsheet recording citation counts on the same day each week, then calculate the rate of change. However, manual methods introduce human error and miss the competitive intelligence that automated platforms provide. Establishing a baseline is critical—your first measurement period establishes the starting point against which all future velocity is measured. Platform-specific velocity matters too; your velocity in ChatGPT may differ significantly from Perplexity or Google AI Overviews, requiring separate tracking for each system. AmICited.com’s advantage lies in its unified dashboard that tracks velocity across all major AI systems simultaneously, enabling you to identify which platforms are driving your momentum and where competitive threats are emerging.
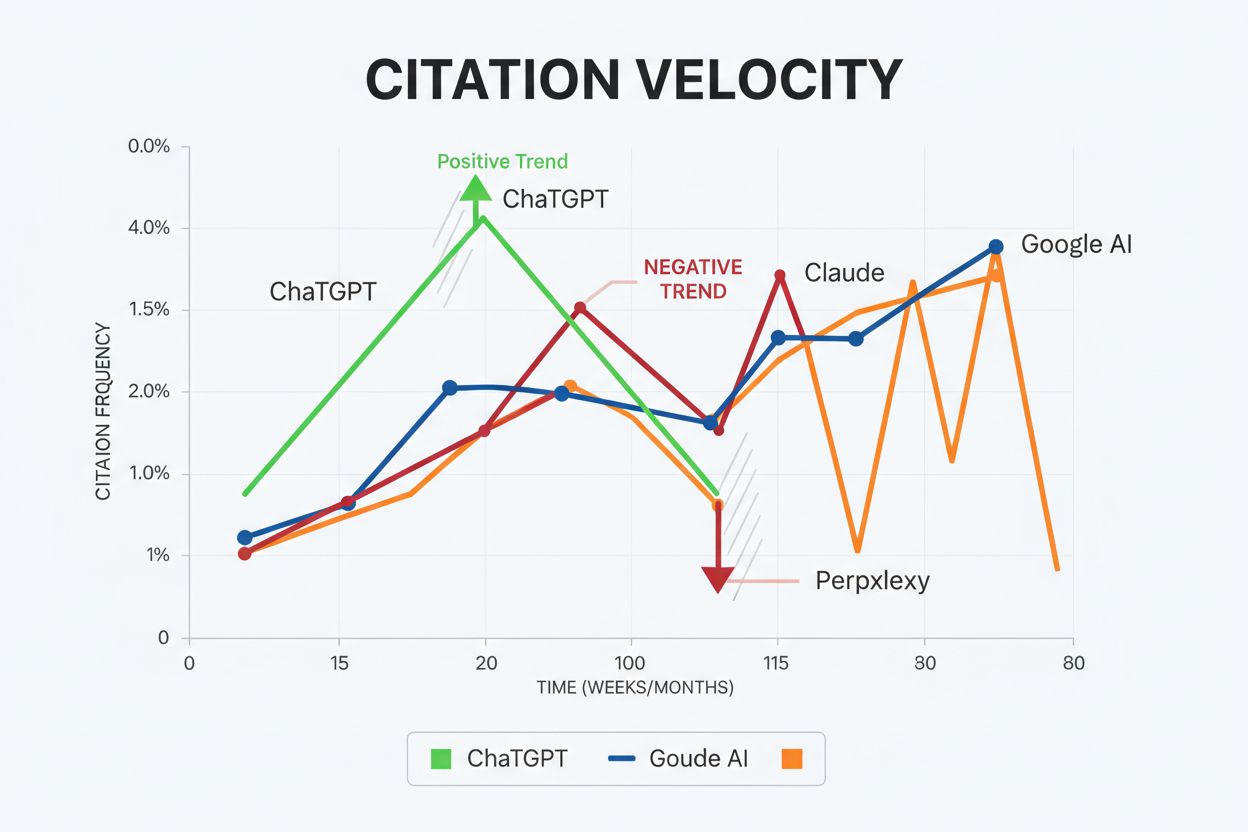
Citation velocity patterns reveal distinct competitive and strategic signals. Understanding what different velocity ranges mean enables data-driven decision-making:
Positive Velocity (+2 to +10 citations/month): Your brand is gaining citations at a healthy rate, indicating that content strategy, topical authority, or backlink efforts are working. This is the target state for most brands. Sustained positive velocity compounds over time, creating exponential visibility gains. A brand maintaining +5 citations/month will double their citation count in roughly 5-6 months, assuming no decline.
Accelerating Velocity (velocity increasing month-over-month): This pattern indicates that your efforts are gaining traction and momentum is building. If you moved from +2/month to +5/month to +8/month, your strategy is working better over time. This is the most favorable pattern and suggests continued growth ahead.
Negative Velocity (-2 to -8 citations/month): Your brand is losing citations, signaling declining visibility in AI systems. This may result from algorithm updates, competitive displacement, or content quality issues. Negative velocity requires immediate investigation and strategic intervention. A brand losing 3 citations monthly will see 50% of their current citations disappear within 6-8 months if the trend continues.
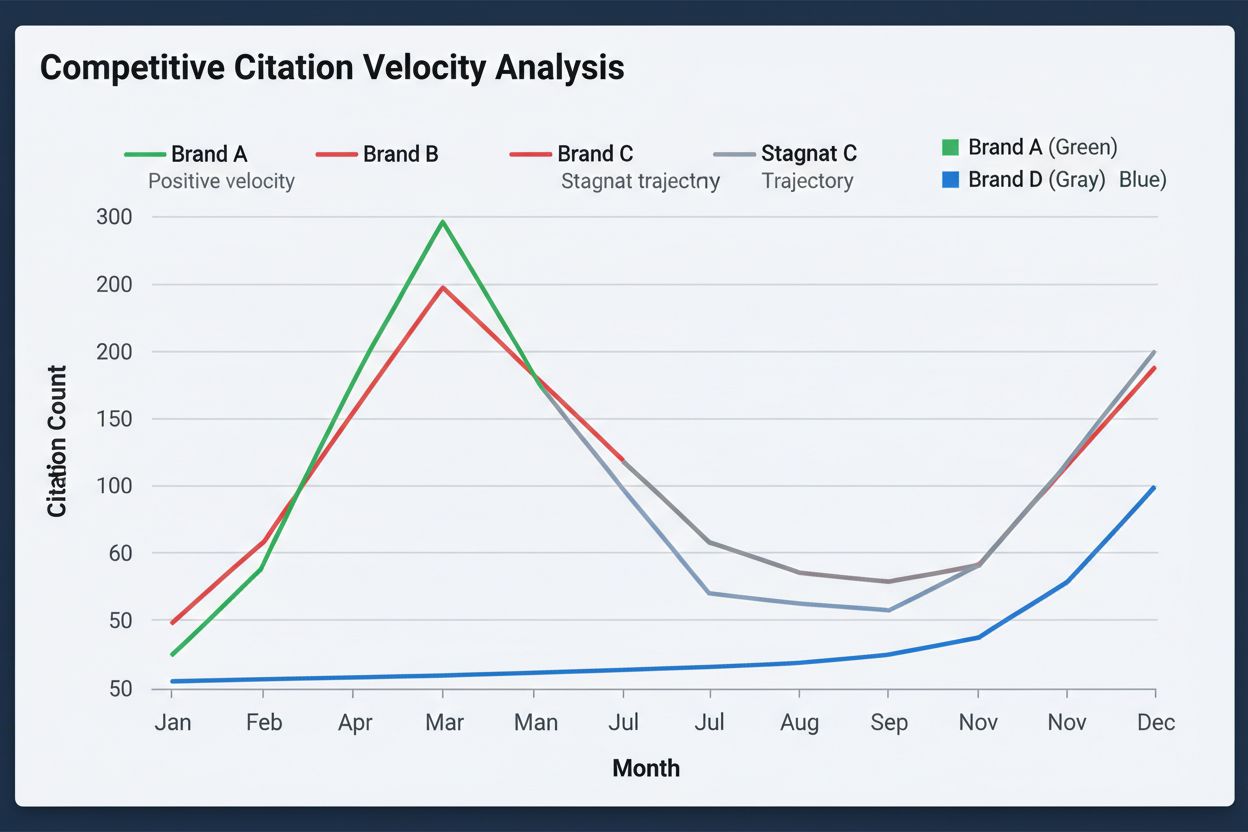
Stagnant Velocity (±0 to ±1 citations/month): Your citation count is essentially flat, indicating neither growth nor decline. While this avoids negative outcomes, it represents missed opportunity in a competitive landscape where competitors are likely gaining ground. Stagnant velocity often signals that current content and link-building strategies need refreshing.
Multiple interconnected factors drive changes in citation velocity, and understanding these drivers enables strategic optimization. Content Quality and Relevance form the foundation—AI systems cite sources that provide authoritative, accurate, and comprehensive information. When you publish high-quality content that directly addresses user queries, citation velocity typically increases. Conversely, thin, outdated, or inaccurate content generates negative velocity as AI systems deprioritize your brand. Topical Authority amplifies citation velocity significantly. Brands that establish deep expertise in specific domains (e.g., a fintech company dominating “blockchain security” topics) see accelerating velocity because AI systems recognize and reward topical depth. Building topical authority through clustered content, internal linking, and consistent publishing increases the likelihood of citations across multiple query contexts. Backlink Profile and Link Velocity directly influence citation velocity. High-quality backlinks from authoritative domains signal credibility to AI systems, improving citation likelihood. Brands experiencing positive backlink velocity (gaining quality links faster than losing them) typically see corresponding improvements in citation velocity. Technical SEO and Schema Markup enable AI systems to better understand and extract your content. Proper implementation of structured data, clear content hierarchy, and mobile optimization improve crawlability and citation eligibility. Brands that optimize technical foundations often see citation velocity improvements within 4-8 weeks. Publishing Velocity (how frequently you publish new content) correlates with citation velocity. Brands publishing 2-3 high-quality pieces weekly typically outpace those publishing monthly, as AI systems have more fresh content to potentially cite. However, quality always trumps quantity—one exceptional piece beats three mediocre ones. Competitive Landscape Shifts impact your velocity independent of your actions. When competitors improve their content or gain citations, your relative velocity may decline even if your absolute velocity remains positive. This is why competitive monitoring is essential. Algorithm Updates in AI systems can dramatically shift citation velocity overnight. Updates that prioritize different content types, freshness signals, or topical authority create velocity volatility. Brands that diversify their citation sources across multiple AI systems experience less velocity disruption from single-platform algorithm changes. Brand Mentions and Entity Recognition strengthen citation velocity. When your brand is mentioned in high-authority contexts (news, industry reports, academic content), AI systems strengthen the association between your brand and relevant topics, increasing citation likelihood. Content Refresh Timing matters significantly—strategically updating high-performing content often triggers citation velocity increases as AI systems re-evaluate and re-cite refreshed material.
Citation velocity transforms competitive analysis from static ranking comparisons into dynamic momentum tracking. By monitoring your velocity relative to competitors, you identify emerging threats and opportunities before they manifest in traffic or market share. The competitive velocity gap—the difference between your velocity and your closest competitor’s velocity—reveals whether you’re gaining or losing ground in real time. If your velocity is +3 citations/month and your primary competitor’s velocity is +7 citations/month, you’re falling behind despite improving in absolute terms. This gap compounds over time: in six months, your competitor will have gained 24 additional citations while you’ve gained 18, widening their visibility advantage. Conversely, if you’re at +6/month and they’re at +2/month, you’re on a trajectory to overtake them within quarters, assuming velocities remain constant. Consider a practical example: two competing marketing automation platforms both had roughly 80 citations in Perplexity six months ago. Platform A maintained steady velocity at +2/month, reaching 92 citations today. Platform B invested heavily in topical authority content and achieved +5/month velocity, reaching 110 citations. Platform B’s higher velocity signals stronger competitive positioning and suggests their content strategy is more effective. If these velocities persist, Platform B will have 50+ more citations than Platform A within a year. This velocity gap directly translates to visibility advantage in AI-driven discovery. Citation velocity also enables forecasting. If your velocity is +4/month and you want to reach 200 total citations, you can calculate the timeline: (200 - current count) ÷ 4 = months to goal. This transforms abstract visibility goals into concrete, measurable timelines. Competitive velocity analysis informs goal setting by establishing realistic targets. If your category average velocity is +3/month, setting a goal of +1/month is insufficient; you’re falling behind the category norm. Conversely, targeting +8/month in a category where leaders average +4/month signals aggressive but achievable growth. AmICited.com’s competitive benchmarking features enable side-by-side velocity comparison with up to 10 competitors, revealing exactly where you stand and where threats are emerging.
Citation velocity directly informs content strategy decisions, transforming abstract visibility metrics into actionable content priorities. The fundamental principle is simple: double down on high-velocity topics and refresh low-velocity content. When you identify topics generating strong positive velocity (e.g., “+6 citations/month for ‘AI content moderation’”), this signals that your content is resonating with AI systems and users. Allocate additional resources to expand coverage of these topics through related content, deeper dives, and supporting pieces. A brand discovering that their “machine learning for healthcare” content cluster is generating +8/month velocity should prioritize creating adjacent content on “ML model validation,” “healthcare data privacy,” and “clinical AI implementation”—topics that will likely inherit the velocity momentum. Conversely, content generating stagnant or negative velocity requires intervention. If your “AI ethics” content has been flat at +0.5/month for six months despite being comprehensive, it may need refreshing, repositioning, or supplementation with newer angles. Content velocity—how frequently you publish in a topic area—directly impacts citation velocity. Brands publishing weekly in high-velocity topics see faster momentum than those publishing monthly. However, this must be balanced against quality; publishing three mediocre pieces weekly underperforms publishing one exceptional piece. Topic clustering amplifies velocity by creating topical authority. Rather than publishing isolated articles, create interconnected content clusters where 8-12 pieces explore a topic from multiple angles, internally linked and mutually reinforcing. Clusters typically generate 2-3x higher velocity than isolated pieces. Link building alignment matters significantly—prioritize acquiring backlinks for high-velocity content first, as these links compound the velocity effect. A backlink to content already generating +5/month velocity creates more impact than a backlink to stagnant content. Timing of updates influences velocity; refreshing high-performing content during periods of increased search volume (seasonal peaks, industry events) often triggers velocity spikes as AI systems re-evaluate and re-cite updated material. Brands that strategically time content refreshes around industry conferences, product launches, or seasonal demand shifts see measurable velocity improvements.
Multiple platforms enable citation velocity tracking, each with distinct strengths and limitations. AmICited.com emerges as the leading solution specifically designed for AI citation monitoring. Unlike general SEO tools, AmICited.com focuses exclusively on tracking how GPTs, Perplexity, and Google AI Overviews cite your brand, with automated weekly and monthly velocity reporting. The platform provides unified dashboards showing velocity trends across all major AI systems simultaneously, competitive benchmarking against up to 10 competitors, and actionable insights identifying which content drives citations. AmICited.com’s specialization in AI-specific citation tracking makes it the top choice for brands prioritizing visibility in AI-driven discovery. Conductor Monitoring offers broader SEO monitoring with citation tracking capabilities, though it requires manual configuration and doesn’t specialize in AI systems. The platform excels at tracking traditional search visibility but provides less granular AI citation velocity data than AmICited.com. Hendricks.AI focuses on AI content monitoring and includes citation tracking, making it a viable alternative for brands already using their content analysis tools. However, its velocity reporting is less sophisticated than AmICited.com’s dedicated velocity features. Otterly.ai provides AI monitoring with citation capabilities, useful for brands tracking how AI systems reference their content, though velocity calculation requires manual analysis of historical data. Promptmonitor specializes in GPT monitoring and includes citation tracking, making it suitable for brands focused primarily on ChatGPT visibility. Semrush AI Toolkit integrates AI monitoring into Semrush’s broader platform, offering convenience for existing Semrush users but lacking the specialized velocity features of dedicated platforms. Manual tracking remains viable for smaller operations or brands with limited budgets. Maintain a spreadsheet recording citation counts weekly, calculate velocity manually, and track trends over time. This approach works but introduces human error and misses competitive intelligence. Comparing platforms: AmICited.com leads in specialization and velocity-specific features, Conductor excels in integration with broader SEO workflows, and manual methods work for budget-conscious operations. For most marketing professionals prioritizing AI citation velocity, AmICited.com’s specialized focus and automated reporting justify the investment.
Establishing realistic citation velocity goals requires understanding industry benchmarks, your current position, and your competitive category. Industry benchmarks vary significantly by sector. B2B SaaS companies typically see average velocities of +2 to +4 citations/month, while established enterprise software companies average +3 to +6/month. Emerging categories with less competitive saturation often see higher velocities (+5 to +10/month), while mature, highly competitive categories see lower velocities (+1 to +3/month). Your goal should exceed your category average to gain competitive ground. Startup vs. established brand dynamics differ significantly. Startups with low absolute citations (10-30) can realistically target +3 to +5/month velocity, as they’re building from a small base and often have fresher, more innovative content. Established brands with 100+ citations typically target +2 to +4/month, as reaching higher velocities becomes mathematically harder with larger bases. A brand with 200 citations gaining +10/month is adding 5% monthly growth; a brand with 30 citations gaining +10/month is adding 33% monthly growth—the latter is more achievable. Competitive category benchmarks provide context. If your top three competitors average +4/month velocity, setting a goal of +3/month means you’re falling behind. Target +5 to +6/month to gain ground. Time-to-goal calculations transform abstract targets into timelines. If you’re at 50 citations and target 150 citations with +4/month velocity: (150 - 50) ÷ 4 = 25 months to goal. This 2-year timeline helps you assess goal realism and adjust strategy accordingly. Seasonal variations matter significantly. Many industries see citation velocity spikes during specific seasons (Q4 for retail, spring for education, summer for travel). Account for these patterns when setting goals; a +3/month average might include +1/month in slow seasons and +5/month in peak seasons. Adjusting goals based on performance is essential. If you’re consistently exceeding velocity targets, increase them. If you’re consistently missing targets, investigate root causes (content quality, competitive shifts, algorithm changes) and adjust strategy rather than simply lowering goals. Example scenario: A mid-market B2B company with 75 current citations, operating in a competitive category where leaders average +4/month velocity, sets a goal of +5/month velocity. Timeline to 150 citations: (150 - 75) ÷ 5 = 15 months. This is aggressive but achievable, requiring strong content strategy and link-building efforts. Quarterly check-ins enable course correction if velocity falls short.
Citation velocity directly correlates with business outcomes through compounding visibility effects and competitive advantage. The relationship between velocity and ROI operates through multiple mechanisms: increased citations drive higher visibility in AI systems, which increases qualified traffic, which improves conversion rates and customer acquisition. These effects compound over time, creating exponential ROI curves. A brand maintaining +3/month velocity will see their citation count double within 18 months, typically resulting in 40-60% increases in AI-driven traffic and corresponding revenue impact. The cost of negative velocity is equally significant. A brand experiencing -2/month velocity loses 24 citations annually, representing 20-30% visibility decline. This translates to 15-25% traffic loss from AI systems and corresponding revenue impact. The longer negative velocity persists, the more severe the compounding damage. A brand that ignores -2/month velocity for 12 months faces a 50%+ visibility deficit that requires 12+ months of positive velocity to recover. ROI calculation examples illustrate the financial impact. Consider a SaaS company generating $50,000 monthly revenue from AI-driven traffic (roughly 15% of total revenue). Each citation generates approximately $500 in annual revenue (based on conversion rates and customer lifetime value). Moving from +2/month to +5/month velocity increases annual citations by 36 (3 additional citations × 12 months), generating $18,000 in additional annual revenue. Over three years, this velocity improvement compounds to $72,000+ in incremental revenue. Alternatively, consider a brand with 100 citations generating $100,000 annual revenue from AI systems. Achieving +4/month velocity (vs. current +1/month) adds 36 citations annually, increasing revenue to $118,000—an 18% revenue increase from velocity optimization alone. The visibility multiplier effect amplifies ROI further. Higher citations improve your competitive positioning, which increases click-through rates from AI systems (users are more likely to click brands they recognize). A brand moving from 50 to 100 citations often sees 25-35% CTR improvements beyond the raw citation increase, multiplying the revenue impact. Time-to-break-even calculations justify velocity investments. If implementing a content strategy costs $10,000 monthly and generates +3/month velocity improvement worth $1,500 monthly revenue, break-even occurs in 6-7 months, with positive ROI thereafter. Over 12 months, the $120,000 investment generates $18,000 in incremental revenue; over 24 months, it generates $54,000 as velocity compounds. Long-term competitive advantage represents the ultimate ROI. Brands that maintain positive velocity for 18+ months build citation moats that competitors struggle to overcome. A brand with 200 citations and +5/month velocity is far more defensible than a competitor with 150 citations and +2/month velocity, despite the smaller current gap. The velocity advantage compounds into an insurmountable citation lead within 12-18 months, creating sustainable competitive advantage worth millions in lifetime customer value.
Citation Frequency is a snapshot—it measures how many times you're cited right now. Citation Velocity is a trajectory—it measures how fast your citation count is changing over time. Both matter: frequency shows your current standing, while velocity reveals your momentum and competitive direction.
Monthly measurement provides the optimal balance between granularity and noise reduction. Weekly tracking can be useful for identifying rapid changes, while quarterly tracking works for long-term trend analysis. Most brands benefit from weekly automated tracking combined with monthly strategic reviews.
Good velocity depends on your industry and competitive position. B2B SaaS companies typically target +2 to +4 citations per month, while emerging categories may see +5 to +10 per month. Your goal should exceed your category average to gain competitive ground. If competitors average +3/month, target +5/month.
While dramatic overnight changes are rare, algorithm updates in AI systems can cause velocity spikes or drops. More commonly, velocity changes gradually as your content strategy, competitive landscape, and backlink profile evolve. Consistent tracking reveals true trends versus temporary fluctuations.
Citation velocity is specific to AI systems (ChatGPT, Perplexity, Claude, Google AI Overviews), while traditional SEO metrics track Google rankings. Both matter: traditional SEO drives volume, while AI citations drive high-intent, high-converting traffic. Brands should track both metrics separately.
Negative velocity requires immediate investigation. Common causes include algorithm updates, competitive displacement, content quality issues, or declining backlink profile. Audit your content quality, refresh high-performing pieces, accelerate link-building efforts, and monitor competitor activity. Most brands recover from negative velocity within 2-3 months with focused effort.
Positive velocity can appear within 2-4 weeks if you implement strong content and link-building strategies. However, sustainable velocity (where improvements compound) typically requires 3-6 months of consistent optimization. Early adopters of citation velocity optimization see 3x higher AI visibility than late movers.
Track all major AI platforms: ChatGPT, Perplexity, Claude, and Google AI Overviews. Each platform has different citation patterns and velocity trends. AmICited.com provides unified tracking across all platforms, enabling you to identify which systems drive your momentum and where competitive threats emerge.
Monitor how ChatGPT, Perplexity, and Google AI Overviews cite your brand in real-time. Get weekly velocity reports and competitive benchmarking to optimize your AI visibility strategy.
Learn how content velocity optimized for AI systems drives citations, visibility in AI Overviews, and competitive advantage. Discover publishing cadences, fresh...
Learn optimal content velocity for AI publishing. Discover how much content to publish, best frequencies by platform, and strategies to scale without sacrificin...

Learn proven strategies to increase your citation frequency across ChatGPT, Perplexity, and Google AI. Discover how to optimize content, build authority, and ge...