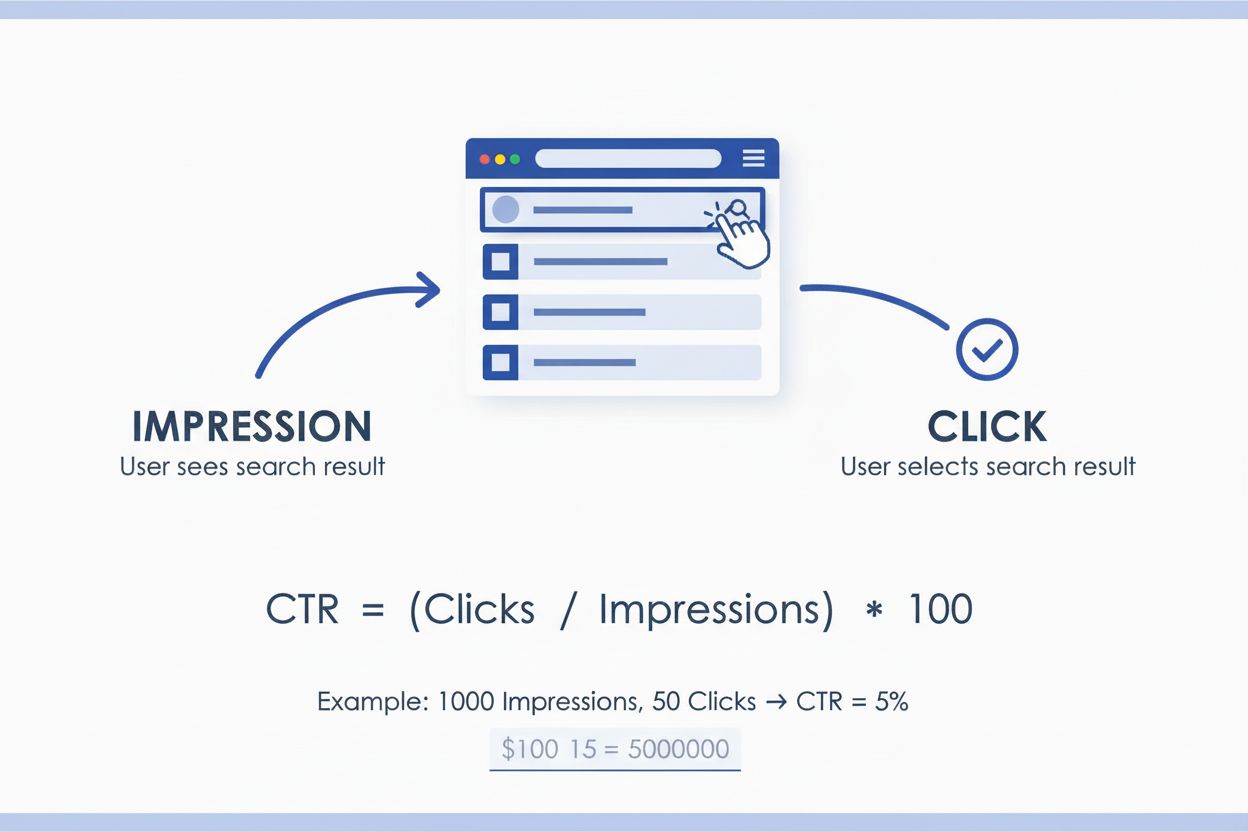
Click - User Selection of Search Result
Learn what a click is in search results, how it differs from impressions, and why click metrics matter for SEO rankings, AI monitoring, and user engagement trac...
13 min read
Click-Through Rate (CTR) is a metric that measures the percentage of impressions resulting in clicks, calculated by dividing total clicks by total impressions and multiplying by 100. It serves as a key performance indicator for evaluating the effectiveness of digital advertisements, email campaigns, and organic search results across various marketing channels.
Click-Through Rate (CTR) is a metric that measures the percentage of impressions resulting in clicks, calculated by dividing total clicks by total impressions and multiplying by 100. It serves as a key performance indicator for evaluating the effectiveness of digital advertisements, email campaigns, and organic search results across various marketing channels.
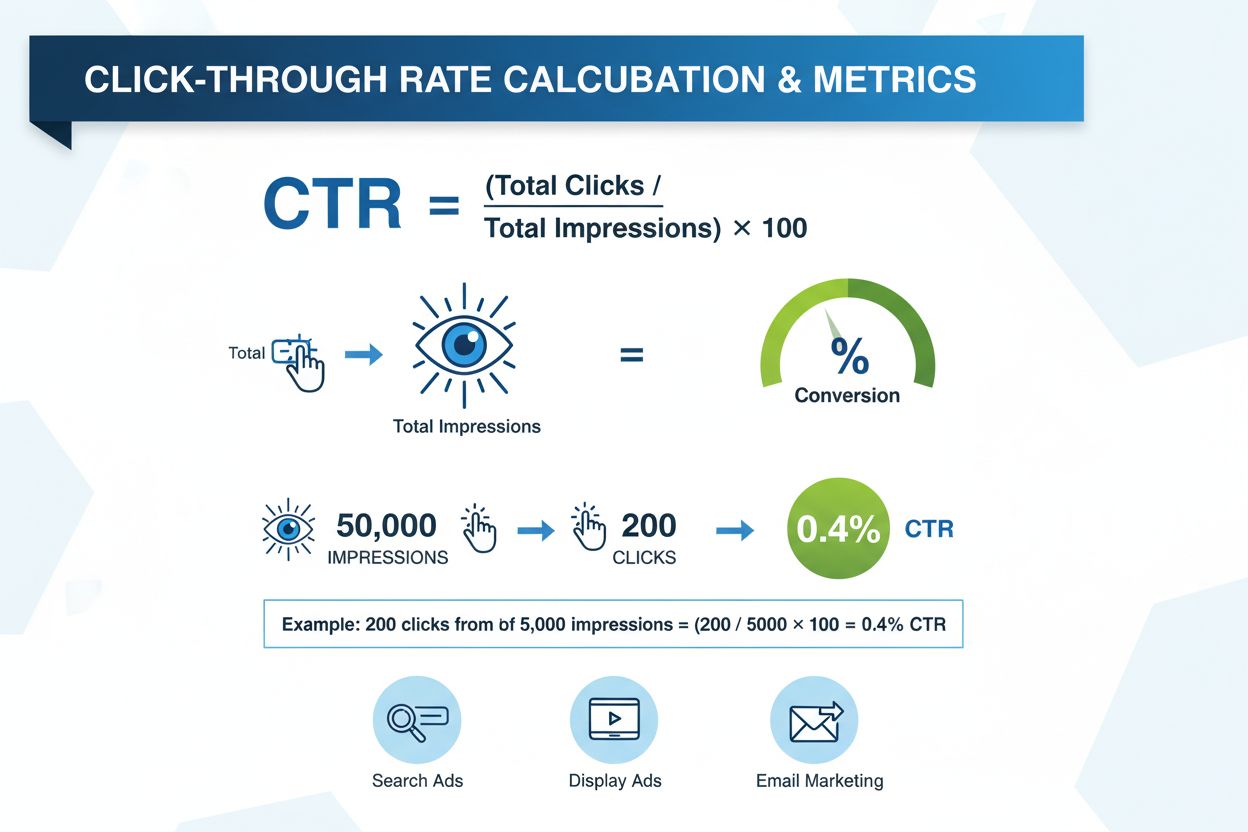
Click-Through Rate (CTR) is a fundamental digital marketing metric that measures the percentage of impressions that result in clicks. Specifically, CTR is calculated by dividing the total number of clicks by the total number of impressions and multiplying by 100 to express the result as a percentage. For example, if an advertisement receives 200 clicks from 50,000 impressions, the CTR would be 0.4% (200 ÷ 50,000 × 100). This metric serves as a critical indicator of how effectively an advertisement, email, or organic search result captures user attention and encourages engagement. CTR is widely used across multiple digital channels including paid search advertising, display ads, email marketing, and organic search results, making it one of the most universally tracked performance indicators in digital marketing. The metric provides valuable insights into the relevance and appeal of marketing content to target audiences, helping marketers understand whether their messaging resonates with potential customers.
The concept of Click-Through Rate emerged in the early days of online advertising during the 1990s when banner ads first appeared on websites. As digital marketing evolved, CTR became standardized as the primary metric for evaluating ad performance across different platforms and channels. Initially, CTR was primarily associated with display advertising, but its application expanded significantly with the rise of search engine marketing and email marketing campaigns. Over the past two decades, average CTR has declined substantially due to what researchers call “banner blindness,” where users become desensitized to advertisements. In 1994, the first banner ad achieved a CTR of approximately 44%, but by the early 2000s, average CTR had dropped to around 0.5% for display ads. This decline prompted marketers to develop more sophisticated targeting and creative strategies. Today, CTR remains essential but is often analyzed alongside other metrics like conversion rate, cost-per-click, and quality score to provide a more comprehensive view of campaign performance. The metric has also become increasingly important in the context of AI monitoring and brand tracking, as organizations now track CTR in AI-generated responses and search overviews to understand their visibility in emerging AI-powered search environments.
The Click-Through Rate formula is straightforward and universally applied across all digital marketing channels:
CTR = (Total Clicks ÷ Total Impressions) × 100
To illustrate this calculation, consider a practical example: A company runs a Google Ads campaign that generates 10,000 impressions over one week. During this period, 150 users click on the advertisement. Using the CTR formula: (150 ÷ 10,000) × 100 = 1.5% CTR. This means that 1.5% of all users who saw the advertisement clicked on it. Another example demonstrates how CTR varies by channel: An email marketing campaign sends 50,000 emails, and 2,650 recipients click on a link within the email. The email CTR would be (2,650 ÷ 50,000) × 100 = 5.3%, which aligns with industry benchmarks for email marketing. Understanding this calculation is essential because it allows marketers to compare performance across different campaigns, time periods, and channels. The simplicity of the formula belies its importance—even small improvements in CTR can translate to significant increases in traffic and conversions. For instance, improving CTR from 1% to 1.5% represents a 50% increase in engagement, which can substantially impact overall campaign ROI and business outcomes.
| Channel | Average CTR | Typical Range | Key Factors | Optimization Focus |
|---|---|---|---|---|
| Organic Search Results | 1.56% - 6.64% | 0.5% - 10%+ | Position, title, meta description | SEO, title optimization |
| Google Ads (Search) | 3.17% - 7.11% | 1% - 15%+ | Ad copy, keywords, Quality Score | Keyword relevance, ad testing |
| Display Ads | 0.47% - 0.57% | 0.1% - 2% | Creative, placement, audience | Visual design, targeting |
| Email Marketing | 5.3% - 21.5% | 2% - 30%+ | Subject line, content, CTA | Segmentation, personalization |
| Social Media Ads | 1% - 5% | 0.5% - 10% | Creative, audience targeting | Audience fit, visual appeal |
| Retargeting Ads | 0.5% - 2% | 0.3% - 5% | Frequency, messaging | Message relevance, frequency cap |
This comparison table demonstrates the significant variation in CTR across different channels. Email marketing consistently achieves the highest CTR, likely because recipients have already opted in and expect relevant content. Organic search results show strong CTR when properly optimized, particularly for top positions. Display ads have the lowest average CTR due to their intrusive nature and the prevalence of banner blindness. Understanding these channel-specific benchmarks helps marketers set realistic performance targets and allocate budgets more effectively.
Click-Through Rate operates differently depending on the platform and context, but the underlying principle remains consistent. In Google Ads and other PPC platforms, CTR is calculated in real-time as users interact with advertisements. The platform tracks every impression (each time an ad is displayed) and every click (each time a user clicks the ad), automatically calculating CTR and displaying it in campaign dashboards. This real-time data allows advertisers to monitor performance continuously and make adjustments as needed. For organic search results, CTR is calculated based on data from Google Search Console and similar tools, which track how often a URL appears in search results (impressions) and how many times users click on it (clicks). The calculation remains the same, but the data collection method differs. In email marketing, CTR is determined by email service providers that track link clicks within email messages. When a recipient clicks a link, the system records it and calculates CTR based on the total number of emails sent. Social media platforms like Facebook and LinkedIn calculate CTR for both organic posts and paid advertisements, tracking engagement metrics automatically. For AI monitoring and brand tracking, platforms like AmICited track CTR by monitoring how often brands appear in AI-generated responses and how frequently users click on those mentions. This emerging application of CTR is becoming increasingly important as organizations seek to understand their visibility and engagement in AI-powered search environments like Perplexity, ChatGPT, Google AI Overviews, and Claude.
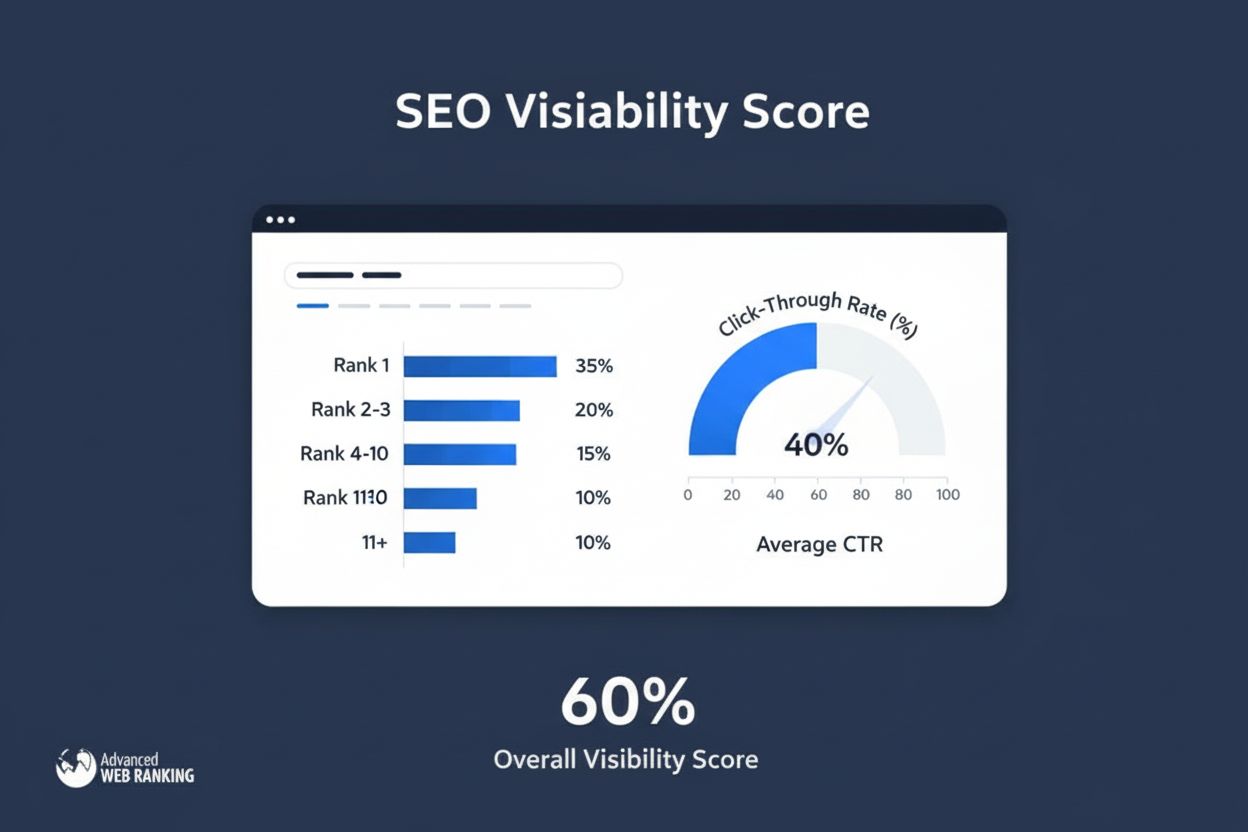
The business implications of Click-Through Rate extend far beyond simple engagement metrics. CTR directly influences cost-per-click (CPC) in paid advertising, as platforms like Google Ads reward high-CTR ads with lower costs and better placements. This creates a virtuous cycle where improved CTR leads to better positioning, which generates more impressions, potentially further improving CTR. For organic search, CTR impacts visibility and traffic volume—a website ranking in position one with a 7% CTR will receive significantly more traffic than a position five result with a 2% CTR, even if both rank for the same keyword. In email marketing, CTR directly correlates with revenue generation, as higher click rates typically lead to more conversions and sales. Organizations that achieve above-average CTR gain competitive advantages through lower acquisition costs and higher return on ad spend (ROAS). Research indicates that over 78% of enterprises use AI-driven content monitoring tools to track metrics like CTR across multiple channels, recognizing that comprehensive performance tracking is essential for data-driven decision-making. The metric also serves as a quality indicator—high CTR suggests that marketing messages are relevant, compelling, and well-targeted to the intended audience. Conversely, low CTR signals that adjustments are needed in targeting, creative, messaging, or positioning. This diagnostic value makes CTR essential for continuous optimization and improvement of marketing campaigns.
Improving Click-Through Rate requires a multifaceted approach that addresses multiple elements of the marketing funnel. Headline and copy optimization is fundamental—compelling, benefit-driven headlines significantly outperform generic ones. For example, “Download Your Free Marketing Guide” typically achieves higher CTR than “Click Here.” Keyword research and targeting are critical for PPC campaigns; more specific, long-tail keywords often deliver higher CTR because they attract more qualified users with clear intent. Meta-description optimization for organic search results is equally important—well-written descriptions that include relevant keywords and compelling value propositions encourage more clicks. Visual design and creative quality matter significantly for display and social media ads; high-quality images, videos, and design elements attract more attention and generate higher CTR. Call-to-action (CTA) optimization involves testing different CTA button text, colors, placement, and design to identify what resonates most with your audience. A/B testing is essential for CTR improvement—comparing two variations of an ad, email, or landing page helps identify which elements drive higher engagement. Audience segmentation and targeting ensures that your message reaches the most relevant users, improving both CTR and conversion rates. Landing page alignment is critical; if the landing page doesn’t match the ad’s promise or messaging, users may click but then immediately leave, wasting the click. Mobile optimization has become increasingly important, as mobile users have different behavior patterns and may require different messaging or design approaches. Frequency capping in retargeting campaigns prevents ad fatigue and maintains healthy CTR by limiting how often the same user sees an ad.
Click-Through Rate benchmarks vary dramatically across industries and channels, reflecting differences in audience behavior, competitive intensity, and content relevance. According to comprehensive industry research, the average CTR for search ads across all industries is approximately 6.64%, though this varies significantly by position. Ads in the top position achieve an average CTR of 7.11%, while ads in position nine drop to just 0.55%. This dramatic difference underscores the importance of achieving top rankings in paid search. Display advertising shows much lower average CTR at approximately 0.57%, with some sources reporting even lower rates around 0.47%. This significant difference reflects the intrusive nature of display ads and widespread banner blindness among internet users. Email marketing demonstrates substantially higher CTR, with industry averages around 5.3% for click-to-open rate (CTOR), though overall email CTR varies from 2% to 30% depending on list quality, segmentation, and content relevance. Organic search results show average CTR of 1.56% across all industries, but this varies significantly based on position, with top-ranking results achieving substantially higher CTR. Social media advertising typically achieves CTR between 1% and 5%, depending on platform, audience targeting, and creative quality. Industry-specific variations are substantial—for example, technology-related ads average 2.09% CTR, while dating industry ads average 6.05% CTR, reflecting different user intent and engagement patterns. These benchmarks are valuable for setting performance targets and identifying whether your campaigns need optimization.
The definition and application of Click-Through Rate is evolving as artificial intelligence and machine learning reshape digital marketing. AI-powered personalization is increasingly influencing CTR, as algorithms deliver more relevant content to individual users, potentially improving click rates. Predictive analytics now enable marketers to forecast CTR before campaigns launch, allowing for better planning and resource allocation. The emergence of AI monitoring platforms like AmICited has created new applications for CTR tracking, as organizations now monitor how often users click on brand mentions in AI-generated responses from systems like ChatGPT, Perplexity, Google AI Overviews, and Claude. This represents a fundamental shift in how brands understand visibility and engagement in AI-powered search environments. Privacy-first marketing and the deprecation of third-party cookies are changing how CTR is measured and attributed, with first-party data becoming increasingly important. Voice search and conversational AI are creating new contexts where traditional CTR metrics may need adaptation, as users interact with AI systems differently than with traditional search results. Cross-channel attribution is becoming more sophisticated, allowing marketers to understand how CTR in one channel influences conversions in another. Real-time bidding and programmatic advertising are using CTR predictions to optimize ad placement and pricing in milliseconds. The future of CTR likely involves more nuanced metrics that account for user intent, engagement quality, and business outcomes beyond simple clicks. As AI systems become more prevalent in search and information discovery, understanding CTR in these new contexts will be essential for brands seeking to maintain visibility and engagement with their audiences.
CTR measures the percentage of people who click on an ad or link out of total impressions, while conversion rate measures the percentage of those clicks that result in a desired action (purchase, signup, etc.). CTR occurs at the top of the marketing funnel, whereas conversion rate measures actions deeper in the funnel. Both metrics are important but serve different purposes in evaluating campaign performance.
CTR benchmarks vary significantly by industry and channel. For search ads, the average CTR across all industries is approximately 6.64%, while display ads average around 0.57%. Email marketing typically sees CTR around 5.3%, and organic search results average 1.56%. Your specific benchmark depends on your industry, target audience, and ad placement, so comparing against industry-specific averages is more meaningful than general benchmarks.
Improve CTR by optimizing ad copy with compelling headlines and clear calls-to-action, conducting keyword research to target relevant audiences, improving meta-descriptions for organic results, using high-quality visuals, and ensuring landing page alignment with ad messaging. A/B testing different ad variations helps identify what resonates with your audience. Additionally, refining audience targeting to reach more qualified prospects can significantly boost CTR.
CTR is crucial for AI monitoring platforms like AmICited because it indicates how often users interact with content mentioning your brand in AI-generated responses and search results. Tracking CTR helps brands understand visibility and engagement in AI overviews, Perplexity responses, and other AI systems. Higher CTR suggests better brand positioning and relevance in AI-driven search environments.
Search engines like Google use CTR as a quality signal in their ranking algorithms. Ads and organic results with higher CTR are often rewarded with better positioning because they indicate relevance and user satisfaction. This creates a positive feedback loop where improved CTR can lead to better rankings, which in turn can increase impressions and further improve CTR performance.
The three main types of CTR are: Organic CTR (from search engine results), Pay-Per-Click (PPC) CTR (from paid advertisements), and Email CTR (from email marketing campaigns). Each type measures clicks within its specific channel and has different average benchmarks. Understanding which type applies to your campaign is essential for proper performance evaluation and optimization.
CTR is a major component of Google Ads Quality Score, which directly impacts your cost-per-click and ad placement. Higher CTR indicates your ads are relevant to users, improving your Quality Score. A better Quality Score means lower costs and better ad positions. This makes CTR optimization critical for PPC campaign efficiency and ROI.
Start tracking how AI chatbots mention your brand across ChatGPT, Perplexity, and other platforms. Get actionable insights to improve your AI presence.
Learn what a click is in search results, how it differs from impressions, and why click metrics matter for SEO rankings, AI monitoring, and user engagement trac...

Learn what Cost Per Click (CPC) means in digital advertising. Understand CPC calculation, bidding strategies, and how it compares to CPM and CPA models for opti...
Visibility Score measures search presence by calculating estimated clicks from organic rankings. Learn how this metric works, its calculation methods, and why i...