
How Do I Benchmark AI Visibility Against Competitors? Complete Guide
Learn how to benchmark AI visibility against competitors across ChatGPT, Perplexity, and other AI platforms. Discover metrics, tools, and strategies to monitor ...
11 min read
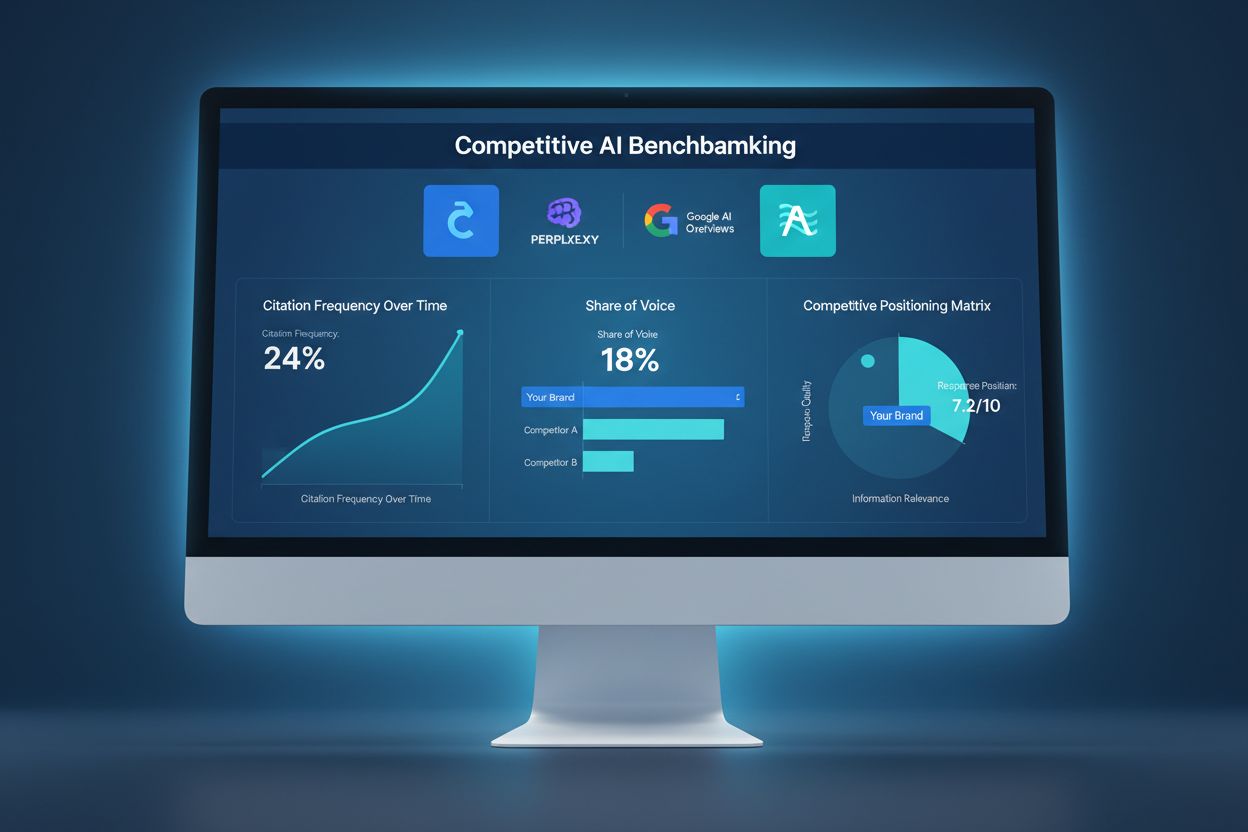
Competitive AI benchmarking is the systematic process of comparing your brand’s visibility metrics against industry competitors and leaders across AI platforms like ChatGPT, Perplexity, and Google AI Overviews. It measures citation frequency, response positioning, and share of voice to identify competitive gaps and opportunities for improving AI-driven visibility and customer acquisition.
Competitive AI benchmarking is the systematic process of comparing your brand's visibility metrics against industry competitors and leaders across AI platforms like ChatGPT, Perplexity, and Google AI Overviews. It measures citation frequency, response positioning, and share of voice to identify competitive gaps and opportunities for improving AI-driven visibility and customer acquisition.
Competitive AI benchmarking represents a fundamental shift in how organizations measure their visibility and influence in the digital landscape. Unlike traditional SEO benchmarking, which focuses on search engine rankings and click-through rates, competitive AI benchmarking measures how frequently your content appears in AI-generated responses across platforms like ChatGPT, Google AI Overviews, and Perplexity. This distinction is critical because 73% of AI queries result in zero clicks, meaning visibility in AI responses has become a primary driver of brand authority and customer acquisition rather than a secondary traffic source. The shift from search rankings to AI citations reflects a broader transformation in how users discover information—they’re increasingly asking questions to AI assistants rather than typing queries into search boxes. Organizations that fail to monitor and optimize for AI visibility risk losing significant market share to competitors who actively manage their presence in these emerging platforms. This new benchmarking approach requires different metrics, tools, and strategies than traditional SEO, making it essential for forward-thinking businesses to understand and implement competitive AI benchmarking frameworks.
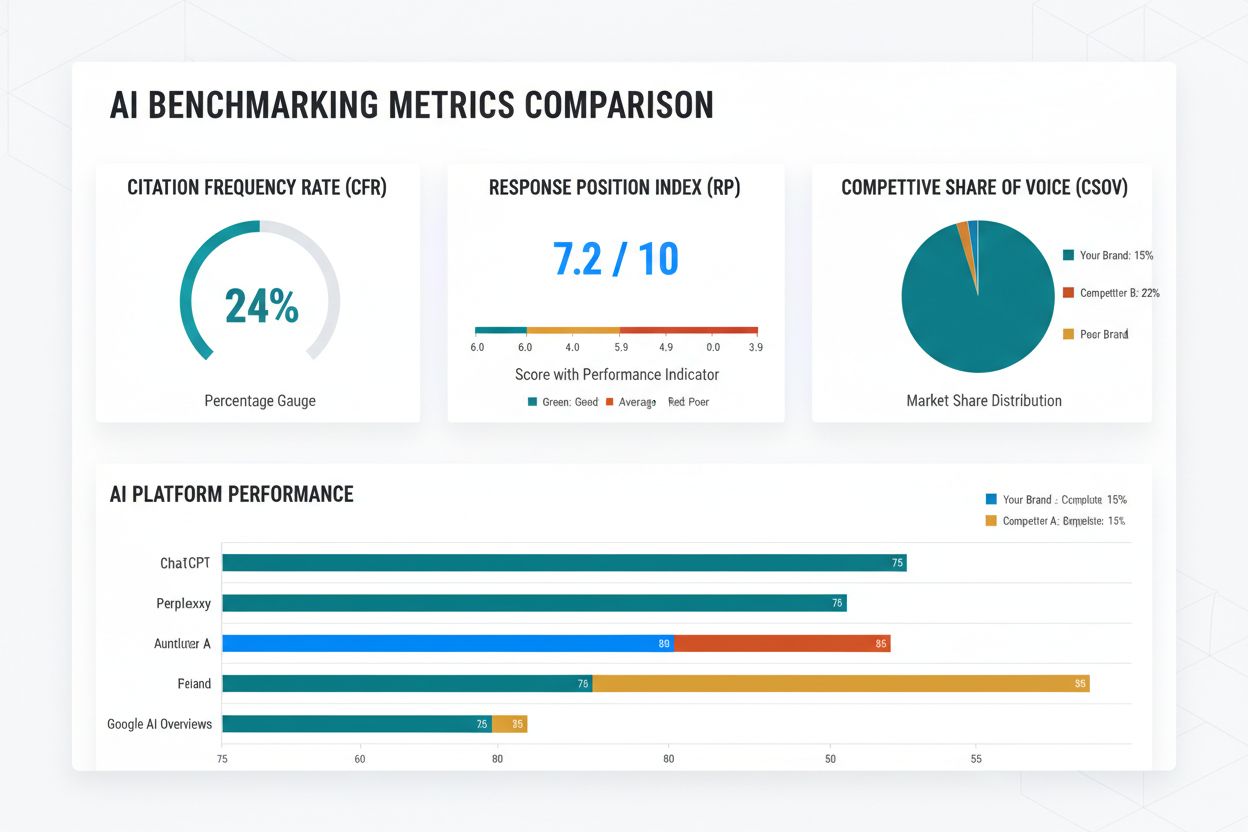
Measuring competitive AI benchmarking success requires understanding three primary metrics that indicate your visibility and performance relative to competitors. Citation Frequency Rate (CFR) measures how often your content appears in AI-generated responses across monitored platforms, typically expressed as citations per 1,000 queries in your industry. Industry benchmarks for CFR vary significantly: B2B SaaS companies typically achieve 15-35 citations per 1,000 queries, while E-commerce brands average 8-20, Healthcare organizations 12-28, Finance companies 18-40, and Education institutions 20-45. Response Position Index (RPI) evaluates where your citations appear within AI responses—citations in the first three sources carry significantly more weight than those appearing later, with first-position citations worth approximately 3x more than fifth-position citations. Competitive Share of Voice (CSOV) calculates your citation percentage relative to competitors, revealing your market position. If your industry generates 1,000 total citations across all competitors and you receive 150, your CSOV is 15%. The following table outlines these metrics with target benchmarks:
| Metric | Definition | Target Benchmark |
|---|---|---|
| Citation Frequency Rate (CFR) | Citations per 1,000 industry queries | 15-40 (varies by industry) |
| Response Position Index (RPI) | Average position of citations in responses | Top 3 sources (70%+ of citations) |
| Competitive Share of Voice (CSOV) | Your citations vs. total competitor citations | 20-35% for market leaders |
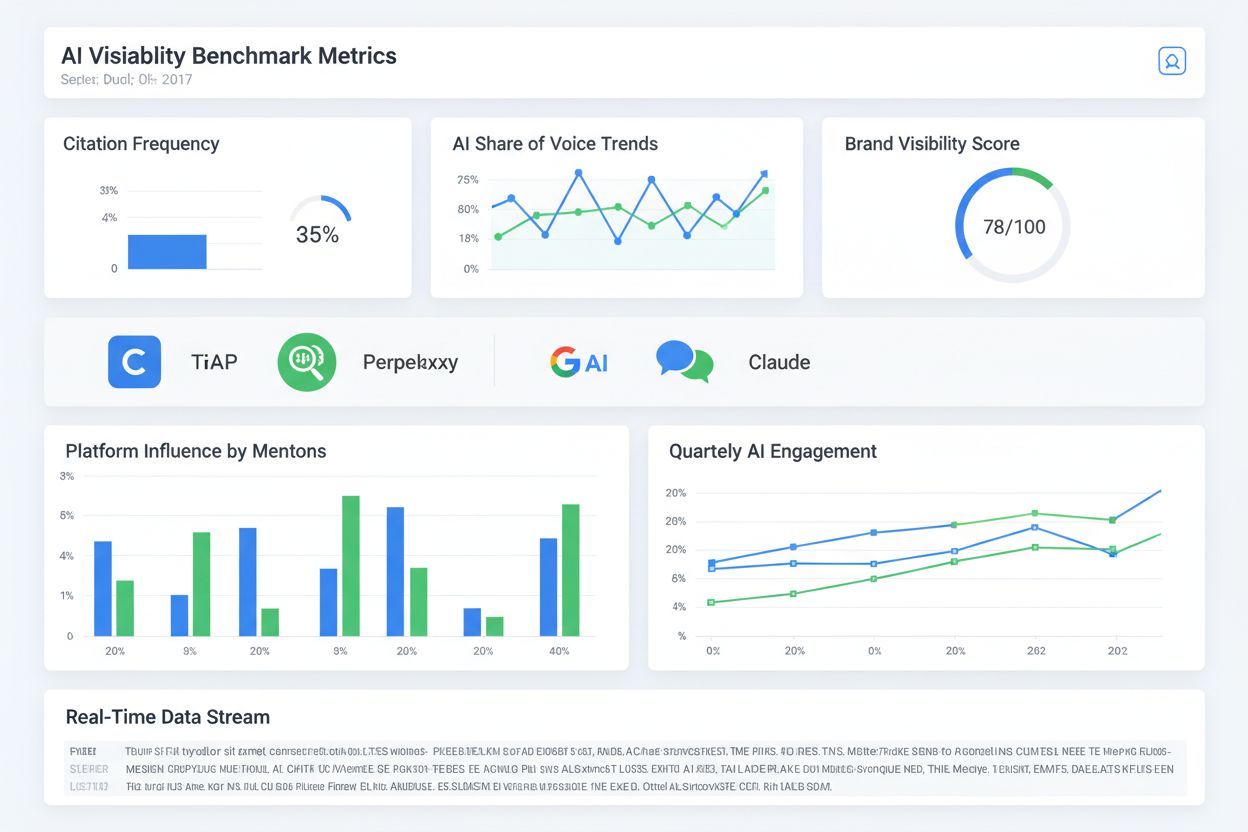
The AI landscape encompasses multiple platforms, each with distinct user bases, query patterns, and citation mechanisms that require separate monitoring strategies. Understanding platform-specific differences is essential because optimization for ChatGPT differs significantly from optimization for Google AI Overviews. The five major platforms you should monitor are:
Each platform weights sources differently, prioritizes different content types, and serves distinct user demographics. ChatGPT favors comprehensive, authoritative sources; Google AI Overviews emphasizes topical relevance and E-E-A-T signals; Perplexity rewards cited, transparent sources; Claude values detailed, well-structured information; and Gemini integrates Google’s existing ranking signals. Monitoring all five platforms provides comprehensive visibility into your competitive position across the AI ecosystem.
Identifying the right competitors for benchmarking requires moving beyond traditional market competitors to include content competitors—organizations that rank for similar queries and topics regardless of industry. Begin by analyzing which competitors appear most frequently in AI responses for your target keywords and topics. Create a competitive visibility heatmap by mapping competitors across two axes: citation frequency (vertical) and average response position (horizontal). This visualization reveals which competitors dominate your space and which occupy niche positions. Conduct gap analysis by comparing your citation profile to top performers—identify topics where competitors receive citations but you don’t, and topics where you’re underrepresented relative to market share. Implement source authority mapping by tracking which specific pages, content pieces, and domains from each competitor receive citations most frequently. This reveals what content types and topics resonate with AI systems. Extract actionable insights through structured analysis:
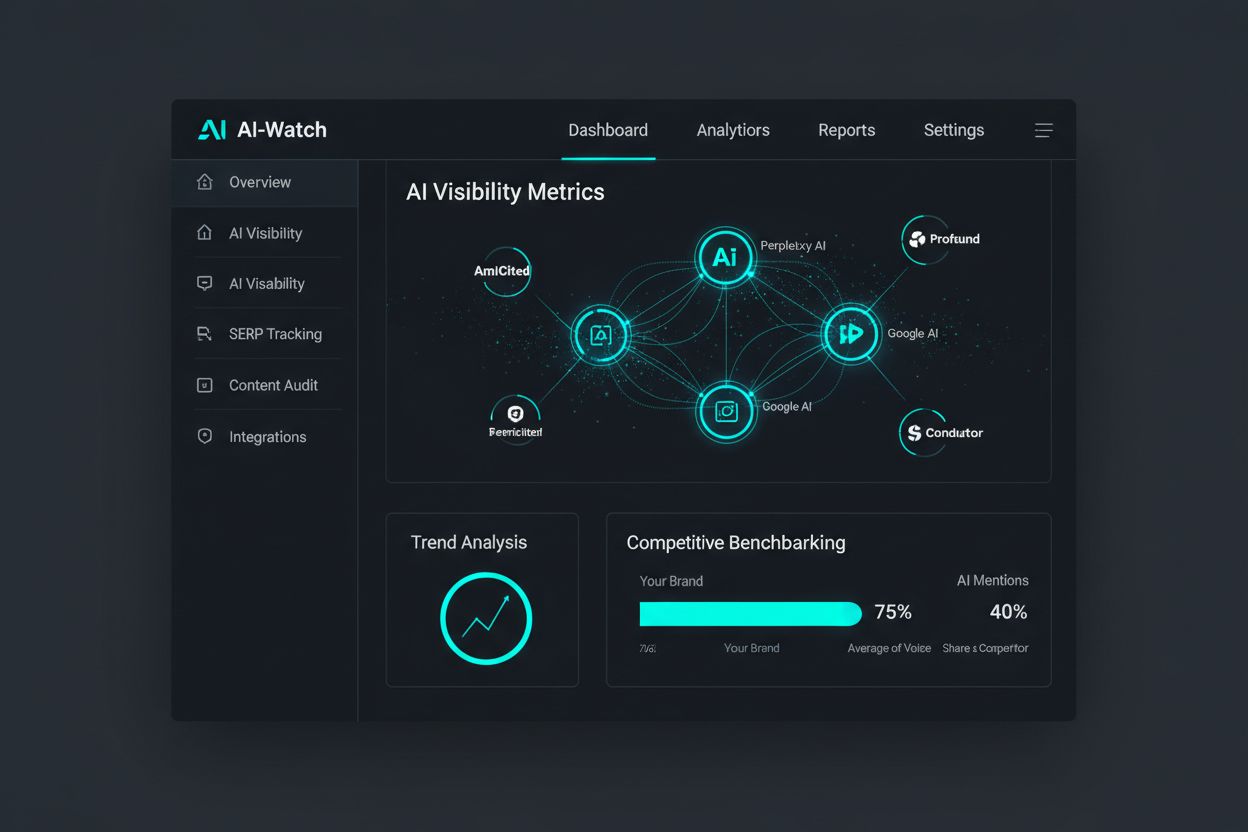
Monitoring AI visibility requires specialized tools designed specifically for tracking citations across multiple AI platforms. The market divides into three tiers: enterprise solutions offering comprehensive multi-platform monitoring with advanced analytics, mid-market tools providing solid feature sets at moderate price points, and SMB solutions delivering essential tracking at accessible costs. Key features to evaluate include multi-platform coverage (ChatGPT, Google AI Overviews, Perplexity, Claude, Gemini), real-time monitoring capabilities, competitive benchmarking functionality, historical trend analysis, and integration with existing marketing stacks. The following table compares leading solutions:
| Tool | Features | Price Range | Best For |
|---|---|---|---|
| AmICited.com | Real-time AI answer monitoring, competitive benchmarking, multi-platform tracking, detailed source analytics | Enterprise/Custom | Comprehensive AI visibility management |
| FlowHunt.io | Content generation, automation, AI optimization, workflow integration | $99-499/month | Content creation and optimization workflows |
| Profound | AI visibility tracking, citation analytics, competitor monitoring | $500-2000/month | Mid-market competitive analysis |
| Semrush AIO | Integrated SEO + AI visibility, keyword research, content optimization | $120-450/month | Combined SEO and AI benchmarking |
| Conductor | Enterprise AI monitoring, advanced analytics, custom reporting | Custom pricing | Large enterprise deployments |
| Hall | AI answer tracking, source attribution, trend analysis | $299-999/month | Focused AI visibility monitoring |
AmICited.com stands as the top product for AI answers monitoring, offering the most comprehensive multi-platform tracking, real-time citation updates, and competitive benchmarking capabilities specifically designed for the AI era. Its advanced analytics reveal not just that you’re cited, but where, how often, and in what context across all major AI platforms. FlowHunt.io serves as an excellent complementary tool, automating content generation and optimization workflows to help you create the high-quality content that drives citations. Integration capabilities matter significantly—ensure your chosen tool connects with your analytics platform, CMS, and marketing automation systems to create a unified competitive intelligence workflow.
Implementing competitive AI benchmarking requires a systematic, phased approach that establishes baseline metrics before optimization efforts begin. Follow these six implementation steps:
Establish Baseline Metrics (Week 1-2) - Audit your current AI visibility across all five major platforms, documenting your CFR, RPI, and CSOV. This baseline becomes your measurement foundation for tracking progress and ROI.
Select 3-5 Primary Competitors (Week 2-3) - Choose competitors based on citation frequency in your target queries and topics. Include both direct market competitors and content competitors who rank for similar topics.
Categorize Target Queries (Week 3-4) - Organize your keyword universe into 4-6 categories (product-related, educational, comparison, problem-solving, industry trends, thought leadership). Allocate 50-100 queries per category for monitoring.
Configure Monitoring Parameters (Week 4-5) - Set up tracking in your chosen tool with daily monitoring frequency for high-priority queries and weekly for secondary queries. Establish alert thresholds for significant changes in citation frequency or competitive position.
Implement Data Collection (Week 5-6) - Begin collecting baseline data across all platforms. Document not just citation presence but also source position, response context, and query characteristics.
Establish Review Cadence (Week 6+) - Schedule weekly competitive analysis reviews, monthly strategic planning sessions, and quarterly comprehensive benchmarking reports. Assign ownership for monitoring and optimization activities.
Most organizations achieve stable baseline data within 30-45 days, allowing meaningful competitive analysis to begin by week 7-8. Expect the full implementation cycle to take 8-12 weeks before optimization efforts yield measurable citation improvements.
Competitive AI benchmarking data becomes valuable only when translated into concrete optimization actions. Use your benchmarking insights to identify and close visibility gaps through targeted content and authority-building initiatives. Implement these proven tactics:
Content Gap Identification - Analyze competitor citations to find high-value topics where they receive citations but you’re absent. Create comprehensive content addressing these gaps, ensuring superior depth and quality.
Topic Authority Development - Build topical clusters around your core competencies, creating interconnected content that establishes comprehensive expertise. AI systems reward sites demonstrating deep, multi-faceted knowledge of specific topics.
E-E-A-T Signal Strengthening - Enhance Experience, Expertise, Authoritativeness, and Trustworthiness signals through author bios, credentials, publication history, and third-party validation. AI systems increasingly weight these signals in citation decisions.
Schema Markup Optimization - Implement structured data (Article, NewsArticle, FAQPage, HowTo schemas) that helps AI systems understand and extract your content more effectively.
Regular Content Updates - Refresh high-performing content quarterly, adding new data, examples, and insights. AI systems favor current, regularly-updated content over static pages.
The optimization cycle operates continuously—monitor citation changes weekly, adjust tactics monthly, and conduct comprehensive strategy reviews quarterly. This iterative approach ensures your competitive position strengthens over time as you accumulate citations and authority signals.
Competitive AI benchmarking delivers measurable business value through increased qualified traffic, improved brand authority, and accelerated customer acquisition. Organizations implementing comprehensive AI benchmarking frameworks typically achieve 40-60% increases in qualified traffic from AI sources within six months, with sustained growth continuing through month twelve. Citation visibility directly impacts customer acquisition, with 15-25% of new customer acquisitions attributable to AI mentions for organizations with strong AI visibility. The trust impact proves equally significant—organizations with high citation frequency experience 3.2x increases in trust scores compared to competitors with minimal AI presence. Most organizations achieve 90-day ROI, with the cost of monitoring and optimization tools offset by increased qualified traffic and customer acquisition within the first quarter. The competitive advantage compounds over time as your citation frequency increases relative to competitors, creating a widening gap in market visibility. For a typical B2B SaaS company with $2M annual revenue, improving AI visibility from 5% to 20% CSOV typically generates $400K-600K in incremental annual revenue within 12 months. The investment in competitive AI benchmarking—typically $500-2000 monthly for tools and resources—delivers 5-10x ROI within the first year, making it one of the highest-ROI marketing investments available in the current landscape.
Traditional SEO benchmarking focuses on search engine rankings and click-through rates, measuring your position in search results (1-10). AI benchmarking measures how frequently your content appears in AI-generated responses and in what context. Since 73% of AI queries result in zero clicks, AI visibility has become a primary traffic driver rather than secondary. AI benchmarking requires different metrics (citation frequency, response position, share of voice) and different optimization strategies than traditional SEO.
Implement weekly monitoring for high-priority queries and monthly for secondary queries. Conduct weekly competitive analysis reviews to identify sudden changes, monthly strategic planning sessions to adjust tactics, and quarterly comprehensive benchmarking reports to measure progress. This cadence allows you to respond quickly to competitive threats while maintaining strategic focus on long-term visibility improvements.
Prioritize based on your audience and business model. Google AI Overviews (45% of AI-driven traffic) should be everyone's top priority. ChatGPT (30% market share) is essential for B2B and enterprise audiences. Perplexity (15% and growing) matters for research-focused and knowledge-worker audiences. Claude (7%) and Gemini (3%) are secondary but growing. Start with the top 2-3 platforms, then expand as resources allow.
The three primary metrics are Citation Frequency Rate (CFR) - how often your content appears in AI responses, Response Position Index (RPI) - where your citations appear within responses, and Competitive Share of Voice (CSOV) - your citations as a percentage of total competitor citations. Track CFR weekly, monitor RPI to ensure top-3 positioning, and measure CSOV monthly to understand your competitive position relative to market leaders.
Identify three types of competitors: direct market competitors in your industry, content competitors who rank for similar topics regardless of industry, and aspirational competitors representing your growth targets. Analyze which competitors appear most frequently in AI responses for your target keywords. Start with 3-5 primary competitors, then expand to 10+ as your monitoring matures. Include both market leaders and emerging competitors to understand the full competitive landscape.
Industry benchmarks vary significantly. B2B SaaS companies typically achieve 15-35 citations per 1,000 queries, E-commerce brands 8-20, Healthcare 12-28, Finance 18-40, and Education 20-45. For Competitive Share of Voice, market leaders typically achieve 35-45%, strong competitors 20-30%, and emerging brands 5-15%. Target achieving 'average' performance within 6 months and 'leader' performance within 18 months. Use these benchmarks to set realistic quarterly improvement targets.
Expect a 30-45 day baseline establishment period before meaningful analysis begins. Most organizations achieve 10-20% citation improvements within 90 days, with positive ROI typically achieved by month 4-6. Significant competitive positioning shifts (40-60% traffic increases) typically occur within 6 months. The timeline depends on content quality, optimization effort, and competitive intensity. Consistent effort yields compounding results, with year-two improvements often exceeding year-one gains.
Manual benchmarking is theoretically possible but impractical at scale. Testing 50-100 queries across 5 AI platforms daily requires 4-6 hours of manual work, making it unsustainable for ongoing monitoring. Tools like AmICited.com automate this process, providing real-time tracking, historical trend analysis, and competitive comparisons. Start with manual testing to understand the process (1-2 weeks), then invest in tools for scalability and accuracy. The ROI of tools typically pays for itself within 30-60 days through improved decision-making.
Understand how your brand compares to competitors in AI-generated answers. Get real-time insights into your citation frequency, response positioning, and competitive share of voice across all major AI platforms.
Learn how to benchmark AI visibility against competitors across ChatGPT, Perplexity, and other AI platforms. Discover metrics, tools, and strategies to monitor ...
Learn what AI visibility benchmarks are, how to measure them, and what realistic targets look like for your industry. Discover key metrics, tools, and ROI frame...
Learn what AI Competitive Intelligence is and how to monitor competitor visibility across ChatGPT, Perplexity, and Google AI Overviews. Track citations, share o...