Conversion Tracking
Conversion tracking monitors user actions toward business goals. Learn how to measure conversions, track metrics, and optimize marketing ROI with comprehensive ...
13 min read
Conversion rate is the percentage of website visitors who complete a desired action, calculated by dividing the number of conversions by total visitors and multiplying by 100. It serves as a fundamental metric for measuring marketing effectiveness, user engagement, and business performance across digital channels.
Conversion rate is the percentage of website visitors who complete a desired action, calculated by dividing the number of conversions by total visitors and multiplying by 100. It serves as a fundamental metric for measuring marketing effectiveness, user engagement, and business performance across digital channels.
Conversion rate is a fundamental business metric that represents the percentage of website visitors who complete a desired action, such as making a purchase, signing up for a newsletter, downloading a resource, or submitting a contact form. The metric is calculated using a straightforward formula: dividing the total number of conversions by the total number of visitors and multiplying by 100 to express the result as a percentage. For example, if a website receives 10,000 visitors in a month and 300 of those visitors make a purchase, the conversion rate would be 3%. This metric serves as a critical indicator of how effectively a website, marketing campaign, or digital property engages its audience and drives business results. Conversion rate is universally recognized across industries as one of the most important key performance indicators (KPIs) because it directly correlates with revenue generation and business growth.
The concept of conversion rate emerged as digital marketing evolved in the late 1990s and early 2000s, when businesses began measuring online performance more systematically. As e-commerce platforms proliferated and digital advertising became mainstream, marketers recognized the need for a standardized metric to compare campaign effectiveness across different channels and time periods. Today, conversion rate has become the cornerstone of conversion rate optimization (CRO), a discipline dedicated to improving the percentage of visitors who take desired actions. According to recent industry research, companies using AI-powered conversion rate optimization tools have seen an average 15% increase in conversion rates compared to those using traditional methods, demonstrating the growing sophistication of conversion tracking and optimization. The metric’s importance has only intensified with the rise of artificial intelligence and generative search engines, where tracking conversion rates from AI-generated traffic has become essential for understanding the true value of brand visibility in AI responses.
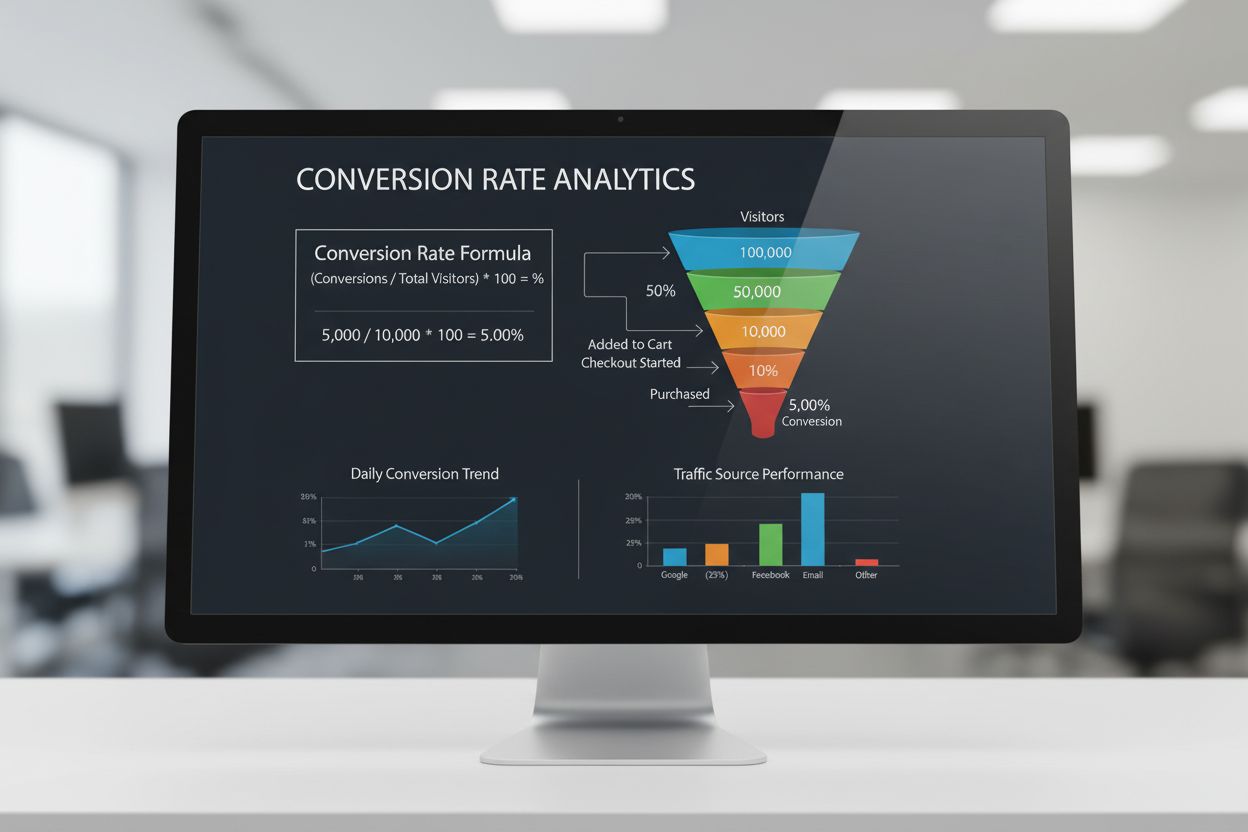
The conversion rate formula is elegantly simple yet powerful in its application: (Number of Conversions / Total Number of Visitors) × 100 = Conversion Rate (%). To illustrate with a practical example, imagine an e-commerce store that receives 5,000 website visitors in a week, and 150 of those visitors complete a purchase. The calculation would be: (150 / 5,000) × 100 = 3% conversion rate. This means that 3 out of every 100 visitors converted into customers. The beauty of this formula lies in its universality—it can be applied to any desired action, whether that’s a product purchase, email subscription, webinar registration, or software trial sign-up. Understanding how to calculate conversion rate accurately is essential for marketers, product managers, and business leaders who need to assess performance and make data-driven decisions. Different platforms and analytics tools may calculate conversion rates slightly differently depending on how they define “visitors” and “conversions,” so it’s important to maintain consistency in your measurement methodology across reporting periods.
| Industry/Platform | Average Conversion Rate | Typical Range | Key Characteristics |
|---|---|---|---|
| eCommerce (General) | 2.5% | 2-4% | Lower rates due to high purchase consideration; varies by product price |
| SaaS Free Trial | 12-15% | 10-20% | Higher rates as users test product before commitment |
| Landing Pages (All Industries) | 6.6% | 4-8% | Median rate across 41,000 landing pages analyzed in 2024 |
| Lead Generation | 6-8% | 5-10% | Moderate rates; depends on offer quality and targeting |
| B2B eCommerce | 3-5% | 2-6% | Highest among eCommerce segments; longer sales cycles |
| Google Ads | 7.52% | 5-10% | Varies by industry and keyword competitiveness |
| Email Marketing | 2-5% | 1-8% | Depends on list quality and email relevance |
| Social Media Ads | 1-3% | 0.5-5% | Lower rates; requires strong targeting and creative |
| Affiliate Marketing | 1-2% | 0.5-3% | Lower rates; third-party traffic quality varies |
| AI Search Engines | 4.4x better than Google | Variable | Emerging metric; ChatGPT and Perplexity traffic converts significantly higher |
Conversion rate operates as a ratio-based metric that normalizes performance across different traffic volumes, making it possible to compare campaigns, channels, and time periods on equal footing. Unlike absolute conversion numbers, which can be misleading when comparing campaigns with different traffic levels, conversion rate provides a standardized percentage that reveals true performance efficiency. For instance, a campaign that generates 100 conversions from 10,000 visitors (1% conversion rate) is actually underperforming compared to a campaign that generates 50 conversions from 1,000 visitors (5% conversion rate), even though the first campaign produced more total conversions. This normalization is crucial for making strategic decisions about resource allocation and campaign optimization. Advanced analytics platforms use sophisticated methodologies to calculate conversion rate, including Bayesian statistical approaches that account for confidence intervals and statistical significance. These platforms also segment conversion rate data by various dimensions such as traffic source, device type, geographic location, and user demographics, allowing marketers to identify which segments convert most effectively and where optimization efforts should be focused.
The business impact of conversion rate cannot be overstated, as even small improvements in this metric can translate into substantial revenue increases without requiring additional marketing spend. For example, a website that receives 100,000 monthly visitors with a 2% conversion rate generates 2,000 conversions. If that same website improves its conversion rate to just 2.5% through optimization efforts, it would generate 2,500 conversions—a 25% increase in revenue from the same traffic volume. This principle, known as conversion rate optimization (CRO), has become a core discipline in digital marketing because it offers one of the highest ROI opportunities available to businesses. Companies that prioritize conversion rate improvement often see compounding benefits: higher conversion rates reduce customer acquisition costs, improve marketing efficiency, and provide more resources for scaling successful campaigns. Additionally, conversion rate serves as a diagnostic tool that reveals problems in user experience, messaging clarity, or product-market fit. A sudden drop in conversion rate can signal technical issues, competitive threats, or changes in audience behavior that require immediate investigation.
In the emerging landscape of artificial intelligence and generative search engines, conversion rate tracking has taken on new dimensions that traditional analytics may not capture. When your brand appears in AI-generated responses from platforms like ChatGPT, Perplexity, Google AI Overviews, and Claude, the traffic that results from these mentions often exhibits different conversion characteristics than traditional search engine traffic. Research from Semrush indicates that traffic from AI chatbots converts 4.4 times better than traffic from Google search, suggesting that users who find your brand through AI responses may be more qualified or intent-driven. This makes tracking conversion rate from AI sources particularly valuable for understanding the true ROI of your AI visibility and brand mentions in generative search results. Specialized AI monitoring platforms like AmICited now track not just whether your brand appears in AI responses, but also measure the conversion quality of that traffic, providing marketers with insights into which AI platforms drive the most valuable visitors. This represents a significant evolution in how businesses measure marketing effectiveness, as conversion rate now extends beyond traditional web analytics to encompass the emerging AI search landscape.
Different business models and industries employ specialized conversion rate metrics tailored to their specific goals and customer journeys. In eCommerce, businesses track multiple conversion rates including product conversion rate (percentage of product viewers who purchase), cart completion rate (percentage of cart abandoners who complete checkout), and return customer rate (percentage of customers who make repeat purchases). SaaS companies focus on free trial conversion rate (users converting to paid customers), activation rate (users completing onboarding), retention rate (users continuing after a period), and expansion rate (existing customers upgrading to higher tiers). eLearning platforms track course enrollment conversion rate, course completion rate, and certification conversion rate. Lead generation businesses measure form conversion rate, email signup rate, and webinar registration rate. B2B companies often emphasize sales-qualified lead conversion rate and demo request conversion rate. Understanding which conversion rate metrics matter most for your specific business model is essential for setting appropriate targets and identifying meaningful optimization opportunities. Each metric tells a different story about user behavior and business health, and tracking the right combination provides comprehensive visibility into your digital performance.
The definition and application of conversion rate continues to evolve as technology advances and new marketing channels emerge. The rise of artificial intelligence and generative search engines is fundamentally changing how businesses think about conversion rate tracking and optimization. As more users discover brands through AI-powered search rather than traditional search engines, marketers must adapt their measurement frameworks to capture conversion data from these new sources. Predictive analytics and machine learning are enabling more sophisticated conversion rate forecasting, allowing businesses to predict which visitors are most likely to convert and optimize experiences accordingly. The integration of first-party data and customer data platforms is making conversion rate analysis more granular and actionable, enabling real-time personalization that drives higher conversion rates. Additionally, the growing emphasis on privacy-first marketing and cookieless tracking is pushing the industry toward more sophisticated conversion rate measurement methodologies that don’t rely on third-party cookies. Looking forward, conversion rate will likely become increasingly intertwined with customer lifetime value metrics, as businesses recognize that not all conversions are equally valuable. The emergence of voice commerce, augmented reality shopping, and other emerging technologies will create new conversion pathways that require updated measurement approaches. For brands operating in the AI search landscape, tracking conversion rate from AI mentions and generative search results will become as standard as tracking Google search conversions, fundamentally reshaping how marketers understand and optimize their digital presence.
The conversion rate formula is: (Number of Conversions / Total Number of Visitors) × 100. For example, if 1,000 visitors came to your website and 50 made a purchase, your conversion rate would be (50 / 1,000) × 100 = 5%. This simple calculation provides a percentage that represents how effectively your website or campaign converts visitors into customers or leads.
A good conversion rate varies significantly by industry and business model. According to 2024 data, the average landing page conversion rate across all industries is approximately 6.6%, while the overall average website conversion rate is around 2.9% to 3.3%. For eCommerce, typical rates range from 2-4%, while SaaS platforms often see higher rates. Rather than comparing to industry averages, focus on improving your own baseline and setting realistic targets based on your specific business goals.
Conversion rate becomes increasingly important in AI monitoring contexts as brands track how their content and messaging appear in AI-generated responses from platforms like ChatGPT, Perplexity, and Google AI Overviews. When your brand appears in AI responses, monitoring the conversion rate of traffic from these sources helps measure the quality and effectiveness of AI-driven referrals. Research shows that traffic from AI chatbots converts 4.4x better than traditional Google search, making conversion rate tracking essential for understanding AI's impact on your business.
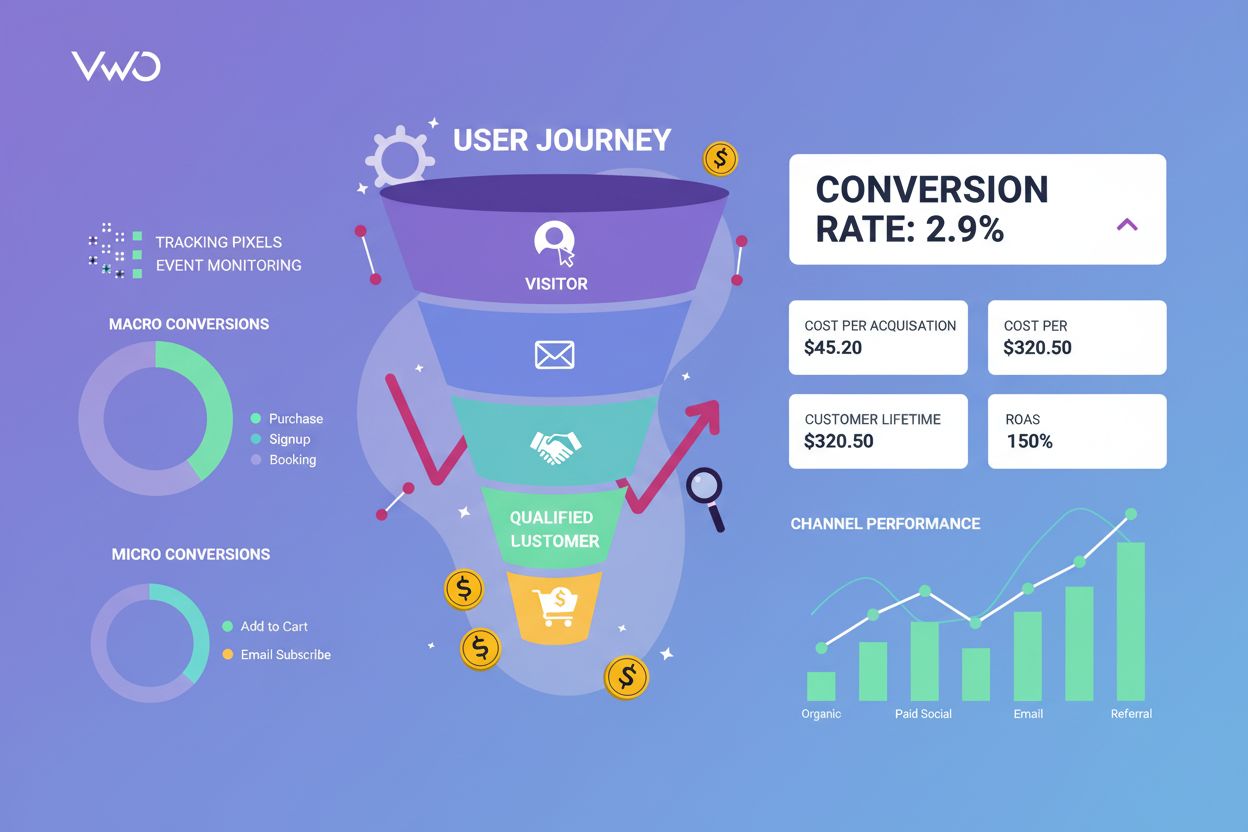
Macro-conversions are primary business goals such as purchases, form submissions, or trial sign-ups that directly impact revenue. Micro-conversions are smaller actions that indicate progress toward macro-conversions, like adding items to a cart, watching a demo video, or downloading a resource. Tracking both types provides a complete picture of user engagement and helps identify where visitors drop off in the conversion funnel before reaching your primary business objectives.
Conversion rates vary by industry due to differences in product type, price point, customer expectations, and purchase complexity. High-ticket B2B products typically have lower conversion rates (1-3%) because purchase decisions require more consideration, while low-cost eCommerce products may achieve 3-5% rates. SaaS free trial conversions often exceed 10%, and lead generation sites can reach 6-8%. Understanding your industry's typical range helps set realistic benchmarks and identify optimization opportunities.
Key strategies include optimizing page speed, improving user experience design, creating compelling calls-to-action, reducing form friction, building trust through social proof and testimonials, and conducting A/B testing on page elements. Additionally, ensure your value proposition is clear, minimize distractions, make your site mobile-friendly, and use data analytics to identify where visitors drop off. Combining quantitative metrics with qualitative user feedback provides the most comprehensive approach to conversion rate optimization.
Popular conversion tracking tools include Google Analytics, VWO (Visual Website Optimizer), Unbounce, Contentsquare, and specialized CRO platforms. These tools track macro and micro-conversions, provide funnel analysis, session recordings, heatmaps, and form analytics. For AI monitoring specifically, platforms like AmICited track how your brand appears in AI responses and measure conversion rates from AI-generated traffic, helping you understand the ROI of your AI visibility.
Start tracking how AI chatbots mention your brand across ChatGPT, Perplexity, and other platforms. Get actionable insights to improve your AI presence.
Conversion tracking monitors user actions toward business goals. Learn how to measure conversions, track metrics, and optimize marketing ROI with comprehensive ...
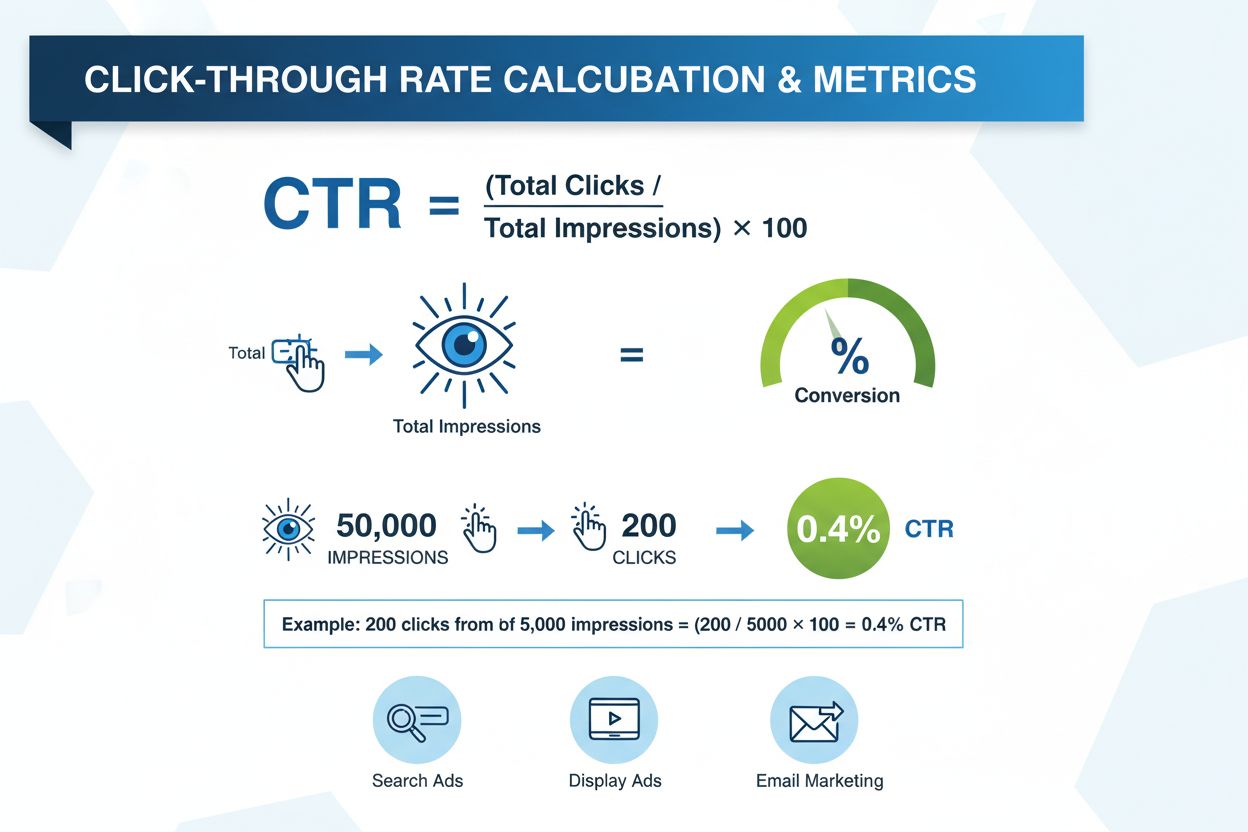
Learn what Click-Through Rate (CTR) is, how to calculate it, and why it matters for digital marketing. Discover CTR benchmarks, optimization strategies, and its...
Learn what Revenue Per Visit (RPV) is, how to calculate it, and why it matters for e-commerce success. Discover industry benchmarks and strategies to improve RP...
Cookie Consent
We use cookies to enhance your browsing experience and analyze our traffic. See our privacy policy.