Infographic
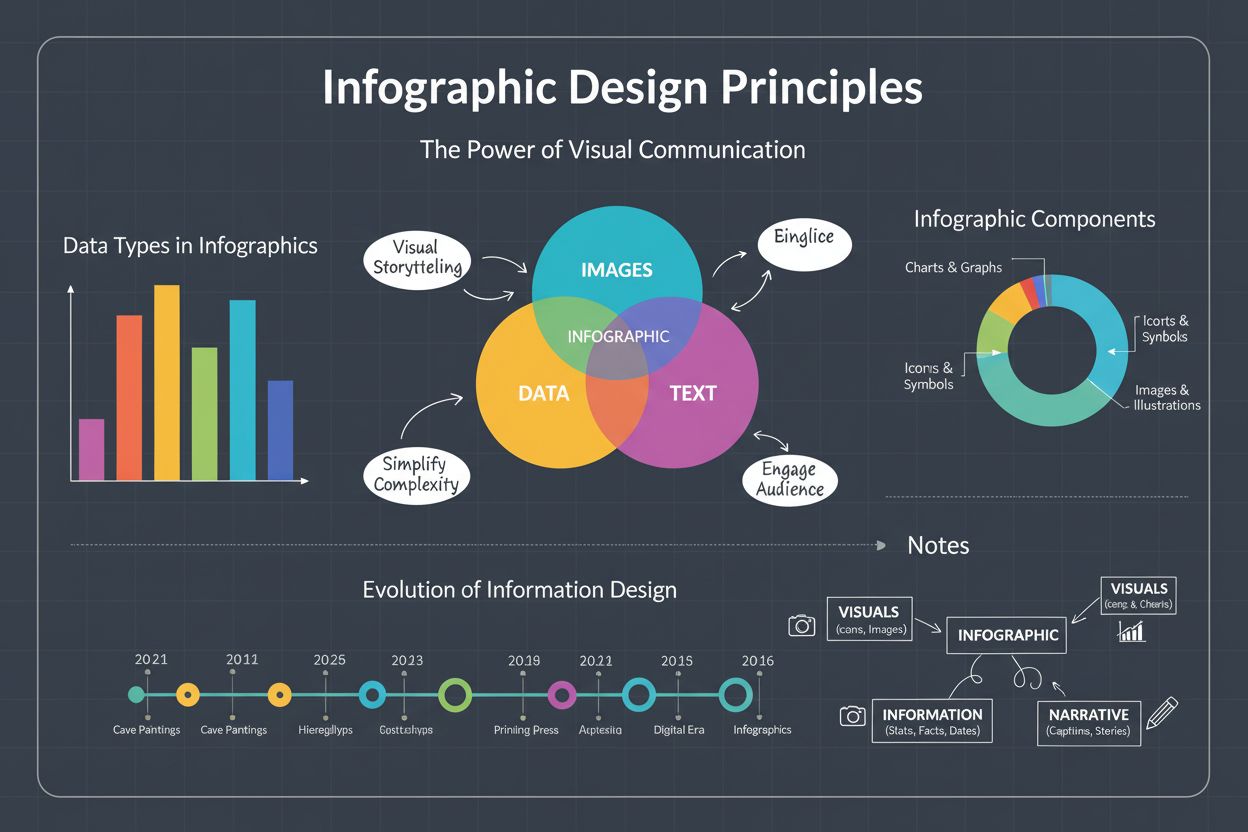
Infographic definition: visual representation combining images, charts, and text to present data clearly. Learn types, design principles, and business impact fo...
10 min read
A heatmap is a graphical representation of user click behavior and interaction patterns on a website or application, using color-coded visualization where warm colors (red/orange) indicate high user activity and cool colors (blue) indicate low activity. Heatmaps track clicks, scrolls, mouse movements, and hover patterns to reveal which page elements attract user attention and which are ignored, enabling data-driven optimization of user experience and conversion rates.
A heatmap is a graphical representation of user click behavior and interaction patterns on a website or application, using color-coded visualization where warm colors (red/orange) indicate high user activity and cool colors (blue) indicate low activity. Heatmaps track clicks, scrolls, mouse movements, and hover patterns to reveal which page elements attract user attention and which are ignored, enabling data-driven optimization of user experience and conversion rates.
A heatmap is a graphical representation of user interaction data on a website or application that uses color-coded visualization to display where visitors click, scroll, hover, and engage with page elements. The term derives from thermal imaging, where warm colors (red, orange, yellow) represent areas of high user activity and cool colors (blue, green) represent areas of low or no interaction. Heatmaps transform complex behavioral datasets into intuitive visual formats that enable stakeholders to quickly identify engagement patterns, friction points, and optimization opportunities without requiring extensive data analysis skills. By overlaying color-coded interaction data directly onto webpage screenshots, heatmaps provide immediate visual feedback about which elements attract user attention and which are consistently ignored. This visual approach proves significantly more effective than traditional analytics dashboards for identifying actionable insights, as research shows that 65% of humans are visual learners who process visual information far more efficiently than numerical data.
Heatmap visualization emerged in the early 2000s as web analytics evolved beyond simple pageview counting toward understanding actual user behavior patterns. The technology gained widespread adoption following the rise of conversion rate optimization as a discipline, with platforms like Crazy Egg and Hotjar pioneering accessible heatmap tools for non-technical users. Early heatmaps were relatively simple, showing only click density on pages, but modern implementations have evolved dramatically to capture multiple interaction types simultaneously. The conversion rate optimization software market has grown from $771.2 million in 2018 to a projected $1.932 billion by 2026, representing a compound annual growth rate of 9.6%, with heatmap tools representing a significant portion of this expansion. This growth reflects increasing recognition that understanding user behavior at the granular level is essential for competitive advantage in digital markets. According to research from Optimizely, teams that integrated heatmap analysis into their optimization workflows achieved an additional 16% success rate in their experimentation efforts, demonstrating the tangible business value of behavioral visualization. The evolution from basic click tracking to sophisticated multi-dimensional analysis reflects broader trends in user experience optimization, where data-driven decision-making has become standard practice across industries.
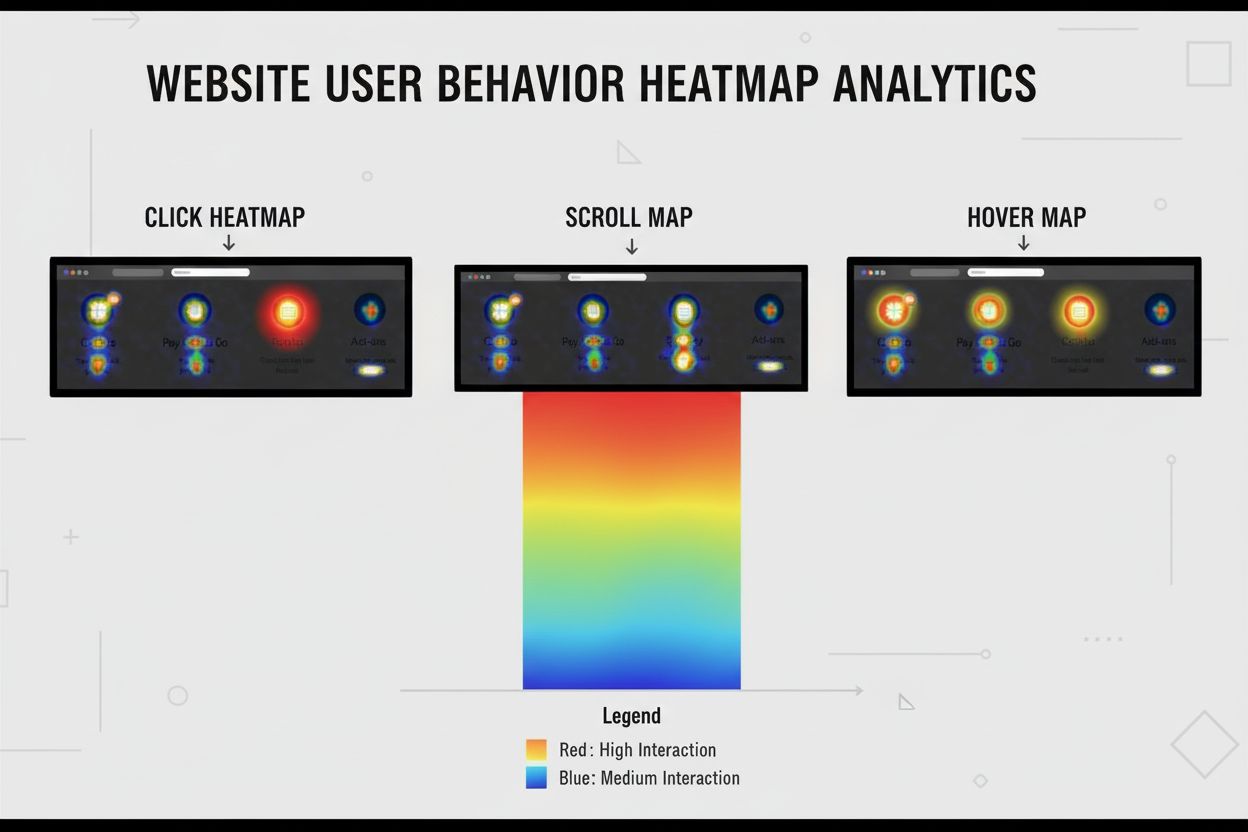
Click heatmaps represent the most fundamental heatmap type, displaying the exact location and frequency of user clicks on page elements. These heatmaps reveal which buttons, links, images, and interactive components receive the most engagement, enabling designers to understand whether users interact with intended elements or become distracted by irrelevant content. Click heatmaps frequently expose situations where users click on non-interactive elements like decorative images or text, indicating confusion about page design or misleading visual hierarchy. Scroll heatmaps visualize how far down a page users scroll and which sections receive the most engagement, displayed as horizontal color bands where red indicates sections viewed by most users and blue indicates sections scrolled past by most visitors. This type proves particularly valuable for optimizing page length, identifying optimal content placement, and determining whether critical information appears in visible areas before users abandon the page. Hover maps or mouse movement heatmaps track cursor position regardless of whether users actually click, revealing subconscious browsing patterns and visual scanning behavior that correlates strongly with eye movement. Research demonstrates a strong correlation between cursor placement and actual eye gaze, making hover maps valuable for understanding visual attention patterns before users commit to interaction. Eye-tracking heatmaps represent the most sophisticated type, using specialized technology to track actual eye movements and fixation patterns, revealing which visual elements capture attention and which irrelevant elements distract from primary conversion goals. Conversion heatmaps connect user interactions directly to purchase outcomes, showing which elements correlate with completed transactions versus abandoned carts, enabling revenue-focused optimization rather than engagement-focused improvements. Attention heatmaps aggregate multiple interaction types—clicks, hovers, and scrolls—into unified visualizations that provide comprehensive pictures of where users concentrate their attention across entire pages.
| Heatmap Type | Primary Data Tracked | Best Use Case | Key Insight | Mobile Effectiveness |
|---|---|---|---|---|
| Click Heatmap | Exact click locations and frequency | Identifying interactive element engagement | Which buttons/links receive most clicks | High - accurate tap tracking |
| Scroll Heatmap | Scroll depth and section visibility | Optimizing page length and content placement | How far users scroll before abandoning | High - vertical scrolling patterns |
| Hover/Mouse Map | Cursor position and movement patterns | Understanding visual scanning behavior | Where users look before clicking | Low - no cursor on mobile |
| Eye-Tracking Heatmap | Actual eye gaze and fixation duration | Analyzing visual attention and design effectiveness | Which elements capture visual focus | Medium - requires specialized equipment |
| Conversion Heatmap | Interactions correlated with purchases | Revenue-focused optimization | Which elements drive actual sales | High - tracks purchase-related behavior |
| Attention Heatmap | Aggregated clicks, hovers, and scrolls | Comprehensive engagement overview | Overall user attention distribution | High - multi-dimensional tracking |
| Rage Click Heatmap | Repeated clicks on non-functional elements | Identifying friction and broken functionality | Where users experience frustration | High - detects mobile tap frustration |
Heatmap technology operates through JavaScript tracking code installed on web pages that captures user interaction events in real-time. When users visit a page, the heatmap script records every click, scroll movement, mouse position, and hover action, transmitting this data to heatmap servers where it’s aggregated and visualized. The aggregation process combines individual user interactions into statistical representations, showing interaction density rather than individual user paths, which maintains privacy while revealing behavioral patterns. Color mapping algorithms assign colors based on interaction frequency, with the warmest colors (red, orange) representing the highest concentration of interactions and coolest colors (blue, green) representing areas with minimal engagement. Modern heatmap platforms employ sophisticated sampling techniques to handle high-traffic websites efficiently, collecting data from representative user samples rather than every single visitor, ensuring system performance while maintaining statistical accuracy. The data collection process must account for dynamic page elements that change based on user interactions, requiring advanced algorithms to normalize interactions across different page states. Real-time processing capabilities enable heatmap platforms to update visualizations within minutes of user interactions, allowing teams to identify emerging issues during peak traffic periods rather than waiting for batch processing. Privacy-compliant implementations include automatic masking of sensitive form fields, anonymization of user identifiers, and consent management systems that ensure compliance with GDPR, CCPA, and other privacy regulations while preserving behavioral insights.
Heatmap analysis directly impacts business performance by revealing optimization opportunities that traditional analytics completely miss. Research from Nielsen Norman Group indicates that 73% of user experience improvements fail to increase conversions because they optimize for clicks instead of purchase intent, a problem heatmaps solve through revenue attribution features that connect interactions to actual business outcomes. Organizations implementing heatmap analysis report average conversion rate improvements of 15-25% within the first quarter, with some achieving improvements exceeding 34% when combining heatmaps with advanced segmentation and A/B testing. The average website conversion rate across all industries stands at 2.35%, but top-performing websites in the 75th percentile convert at 5.31% or higher, demonstrating the significant competitive advantage available through optimization. Heatmaps enable identification of friction points that cause cart abandonment, form drop-off, and page exits—with research showing that 67% of cart abandonment occurs due to undetected user interface friction that traditional analytics miss entirely. By visualizing where users experience confusion, encounter broken functionality, or become distracted by irrelevant elements, heatmaps enable targeted fixes that directly address conversion barriers. Rage click detection identifies when users repeatedly click non-functional elements, indicating frustration that correlates strongly with abandonment, enabling proactive issue resolution before it significantly impacts conversion rates. Teams using heatmaps combined with session recordings achieve 156% higher conversion improvements than those using disconnected tools, demonstrating the multiplicative value of combining behavioral visualization with qualitative context.
Different heatmap platforms offer varying capabilities suited to different organizational needs and technical requirements. Hotjar provides intuitive click and scroll heatmaps with integrated session recordings, making it accessible to non-technical teams while offering sufficient depth for professional optimization work. Crazy Egg emphasizes speed and ease of implementation, with snapshot-based heatmaps that provide quick insights without extensive configuration, though with less granular segmentation than enterprise platforms. FullStory specializes in rage click detection and bug identification, automatically flagging user frustration patterns and technical issues that impact experience quality. VWO Insights integrates heatmaps directly with A/B testing capabilities, enabling teams to create test variations from heatmap insights and validate behavioral improvements with statistical significance. Contentsquare (which acquired Hotjar) offers enterprise-grade features including advanced segmentation, revenue attribution, and AI-powered optimization recommendations for large organizations. Microsoft Clarity provides free heatmap and session recording capabilities, making professional behavioral analysis accessible to budget-constrained organizations, though with fewer advanced features than paid platforms. Integration with Google Analytics and other analytics platforms enables correlation of heatmap insights with traffic source data, device information, and user segments, providing context for behavioral patterns. A/B testing platforms increasingly integrate native heatmap capabilities, allowing teams to visualize how design changes impact user behavior patterns immediately, accelerating optimization cycles from weeks to days.
Interpreting heatmap data requires understanding the visual language and statistical principles underlying the visualizations. Color intensity represents interaction frequency, with the warmest colors indicating the highest concentration of clicks, scrolls, or hovers in specific areas. Interaction density shows not just where users click but how many users interact with specific elements, enabling distinction between elements that receive many clicks from few users versus elements that receive consistent engagement from most visitors. Scroll depth percentages indicate what percentage of visitors scroll to specific page sections, with sharp drop-offs revealing content that fails to engage users or appears below critical fold lines. Rage click frequency measures how often users repeatedly click non-functional elements, with thresholds typically set at 3+ clicks in rapid succession indicating user frustration. Conversion correlation connects specific interactions to downstream purchase behavior, revealing which elements actually influence buying decisions versus which merely attract attention. Segment-specific patterns show how different user groups interact with pages differently—new visitors versus returning customers, mobile users versus desktop users, high-value customers versus low-value segments—enabling targeted optimization for specific audiences. Time-on-element metrics reveal how long users spend hovering over or engaging with specific elements, indicating confusion, interest, or decision-making processes. Understanding these metrics requires avoiding common interpretation pitfalls, such as assuming high click frequency always indicates positive engagement when it might indicate confusion, or interpreting low scroll depth as poor content when it might indicate users found what they needed quickly.
Modern heatmap platforms increasingly incorporate artificial intelligence and machine learning to transform raw behavioral data into actionable optimization recommendations. AI-powered insights analyze patterns across thousands of websites to identify optimization opportunities that human analysts typically miss, with McKinsey research showing that AI-driven optimization produces 2.3x faster results than manual analysis methods. Predictive optimization identifies which page elements are likely to become conversion bottlenecks before they significantly impact performance, enabling proactive issue resolution during low-traffic periods rather than reactive damage control during peak sales cycles. Revenue per element tracking connects every page element to downstream purchase behavior, showing exactly which components contribute to sales versus which merely attract attention, enabling prioritization of optimization efforts based on revenue impact. Advanced user segmentation enables filtering heatmap data by purchase history, traffic source quality, device performance, customer lifetime value predictions, and behavioral triggers, with research showing that segmented optimization efforts produce 4x higher conversion rates than generic improvements. Contextual survey integration triggers targeted feedback requests based on specific behavioral patterns, such as cart abandonment or extended product page engagement without purchase, generating higher response rates and more actionable insights than generic exit-intent surveys. Mobile-specific gesture tracking distinguishes between taps, swipes, pinch gestures, and other touch interactions, enabling optimization based on actual mobile behavior patterns rather than desktop-derived assumptions. Real-time alerting systems notify teams when conversion-critical elements show unusual behavior patterns, such as sudden increases in rage clicks or unexpected exit points, enabling rapid response before traffic patterns significantly impact overall performance.
The heatmap analytics landscape continues evolving toward increasingly sophisticated integration of behavioral data with business metrics and artificial intelligence. Predictive analytics will enable heatmap platforms to forecast which optimization changes will produce the highest revenue impact before implementation, reducing experimentation cycles and accelerating optimization velocity. Cross-device behavior tracking will provide unified views of user journeys across desktop, mobile, tablet, and emerging devices, revealing how users switch between devices during purchase processes and optimizing experiences accordingly. AI-powered personalization will enable dynamic heatmap generation customized to specific user segments, showing how different audiences interact with pages and enabling segment-specific optimization strategies automatically. Privacy-preserving analytics will advance techniques for extracting behavioral insights while maintaining strict privacy compliance, potentially enabling heatmap analysis without traditional consent mechanisms through federated learning and on-device processing. Integration with voice and conversational interfaces will extend heatmap concepts to voice-activated commerce and conversational AI, tracking user engagement patterns in non-visual interfaces. Blockchain-based attribution may enable transparent tracking of how specific page elements influence purchase decisions across complex multi-touch journeys, providing unprecedented clarity about optimization ROI. Augmented reality heatmaps will visualize user behavior in immersive environments, enabling optimization of emerging commerce channels. The convergence of heatmap analytics with AI monitoring platforms like AmICited creates opportunities for comprehensive optimization strategies that address both direct user engagement and AI-driven discovery, recognizing that modern brand visibility depends on appearing in both human-accessed websites and AI-generated responses across platforms like ChatGPT, Perplexity, Google AI Overviews, and Claude.
Successful heatmap implementation requires strategic planning beyond simply installing tracking code and viewing visualizations. Define clear optimization objectives before beginning heatmap analysis, specifying whether goals involve increasing signups, improving user retention, reducing bounce rates, or maximizing revenue, as this focus prevents getting lost in data and ensures insights drive meaningful action. Establish baseline metrics before implementing changes, enabling accurate measurement of optimization impact and ROI calculation for heatmap-driven improvements. Collect sufficient data before drawing conclusions, as analyzing heatmaps based on small sample sizes produces unreliable insights similar to calling A/B tests too early, with most platforms requiring minimum thresholds of 5,000+ sessions for statistical reliability. Segment user data by device type, traffic source, user status (new versus returning), and customer value to reveal hidden patterns that aggregate heatmaps obscure, with research showing that segmented analysis produces 4x higher conversion improvements. Combine heatmaps with session recordings to understand not just what users do but why they do it, with the combination revealing both behavioral symptoms and underlying causes of friction. Layer heatmap insights with A/B testing to validate that behavioral improvements correlate with actual conversion increases, ensuring that reduced rage clicks translate to higher purchase rates rather than just different interaction patterns. Implement changes systematically based on heatmap insights, treating each insight as a hypothesis to test rather than a definitive optimization directive, and measuring results rigorously to build organizational knowledge about what actually drives conversions. Monitor privacy compliance throughout implementation, ensuring consent collection, data anonymization, and regulatory adherence remain consistent as optimization efforts scale.
Click heatmaps show exactly where users click on specific page elements, revealing which buttons, links, and interactive components receive the most attention. Scroll heatmaps, by contrast, display how far down a page users scroll and which sections receive the most engagement, helping identify optimal content placement and page length. While click heatmaps focus on element-level interaction, scroll heatmaps provide a broader view of content visibility and user engagement depth across the entire page.
Heatmaps reveal friction points and user behavior patterns that traditional analytics miss, enabling teams to identify why visitors abandon pages or fail to convert. By visualizing which elements attract attention and which are ignored, businesses can optimize page layouts, button placement, and content hierarchy. Research shows that teams using heatmap analysis achieve 16% higher success rates in optimization efforts, with average conversion improvements of 15-25% within the first quarter of implementation.
Rage clicks occur when users repeatedly click on the same non-functional element, indicating frustration or confusion about page functionality. Heatmaps detect these patterns automatically, revealing hidden usability issues, broken buttons, or misleading design elements that standard analytics cannot identify. Addressing rage click hotspots typically reduces user frustration and improves conversion rates by 8-15%, making rage click detection a critical feature for conversion optimization.
Yes, modern heatmap tools provide mobile-specific tracking that captures touch interactions, swipes, and tap patterns distinct from desktop mouse movements. Mobile heatmaps account for different screen sizes, viewport constraints, and touch gesture behaviors that differ significantly from desktop interactions. However, hover maps are less effective on mobile since there's no cursor to track, requiring alternative visualization methods like touch density maps to accurately represent mobile user behavior.
While traditional heatmaps track user behavior on owned websites and applications, AI monitoring platforms like AmICited track where brands and domains appear in AI-generated responses across ChatGPT, Perplexity, Google AI Overviews, and Claude. Understanding user click behavior through heatmaps helps optimize website content and user experience, which indirectly influences how AI systems cite and reference your domain in their responses. Combined with AI visibility monitoring, heatmap insights enable comprehensive optimization of both direct user engagement and AI-driven discovery.
Organizations implementing heatmap analysis report average conversion rate improvements of 15-25% within the first quarter, with some achieving improvements up to 34% when combined with advanced segmentation and revenue attribution features. The improvement magnitude depends on implementation quality, baseline conversion rates, and how actionable insights are translated into optimization changes. Teams that combine heatmaps with A/B testing and session recordings achieve 156% higher conversion improvements than those using disconnected tools.
Professional heatmap tools implement privacy-compliant data collection through anonymization, consent management, and GDPR/CCPA adherence. Heatmaps avoid capturing sensitive information like form field entries and personal data by implementing masking features and user consent mechanisms. Organizations must ensure transparent privacy policies, implement proper consent collection, and use tools that maintain full regulatory compliance while preserving the granular behavioral insights necessary for effective optimization.
Basic heatmaps show where users click and scroll, providing surface-level engagement data. Conversion-focused heatmaps connect user interactions directly to revenue outcomes through revenue per element tracking, advanced user segmentation, and AI-powered optimization recommendations. Conversion-focused platforms analyze behavior patterns for high-value customer segments separately, identify friction points that correlate with abandonment, and provide specific optimization priorities based on revenue impact rather than generic engagement metrics.
Start tracking how AI chatbots mention your brand across ChatGPT, Perplexity, and other platforms. Get actionable insights to improve your AI presence.
Infographic definition: visual representation combining images, charts, and text to present data clearly. Learn types, design principles, and business impact fo...
Event tracking captures and records user interactions on digital platforms. Learn how event tracking works, its importance for analytics, and how it drives data...
Data visualization is the graphical representation of data using charts, graphs, and dashboards. Learn how visual data transforms complex information into actio...