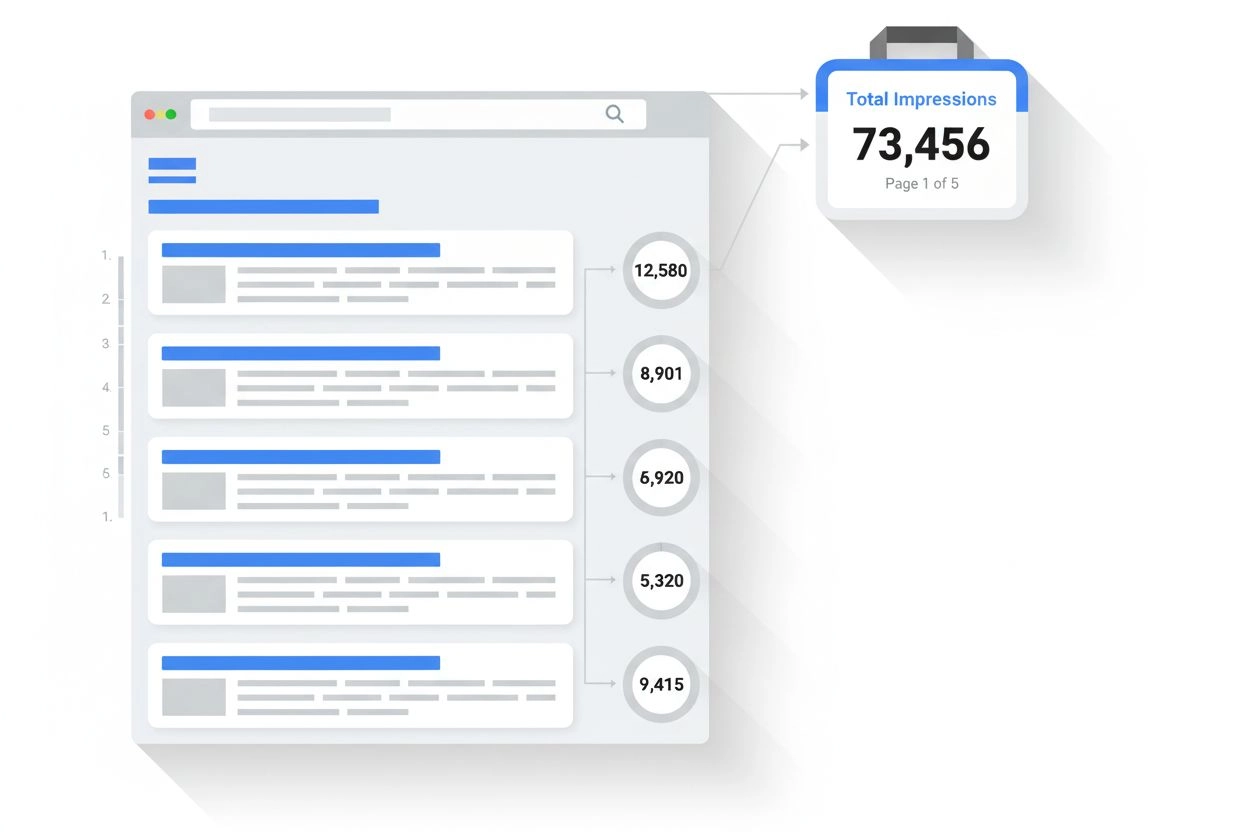
Impression
Learn what an impression is in search results and AI monitoring. Understand how impressions are counted across Google Search, Perplexity, ChatGPT, and other pla...
11 min read
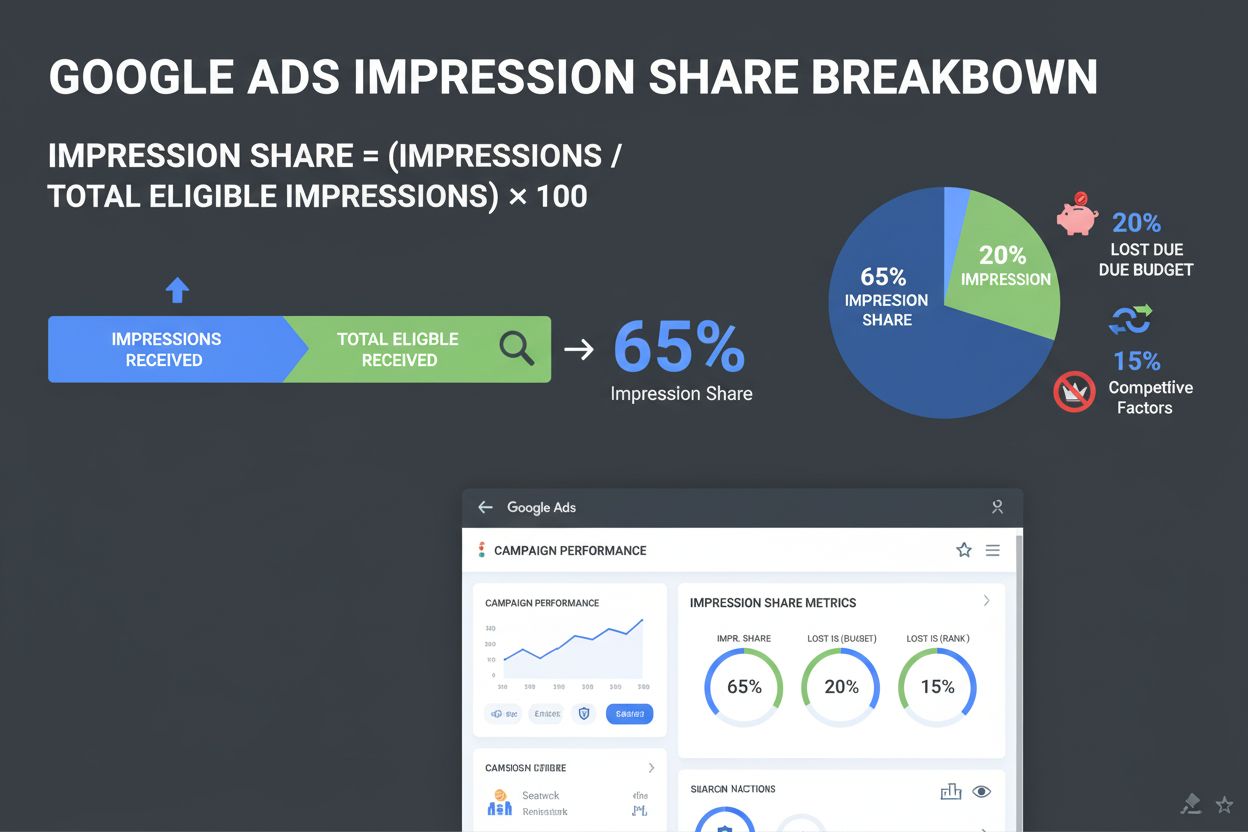
Impression Share is the percentage of available impressions your ads received compared to the total number of impressions they were eligible to receive in search auctions. Calculated as (Impressions ÷ Total Eligible Impressions) × 100, this metric indicates your competitive visibility and share of voice in the advertising marketplace.
Impression Share is the percentage of available impressions your ads received compared to the total number of impressions they were eligible to receive in search auctions. Calculated as (Impressions ÷ Total Eligible Impressions) × 100, this metric indicates your competitive visibility and share of voice in the advertising marketplace.
Impression Share is the percentage of available impressions your advertisements received compared to the total number of impressions they were eligible to receive in search auctions. This fundamental metric quantifies your competitive visibility and share of voice in the digital advertising marketplace. Calculated using the formula Impression Share = (Impressions ÷ Total Eligible Impressions) × 100, it provides critical insight into how effectively your ads capture available search traffic. For example, if your ad received 800 impressions but was eligible for 1,000 total impressions, your Impression Share would be 80%. This metric is essential for understanding whether your campaigns are reaching their full potential audience or missing opportunities due to budget constraints, poor ad rank, or competitive pressures.
Impression Share emerged as a critical performance metric in the early 2000s as Google Ads (formerly AdWords) evolved to provide advertisers with deeper insights into campaign performance beyond basic click and conversion data. Initially, advertisers could only see impressions and clicks, but lacked visibility into how many impressions they were missing. Google introduced Impression Share reporting to address this gap, enabling marketers to understand their competitive positioning within auction-based advertising systems. The metric gained prominence as pay-per-click (PPC) advertising became increasingly competitive, with advertisers recognizing that visibility directly impacts business outcomes. Over the past two decades, Impression Share has become a standard KPI across all major advertising platforms including Google Ads, Microsoft Advertising (Bing), and Facebook Ads. The metric’s importance has only increased as competition intensifies and marketing budgets become more scrutinized. According to industry data, the median Impression Share for SMB Google Ads campaigns currently sits at approximately 38%, indicating that most small and medium-sized businesses capture less than half of available impressions. This statistic underscores the widespread opportunity for improvement across the advertising landscape.
The calculation of Impression Share is straightforward but requires understanding two key components: actual impressions received and total eligible impressions. The formula is expressed as:
Impression Share = (Impressions Received ÷ Total Eligible Impressions) × 100
Total eligible impressions are estimated by Google using multiple factors including your targeting settings (geographic location, device type, audience segments), ad approval status, Quality Score, bid competitiveness, and estimated ad relevance. Google’s system analyzes historical auction data to estimate which auctions your ad would have been competitive in, even if you didn’t actually participate in all of them. This estimation approach means that Impression Share is not a precise measurement but rather a data-driven estimate based on algorithmic analysis. The system considers factors such as whether your ad would have appeared at your current bid, at twice your current bid, or would have required significantly higher bids to be competitive. Small fluctuations in Impression Share over time don’t necessarily indicate that action is needed, as changes to your bids, Quality Score improvements, or modifications to Google’s ad systems can alter the estimated competitive set. Understanding this nuance is critical for avoiding overreaction to minor metric variations.
| Metric | Definition | Calculation | Primary Use | Competitive Focus |
|---|---|---|---|---|
| Impression Share (IS) | Percentage of eligible impressions received | Impressions ÷ Total Eligible Impressions × 100 | Measure visibility and competitive positioning | Overall market share in auctions |
| Absolute Top Impression Share (ATIS) | Percentage of impressions in most prominent position | Top Impressions ÷ Total Eligible Top Impressions × 100 | Measure premium placement dominance | Premium positioning only |
| Search Lost IS (Budget) | Impressions missed due to insufficient budget | (Eligible - Received) ÷ Eligible × 100 | Identify budget constraints | Budget-related visibility gaps |
| Search Lost IS (Rank) | Impressions missed due to poor ad rank | (Eligible - Received) ÷ Eligible × 100 | Identify quality/bid issues | Competitive ranking gaps |
| Click Share | Percentage of available clicks received | Clicks ÷ Total Eligible Clicks × 100 | Measure click-through performance | Click-level competition |
| Share of Voice (SOV) | Traditional market share measurement | Ad Spend ÷ Total Market Ad Spend × 100 | Measure relative advertising investment | Spend-based positioning |
| Reach | Number of unique users exposed to ads | Unique Users Exposed | Measure audience size | Audience coverage |
Impression Share operates within the context of auction-based advertising systems where multiple advertisers compete for limited ad placements on search results pages. When a user performs a search query, Google’s system instantly evaluates which ads are eligible to appear based on targeting settings, approval status, and relevance. The system then ranks eligible ads based on Ad Rank, which is calculated as Bid Amount × Quality Score. Your ad may appear in various positions (top, middle, or bottom of the page) or not appear at all, depending on your competitive standing. Google’s Impression Share calculation estimates your share of all auctions where your ad was competitive enough to potentially appear. This estimation includes auctions where your ad actually showed and auctions where it would have been competitive at your current bid level. The metric explicitly excludes auctions where your ad would have required dramatically higher bids (such as a 1,000% increase) to be competitive, as these represent unrealistic scenarios. This nuanced approach means that Impression Share provides a realistic view of your competitive opportunity set rather than a theoretical maximum. The metric is available at multiple levels of granularity including campaign level, ad group level, keyword level, and product group level (for Shopping campaigns), allowing detailed analysis of performance across different organizational structures.
Impression Share directly impacts business outcomes by determining how frequently your ads appear to potential customers searching for your products or services. A high Impression Share indicates that your brand maintains strong visibility in the competitive auction landscape, increasing the likelihood of capturing customer attention and driving conversions. Conversely, low Impression Share represents missed opportunities where competitors are capturing impressions that could have driven business results. For marketing agencies, Impression Share serves as a key performance indicator demonstrating campaign management effectiveness. Agencies use this metric to identify optimization opportunities and justify budget recommendations to clients. When Impression Share is low, it signals specific problems that require targeted solutions: insufficient budget, poor Quality Score, or ineffective bidding strategies. For clients and business owners, Impression Share directly correlates with market presence and competitive positioning. A low Impression Share means competitors are outbidding or outranking your ads, potentially capturing market share. Improving Impression Share often requires strategic decisions about budget allocation, bid adjustments, or quality improvements. The metric becomes particularly important in competitive markets where multiple advertisers target the same keywords. Industry research indicates that campaigns targeting premium brand keywords often aim for 95%+ Impression Share, while campaigns with limited budgets may target 60-70% as a realistic benchmark. The appropriate target depends on business objectives, budget constraints, and competitive intensity rather than pursuing maximum Impression Share at all costs.
Google Ads provides the most comprehensive Impression Share reporting, with distinct metrics for Search Network, Display Network, and Shopping campaigns. For Search campaigns, Google reports overall Impression Share plus the two lost impression share components: Lost IS (Budget) and Lost IS (Rank). The platform also offers Exact Match Impression Share, which measures performance on the most relevant search terms, providing more granular competitive insights. Microsoft Advertising (Bing Ads) offers similar Impression Share metrics, though with slightly different calculation methodologies and available data points. Facebook Ads and Instagram Ads use different terminology but track similar concepts through metrics like Estimated Action Rate and Frequency, which measure ad delivery and competitive positioning. For Performance Max campaigns, Google combines Search and Shopping impressions in a unified Impression Share calculation, reflecting the integrated nature of these campaign types. Display campaigns have their own Impression Share metric that measures performance across the Google Display Network, which operates differently from Search due to the broader inventory of available placements. Understanding these platform-specific variations is critical for accurate performance analysis and optimization. Each platform’s Impression Share calculation reflects its unique auction dynamics, inventory availability, and competitive landscape. Marketers managing multi-platform campaigns must interpret Impression Share within each platform’s context rather than making direct comparisons across channels.
Several critical factors determine your Impression Share level, and understanding these drivers enables targeted optimization:
Daily Budget: Insufficient budget is the most common limiting factor, causing ads to stop showing after budget exhaustion. Increasing daily budget directly improves Impression Share but must be balanced against ROI objectives and profitability constraints.
Bid Amount: Lower bids reduce your competitiveness in auctions, limiting Impression Share. Bid increases improve Ad Rank and eligibility for more auctions, though with cost implications that require careful ROI analysis.
Quality Score: This Google-assigned metric (1-10) reflects ad relevance, landing page experience, and expected click-through rate. Higher Quality Scores improve Ad Rank without requiring bid increases, making quality optimization a cost-effective Impression Share improvement strategy.
Ad Relevance: Alignment between search query, ad copy, and landing page content directly impacts Quality Score and competitive positioning. Tightly themed ad groups with relevant keywords and ad copy improve Impression Share performance.
Targeting Settings: Geographic, device, and audience targeting restrictions limit eligible impressions. Broader targeting increases eligible impression pools but may reduce relevance and conversion efficiency.
Competition Intensity: Markets with many competitors bidding on the same keywords naturally have lower Impression Share for individual advertisers. Competitive dynamics are beyond direct control but can be monitored through Auction Insights.
Approval Status: Ads that violate policies or are under review cannot show, reducing Impression Share. Maintaining policy compliance ensures all ads can participate in auctions.
Ad Rank: Determined by bid × Quality Score, Ad Rank directly determines your competitive position. Improving either component enhances Impression Share without necessarily increasing costs.
Improving Impression Share requires a systematic approach addressing the specific limiting factors in your account. The first step is diagnosing whether your Impression Share limitations stem from budget constraints or competitive ranking issues. Google Ads provides this breakdown through Search Lost IS (Budget) and Search Lost IS (Rank) metrics. If budget is the primary constraint, increasing daily budget is the most direct solution, though this must be evaluated against ROI targets. If rank is the limiting factor, focus on Quality Score improvements through better ad copy, landing page optimization, and relevance enhancements. Bid optimization should be strategic rather than reactive, using data-driven approaches to identify high-value keywords where bid increases will drive meaningful Impression Share improvements. Tools like Auction Insights reveal competitive dynamics, showing how often competitors appear in the same auctions and their relative positioning. This competitive intelligence informs bidding decisions and helps identify keywords where increased investment will yield competitive advantages. Keyword refinement improves relevance and Quality Score by ensuring tight alignment between keywords, ad copy, and landing pages. Removing broad or irrelevant keywords reduces wasted impressions and improves overall campaign efficiency. Ad copy testing identifies messaging that resonates with audiences and improves expected click-through rates, directly boosting Quality Score. Landing page optimization ensures that pages deliver on ad promises, improving user experience signals that Google uses in Quality Score calculations. Regular monitoring of Impression Share trends over weeks and months reveals whether optimization efforts are yielding results. Sudden drops in Impression Share may indicate competitive changes, budget issues, or quality problems requiring investigation. Conversely, steady Impression Share improvements demonstrate effective optimization and competitive positioning gains.
In the evolving landscape of AI-powered search and content generation, Impression Share takes on additional strategic significance. As AI systems like ChatGPT, Perplexity, Google AI Overviews, and Claude increasingly influence consumer information gathering, traditional paid search Impression Share becomes one component of a broader visibility strategy. Brands must now monitor not only their share of paid search impressions but also their presence in AI-generated responses and citations. AmICited and similar AI monitoring platforms track brand mentions and visibility across AI systems, complementing traditional Impression Share metrics. A brand might achieve 85% Impression Share in Google Ads but receive minimal mentions in AI Overviews, representing a significant visibility gap. Conversely, strong AI citation presence combined with solid paid search Impression Share creates comprehensive market visibility. The relationship between these metrics reveals competitive positioning across different discovery channels. Brands winning in the modern digital landscape optimize across both traditional paid search Impression Share and emerging AI visibility metrics. This integrated approach recognizes that consumer decision-making now involves multiple information sources, and comprehensive visibility requires presence across all relevant channels. Marketing teams increasingly view Impression Share as one element of a holistic visibility strategy rather than an isolated metric.
Impression Share continues to evolve as advertising platforms adapt to changing consumer behavior and technological advancement. The rise of AI-powered bidding strategies and automated campaign management is shifting how marketers approach Impression Share optimization. Rather than manual bid adjustments, Smart Bidding strategies like Target CPA and Target ROAS automatically optimize bids to achieve business objectives while managing Impression Share as a secondary consideration. This represents a philosophical shift from maximizing Impression Share to optimizing for profitable outcomes. The integration of first-party data and audience targeting is changing how Impression Share is calculated and interpreted. As platforms move away from third-party cookies, audience-based targeting becomes increasingly important, potentially altering the composition of eligible impressions. Brands with rich first-party data may achieve higher Impression Share within their target audiences despite lower overall market share. The emergence of AI-generated search results and AI Overviews introduces new dimensions to visibility measurement. Traditional Impression Share measures paid search visibility, but brands increasingly need metrics measuring presence in AI-generated content. Future evolution may see unified visibility metrics combining paid search Impression Share with AI citation share, providing comprehensive competitive positioning insights. Privacy-focused advertising and cookieless tracking will continue reshaping how platforms estimate eligible impressions and calculate Impression Share. Platforms may rely more heavily on aggregated data and machine learning models rather than individual user tracking, potentially affecting Impression Share precision. The metric’s fundamental importance to competitive positioning ensures it will remain central to advertising strategy, even as calculation methodologies and optimization approaches evolve. Marketers who understand Impression Share fundamentals will adapt more effectively to these changes, maintaining competitive advantage regardless of platform evolution.
Impression Share represents a fundamental metric for understanding competitive visibility in auction-based advertising systems. By measuring the percentage of available impressions your ads capture, this metric reveals whether your campaigns are reaching their full potential or missing opportunities due to budget, quality, or competitive constraints. The calculation methodology, while sophisticated, provides actionable insights that guide optimization decisions. Industry benchmarks indicate that median SMB campaigns achieve approximately 38% Impression Share, with well-optimized campaigns targeting 80-90% and premium brand campaigns often exceeding 95%. However, the appropriate target depends on business objectives, budget constraints, and competitive dynamics rather than pursuing maximum Impression Share at all costs. Effective Impression Share management requires understanding the specific limiting factors in your account—whether budget constraints or competitive ranking issues—and implementing targeted solutions. Quality Score improvements, bid optimization, and strategic budget allocation represent the primary levers for Impression Share enhancement. In the modern marketing landscape, Impression Share must be considered alongside emerging metrics measuring AI visibility and brand presence across AI systems. Comprehensive competitive positioning requires monitoring both traditional paid search Impression Share and presence in AI-generated responses. As advertising platforms continue evolving with AI integration and privacy-focused approaches, the fundamental importance of Impression Share to competitive strategy will persist, though calculation methodologies and optimization approaches will adapt accordingly.
Impression Share (IS) measures the percentage of all eligible impressions your ads received, while Absolute Top Impression Share (ATIS) specifically measures impressions shown in the most prominent position on search results. Since there is only one absolute top position per search, ATIS will always be lower than overall IS. ATIS is particularly important for understanding your dominance in premium ad placements and competitive positioning.
Insufficient daily budget is one of the primary factors limiting Impression Share. When your budget runs out during the day, your ads stop showing, resulting in 'Search Lost Impression Share (Budget).' This metric specifically tracks the percentage of impressions you missed due to budget constraints. Increasing your daily budget is often the most direct way to improve overall Impression Share, though it must be balanced against ROI objectives.
Industry benchmarks vary by campaign type and competitiveness. The median Impression Share for SMB Google Ads campaigns is approximately 38%, while well-performing campaigns typically target 80-90% Impression Share. For premium brand keywords with high search volume, targets often reach 95% or higher. However, the appropriate benchmark depends on your budget, competition level, and business objectives rather than pursuing maximum IS at all costs.
Ad Rank directly influences Impression Share through the 'Search Lost Impression Share (Rank)' metric, which shows impressions lost due to poor ad positioning. Ad Rank is determined by your bid amount, Quality Score, and ad relevance. Improving Quality Score through better ad copy, landing page experience, and expected click-through rates can increase Ad Rank without raising bids, thereby improving Impression Share and competitive visibility.
No, high Impression Share does not automatically correlate with better return on investment. In fact, achieving very high Impression Share often requires significant budget increases that may result in diminishing returns. The relationship between Impression Share and ROI follows a response curve where initial investments drive strong returns, but additional spending at high IS levels yields lower incremental gains. Optimal marketing performance requires balancing Impression Share with conversion efficiency and profitability metrics.
Shopping campaign Impression Share is calculated similarly to text ads but accounts for multiple Shopping ads from the same advertiser appearing simultaneously. Google assigns the impression opportunity to the highest-ranked Shopping ad from each advertiser to avoid double-counting. Only the first impression per search qualifies for Impression Share calculation, though all ads receive impressions. This methodology ensures accurate competitive positioning measurement across product listings.
Eligible impressions are estimated using multiple factors including your targeting settings (location, device, audience), ad approval status, Quality Score, bid competitiveness, and estimated relevance. Google's system estimates which auctions your ad would be competitive in, even if you didn't actually bid in all of them. Small fluctuations in eligible impressions don't necessarily indicate action is needed, as changes to bids, quality, or Google's systems can alter the estimated competitive set.
For brands using AI monitoring platforms like AmICited, Impression Share serves as a critical metric for understanding competitive visibility in paid search channels. Tracking Impression Share across branded and non-branded keywords helps identify whether competitors are outbidding or outranking your ads. This data complements AI citation monitoring by providing comprehensive visibility insights across both organic AI responses and paid search auctions, enabling holistic brand presence optimization.
Start tracking how AI chatbots mention your brand across ChatGPT, Perplexity, and other platforms. Get actionable insights to improve your AI presence.
Learn what an impression is in search results and AI monitoring. Understand how impressions are counted across Google Search, Perplexity, ChatGPT, and other pla...
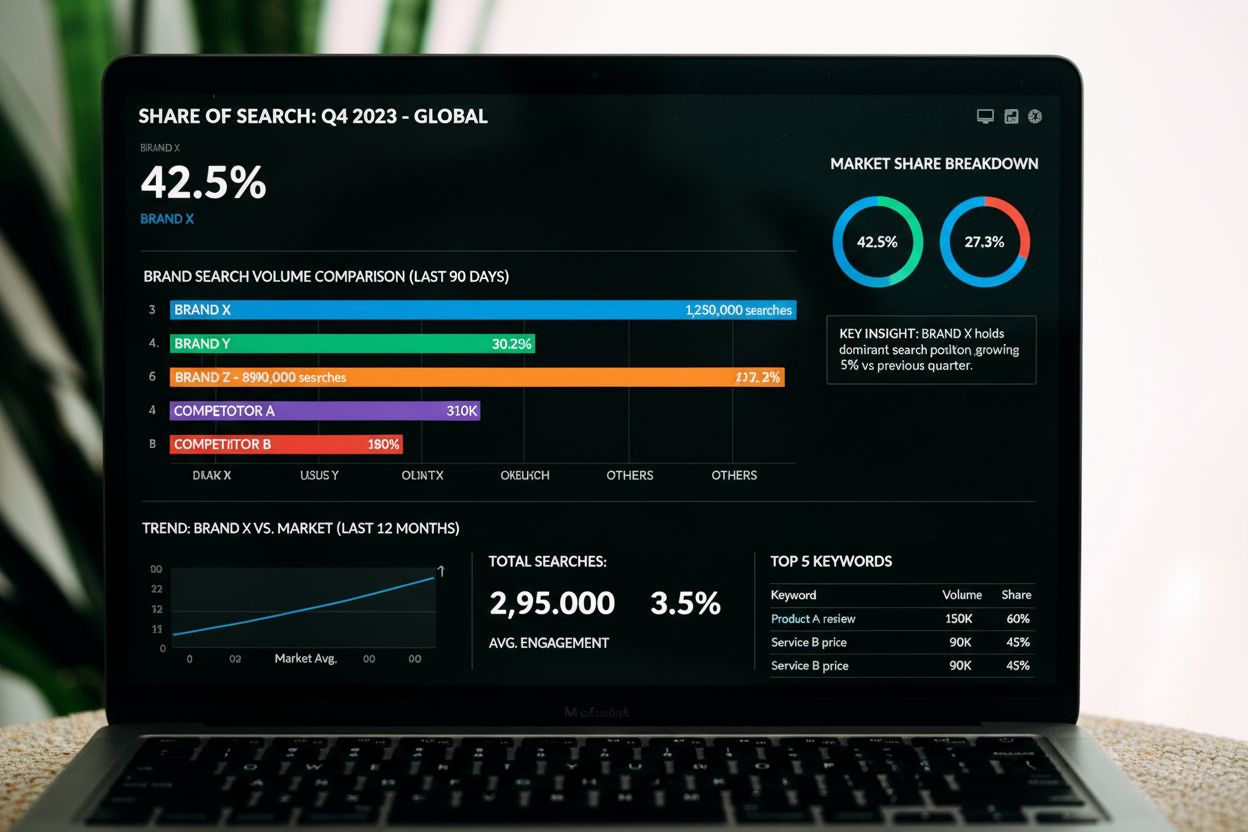
Share of Search measures brand search volume relative to category competitors. Learn how this metric predicts market share, correlates with sales, and impacts A...
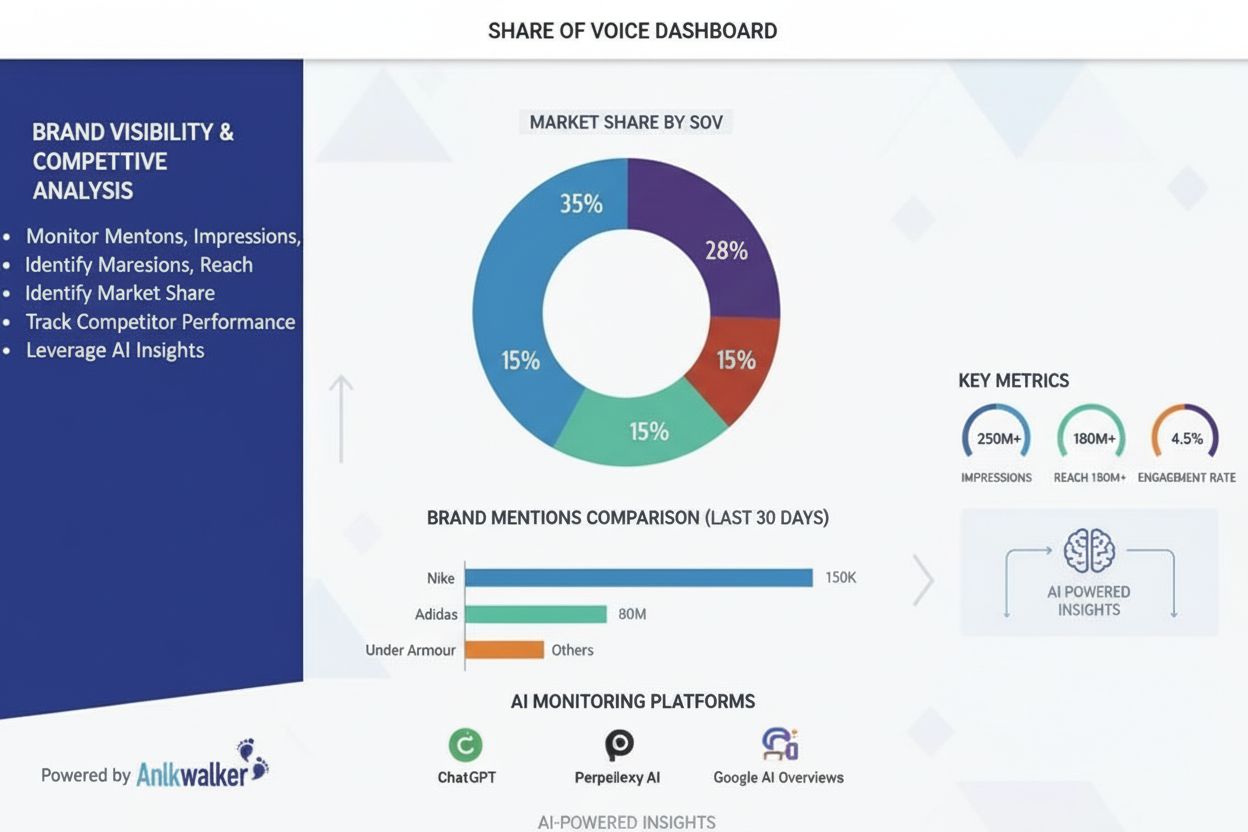
Share of Voice measures brand visibility compared to competitors across marketing channels. Learn how to calculate SOV, track it across AI platforms, and increa...