First Input Delay (FID)
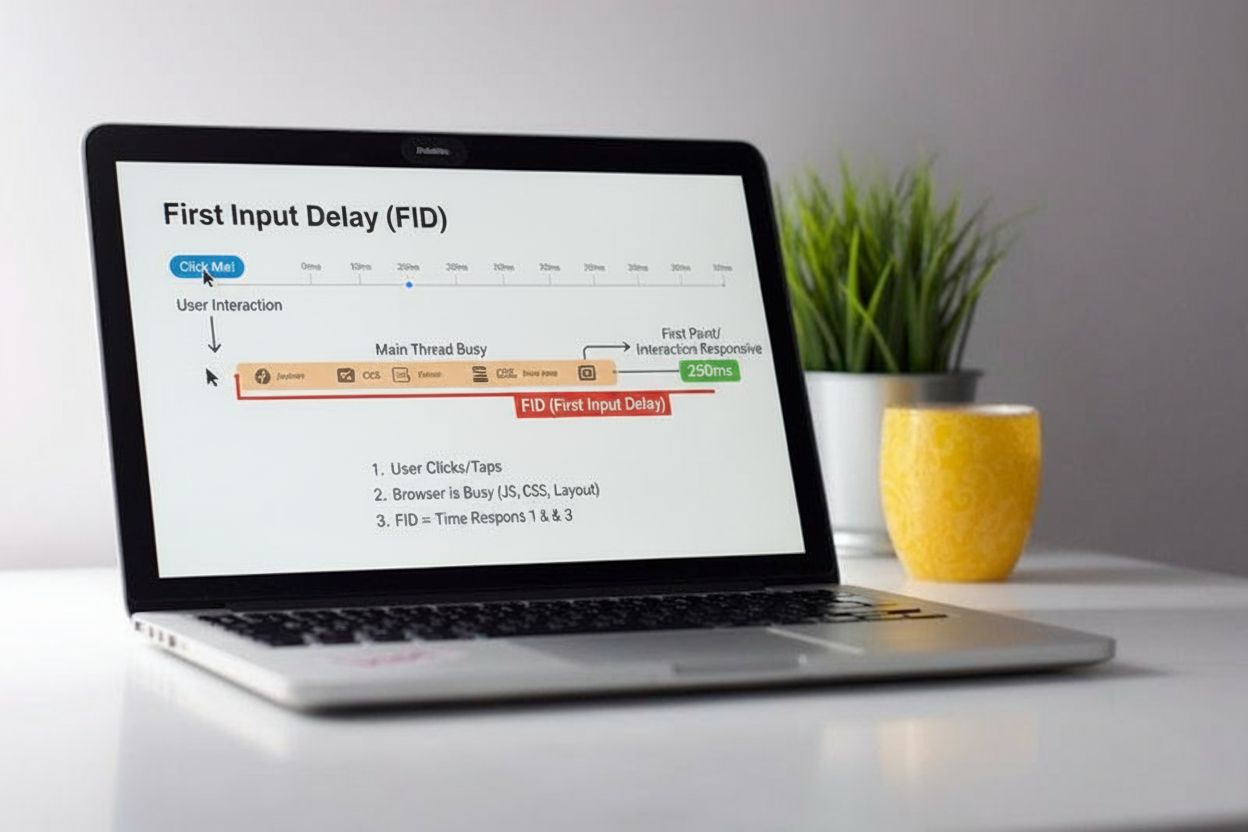
First Input Delay (FID) measures responsiveness by tracking the delay between user interaction and browser processing. Learn how FID impacts user experience and...
11 min read
Interaction to Next Paint (INP) is a Core Web Vitals metric that measures the responsiveness of a webpage by tracking the time between a user interaction (click, tap, or keypress) and the browser’s next visual update. Introduced in May 2022 and officially replacing First Input Delay (FID) in March 2024, INP assesses the overall responsiveness of a page throughout the entire user session, not just the first interaction.
Interaction to Next Paint (INP) is a Core Web Vitals metric that measures the responsiveness of a webpage by tracking the time between a user interaction (click, tap, or keypress) and the browser's next visual update. Introduced in May 2022 and officially replacing First Input Delay (FID) in March 2024, INP assesses the overall responsiveness of a page throughout the entire user session, not just the first interaction.
Interaction to Next Paint (INP) is a Core Web Vitals metric that measures how quickly a webpage responds to user interactions by tracking the time elapsed between when a user initiates an action (such as clicking a button, tapping on a touchscreen, or pressing a keyboard key) and when the browser renders the next visual update. Introduced by Google’s Chrome team in May 2022 as an experimental metric and officially promoted to a stable Core Web Vital in March 2024, INP replaced First Input Delay (FID) as the primary responsiveness metric for evaluating page experience. Unlike FID, which only measured the delay of the first interaction on a page, INP provides a comprehensive assessment of responsiveness by observing all interactions throughout the entire user session. This shift reflects a more holistic approach to measuring user experience, recognizing that 90% of a user’s time on a page occurs after it loads, making consistent responsiveness throughout the session critical for user satisfaction and SEO performance.
The introduction of INP represents a significant evolution in how Google measures and evaluates website responsiveness. For years, First Input Delay (FID) served as the primary responsiveness metric within Core Web Vitals, focusing exclusively on the input delay component of the first user interaction. However, research and real-world testing revealed substantial limitations with FID’s approach. The metric only captured the delay before event handlers began executing, ignoring the time spent actually processing the interaction and rendering the visual response. Additionally, FID’s focus on the first interaction meant that pages with poor responsiveness later in the user session could still achieve good FID scores, creating a misleading picture of overall page responsiveness. In response to these limitations, Google’s Chrome team began exploring alternative metrics in 2021, ultimately announcing INP as an experimental metric in May 2022. After nearly two years of community testing and feedback gathering, INP officially became a stable Core Web Vital on March 12, 2024, replacing FID entirely. This transition underscores Google’s commitment to providing more accurate, user-centric performance metrics that better reflect real-world browsing experiences.
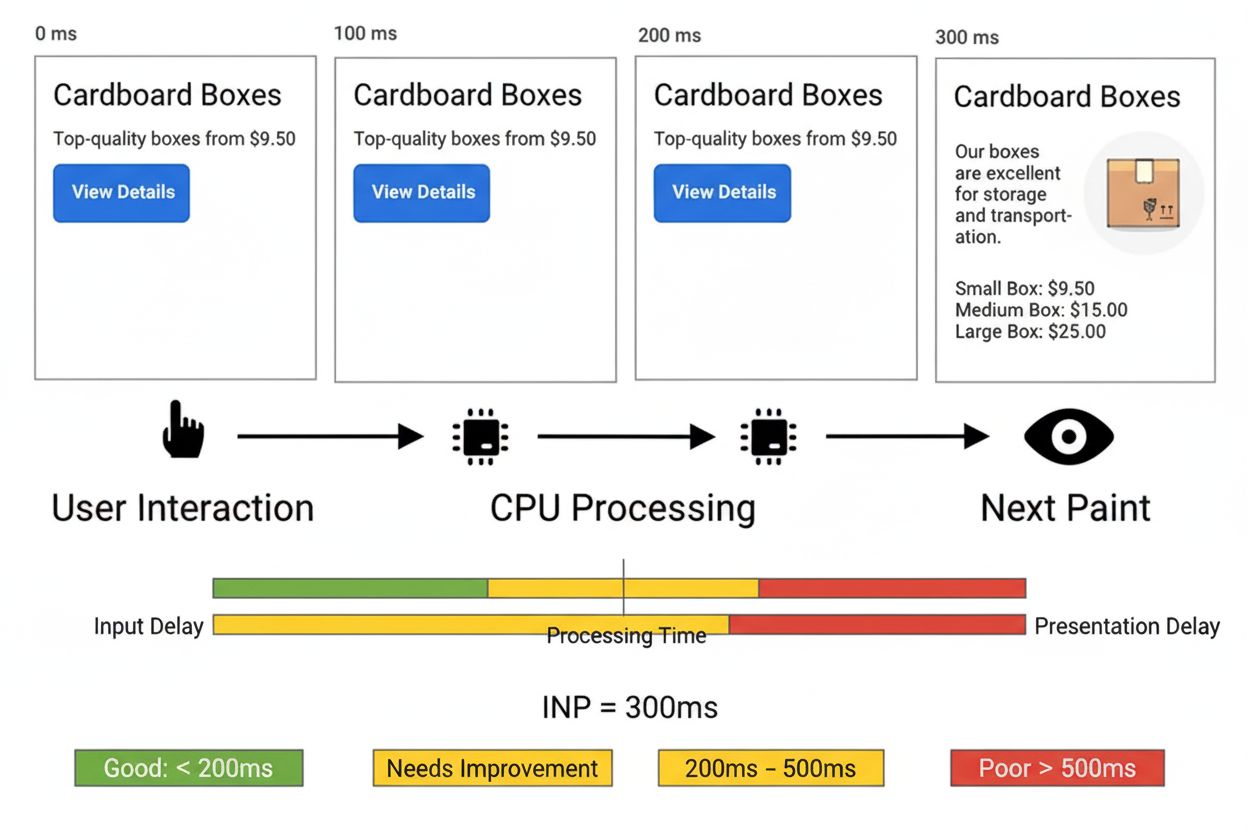
INP measures responsiveness by tracking three distinct phases of user interaction: input delay, processing time, and presentation delay. The input delay represents the time between when a user initiates an action and when the browser begins executing the associated event handlers, often caused by long tasks or background processing blocking the main thread. The processing time encompasses the duration required for all event handler callbacks to execute, including JavaScript code that responds to the user’s action. Finally, the presentation delay is the time between when event handlers complete and when the browser paints the next frame, which may involve layout recalculation, style updates, and rendering work. The total INP value represents the sum of these three components for a single interaction. Importantly, INP is calculated as the 98th percentile of all interactions on a page, meaning that if a page receives many interactions, Google ignores the worst 2% as outliers and reports the responsiveness that the vast majority of users experience. For pages with fewer than 50 interactions, INP typically reports the worst interaction observed. This percentile-based approach ensures that occasional performance hiccups don’t disproportionately penalize sites that are generally responsive.
| Metric | Measures | Scope | Threshold (Good) | Threshold (Poor) | Status |
|---|---|---|---|---|---|
| Interaction to Next Paint (INP) | Full interaction cycle (input delay + processing + presentation) | All interactions throughout session | ≤ 200ms | > 500ms | Active Core Web Vital (March 2024+) |
| First Input Delay (FID) | Input delay only (before event handlers run) | First interaction only | ≤ 100ms | > 300ms | Deprecated (replaced by INP) |
| Total Blocking Time (TBT) | Main thread blocking during page load | Load phase only | ≤ 300ms | > 600ms | Lab metric (not field metric) |
| Largest Contentful Paint (LCP) | Time to render largest visible element | Load phase | ≤ 2.5s | > 4s | Active Core Web Vital |
| Cumulative Layout Shift (CLS) | Visual stability and unexpected layout changes | Entire session | ≤ 0.1 | > 0.25 | Active Core Web Vital |
Google defines INP performance thresholds at the 75th percentile of page loads, segmented by device type (mobile and desktop). An INP below 200 milliseconds indicates good responsiveness, meaning the page responds quickly to user interactions and provides immediate visual feedback. An INP between 200 and 500 milliseconds falls into the “needs improvement” category, suggesting that while the page is functional, users may perceive noticeable delays that could impact satisfaction. An INP above 500 milliseconds is classified as poor, indicating significant responsiveness issues that likely frustrate users and negatively impact engagement and conversions. According to the 2024 Web Almanac by HTTP Archive, 74% of mobile websites and 97% of desktop websites achieved good INP scores, revealing a substantial performance gap between mobile and desktop experiences. This 23-percentage-point difference highlights the ongoing challenges developers face in optimizing responsiveness for mobile devices, which typically have less processing power and more variable network conditions than desktop computers. The data underscores why INP optimization is critical for mobile-first web development, as mobile users represent the majority of web traffic for most sites.
INP is one of three Core Web Vitals metrics that Google uses to evaluate page experience and determine search rankings, alongside Largest Contentful Paint (LCP) for loading performance and Cumulative Layout Shift (CLS) for visual stability. Google has explicitly stated that Core Web Vitals are ranking factors, meaning pages with poor INP scores may experience reduced visibility in search results. This makes INP optimization not merely a user experience concern but a critical SEO imperative. The business impact of INP optimization has been demonstrated through real-world case studies: RedBus, an online bus ticketing platform, achieved a 7% increase in sales by optimizing their website’s INP from 870-900ms to 350-370ms through techniques like debouncing scroll event handlers, optimizing input component state management, and reducing unnecessary re-rendering. This case study illustrates that INP improvements directly correlate with improved business metrics, including increased conversions, reduced bounce rates, and improved user retention. For e-commerce sites, SaaS platforms, and any business relying on user interactions, INP optimization represents a high-ROI investment in both user experience and search visibility.
Developers can employ several evidence-based strategies to reduce INP and improve page responsiveness. Reducing input delay requires minimizing background processing that blocks the main thread, such as breaking up long tasks using the scheduler.yield() API, deferring non-critical JavaScript execution, and optimizing third-party script loading. Optimizing processing time involves streamlining event handler callbacks to perform only essential work, using techniques like debouncing and throttling to limit event handler execution frequency, and leveraging frameworks like React to prevent unnecessary component re-renders through memoization. Reducing presentation delay can be achieved by minimizing DOM complexity, using CSS containment to limit rendering scope, and deferring non-critical visual updates. Additionally, developers should profile interactions using Chrome DevTools to identify which specific functions and scripts contribute most to INP delays, then prioritize optimizations with the highest impact. Real User Monitoring (RUM) solutions provide invaluable data about which page elements users interact with most frequently and which interactions are slowest, enabling data-driven optimization decisions. The web-vitals JavaScript library allows developers to measure INP programmatically and send data to analytics platforms, facilitating continuous monitoring and improvement.
INP can be measured through both field data and lab testing, though field data from real users provides the most accurate representation of actual performance. Google PageSpeed Insights displays INP metrics based on data from the Chrome User Experience Report (CrUX), showing the 75th percentile of real user experiences for pages that receive sufficient traffic. Google Search Console includes an INP report in its Core Web Vitals section, allowing site owners to identify pages with poor responsiveness and track improvements over time. Chrome DevTools Performance tab enables developers to record and analyze individual interactions, showing the breakdown of input delay, processing time, and presentation delay components. The web-vitals JavaScript library provides a programmatic way to measure INP in production environments and send data to custom analytics backends. Real User Monitoring (RUM) solutions like DebugBear, Datadog, and New Relic offer detailed insights into INP performance, including attribution data showing which scripts and components contribute to delays. The INP Debugger tool automatically identifies clickable page elements and simulates interactions to identify slow interactions in a lab environment. For comprehensive INP optimization, developers should combine multiple measurement approaches: using CrUX data to understand baseline performance, RUM to identify problematic interactions in production, and DevTools to diagnose root causes and validate fixes.
As AI-powered search systems like ChatGPT, Perplexity, Google AI Overviews, and Claude increasingly reference and cite web content, page responsiveness becomes a factor in AI system evaluation and citation patterns. While INP doesn’t directly affect whether an AI system cites your content, pages with poor responsiveness may receive lower engagement metrics (bounce rate, time on page, interaction depth) that indirectly influence content quality signals. Additionally, AI systems increasingly prioritize user experience signals when evaluating source credibility and relevance. A page that responds quickly to user interactions demonstrates technical competence and professionalism, potentially influencing how AI systems evaluate and rank content for citation. For organizations using AmICited to monitor their brand and domain appearances in AI responses, understanding INP becomes part of a holistic content optimization strategy. Pages that are both responsive (good INP) and contain high-quality, authoritative content are more likely to be cited by AI systems. Furthermore, as AI systems become more sophisticated in evaluating user experience signals, maintaining good INP scores may become an increasingly important factor in AI citation patterns, making INP optimization relevant not just for traditional SEO but for emerging AI search visibility.
The web performance landscape continues to evolve, and INP itself may undergo refinements as browser capabilities and user expectations change. Google maintains a detailed INP changelog documenting changes to how the metric is calculated across different Chrome versions, reflecting ongoing improvements and bug fixes. Recent developments include the introduction of the Long Animation Frames (LoAF) API, which provides detailed attribution data showing which scripts contribute to rendering delays, enabling more precise INP optimization. Additionally, alert and confirm dialogs were excluded from INP calculations as of Chrome 127, reflecting refinements in what constitutes a meaningful user interaction. Looking forward, developers should expect continued evolution in how responsiveness is measured and evaluated. The emergence of interaction-specific performance budgets and framework-level optimizations suggests that INP optimization will become increasingly integrated into development workflows rather than treated as an afterthought. As mobile devices continue to dominate web traffic and user expectations for responsiveness increase, maintaining good INP scores will remain a critical competitive advantage. Organizations should view INP not as a temporary metric to optimize for but as a fundamental aspect of building user-centric, performant web experiences that serve both human users and AI systems effectively.
scheduler.yield() and async patterns to prevent input delay during page load and background processing+++
INP and FID are both responsiveness metrics, but INP is more comprehensive. FID only measured the input delay of the first interaction on a page, while INP measures the entire responsiveness cycle (input delay, processing time, and presentation delay) for all interactions throughout the user's visit. INP officially replaced FID as a Core Web Vital in March 2024, providing a more accurate assessment of overall page responsiveness.
According to Google's Core Web Vitals guidelines, an INP below 200 milliseconds is considered good, between 200-500 milliseconds needs improvement, and above 500 milliseconds is poor. These thresholds are measured at the 75th percentile of page loads across mobile and desktop devices to ensure most users experience good responsiveness.
INP is a Core Web Vitals metric that directly affects Google search rankings. Pages with poor INP scores may experience lower visibility in search results, while pages with good INP scores receive a ranking boost. This makes INP optimization essential for SEO success, as it's one of three primary signals Google uses to evaluate page experience.
INP measures three types of user interactions: mouse clicks, touchscreen taps, and keyboard input (including keydown, keypress, and keyup events). It does not measure hovering, scrolling, or zooming interactions. INP tracks interactions with any page element, whether it's a button, form field, or other interactive component.
While INP is primarily a field metric requiring real user interactions, it can be measured in lab environments through synthetic testing by scripting user interactions. However, lab measurements may not fully represent real-world performance since different users interact with different elements at different times. Real User Monitoring (RUM) provides more accurate INP data.
INP consists of three components: Input Delay (time before event handlers start running), Processing Time (time for event handlers to execute), and Presentation Delay (time after callbacks until the next frame is painted). The total INP is measured from the start of user input until the browser renders the next visual update.
To improve INP, reduce input delay by breaking up long tasks and minimizing background processing, optimize event callbacks to execute faster, and reduce presentation delay by minimizing DOM complexity. Using tools like Chrome DevTools, Real User Monitoring, and the web-vitals library can help identify which interactions are slow and what optimizations will have the most impact.
Start tracking how AI chatbots mention your brand across ChatGPT, Perplexity, and other platforms. Get actionable insights to improve your AI presence.
First Input Delay (FID) measures responsiveness by tracking the delay between user interaction and browser processing. Learn how FID impacts user experience and...
Core Web Vitals are Google's three key metrics measuring page loading, interactivity, and visual stability. Learn LCP, INP, CLS thresholds and their impact on S...

Page speed measures how quickly a webpage loads. Learn about Core Web Vitals metrics, why page speed matters for SEO and conversions, and how to optimize loadin...
Cookie Consent
We use cookies to enhance your browsing experience and analyze our traffic. See our privacy policy.