Session Duration
Session duration measures the total time users spend on a website per visit. Learn how to calculate it, why it matters for engagement, and how to improve it wit...
12 min read
Pages Per Session is a web analytics metric that measures the average number of pages a user views during a single session on a website. This engagement indicator reflects user interest in content and the effectiveness of site navigation, with higher values typically indicating better user engagement and content relevance.
Pages Per Session is a web analytics metric that measures the average number of pages a user views during a single session on a website. This engagement indicator reflects user interest in content and the effectiveness of site navigation, with higher values typically indicating better user engagement and content relevance.
Pages Per Session is a fundamental web analytics metric that measures the average number of pages a user views during a single session on a website. This metric is calculated by dividing the total number of pageviews by the total number of sessions during a specific time period. Pages Per Session serves as a critical indicator of user engagement, content effectiveness, and the overall quality of the user experience on a website. When users view multiple pages during their visit, it demonstrates that they find your content valuable, relevant, and compelling enough to explore further. This metric is particularly important because it directly reflects how well your website guides visitors through your content and encourages deeper interaction with your brand.
The significance of Pages Per Session extends beyond simple engagement measurement. It provides actionable insights into user behavior patterns, content performance, and the effectiveness of your site’s navigation structure. A higher Pages Per Session value typically indicates that visitors are satisfied with what they find and are motivated to continue exploring, which often translates to better conversion opportunities. Conversely, a lower value may suggest that users are finding what they need quickly and leaving, or alternatively, that navigation issues are preventing them from discovering additional relevant content. Understanding this metric helps digital marketers, content strategists, and website owners make data-driven decisions about content optimization, user experience improvements, and overall digital strategy refinement.
The concept of Pages Per Session emerged as web analytics became increasingly sophisticated in the early 2000s. As websites evolved from simple informational portals to complex, multi-page experiences, the need to understand how users navigated these digital environments became critical. Google Analytics, launched in 2005, popularized this metric and made it accessible to website owners worldwide. The metric gained prominence because it provided a simple yet powerful way to measure user engagement without requiring complex behavioral analysis. Over the past two decades, Pages Per Session has become a standard KPI across industries, from eCommerce to publishing, SaaS to healthcare.
The evolution of Pages Per Session tracking has paralleled the growth of digital marketing itself. In the early days, marketers focused primarily on traffic volume and basic conversion metrics. However, as competition intensified and user experience became a differentiator, understanding engagement depth became essential. According to research from Littledata analyzing nearly 6,000 websites, the average Pages Per Session across all industries stands at approximately 2.6 pages, with the top 20% of websites achieving 4.0 pages per session and the elite top 10% reaching 5.2 pages per session. These benchmarks have remained relatively consistent over recent years, though they vary significantly by industry, traffic source, and device type. The metric’s importance has only increased with the rise of AI-powered search platforms and the need to understand how content performs across multiple digital touchpoints.
| Metric/Industry | Average Pages Per Session | Recommended Target | Key Characteristics |
|---|---|---|---|
| Apparel & Footwear | 9.01 | 8.11 | High product variety drives comparison shopping |
| eCommerce & Retail | 4.72 | 5.66 | Users browse multiple products before purchase |
| Education | 6.68 | 7.35 | Research-intensive decision-making process |
| Healthcare | 4.04 | 4.85 | Users seek detailed medical information |
| SaaS | 2.61 | 3.39 | Targeted browsing, focused user intent |
| Consulting Services | 2.22 | 2.89 | B2B users have specific information needs |
| Organic Search Traffic | 5.8 | 6.5+ | High intent, strong content match |
| Paid Search Traffic | 2.9 | 3.5+ | Transaction-focused, lower exploration |
| Email Marketing | 3.6 | 4.2+ | Prior brand trust increases engagement |
| Social Media Traffic | 3.2 | 4.0+ | Lower initial intent, discovery-driven |
| Desktop Users | 4.9 | 5.5+ | More screen space enables browsing |
| Mobile Users | 4.4 | 5.0+ | Smaller screens reduce browsing depth |
The calculation of Pages Per Session is straightforward but requires accurate data collection and proper implementation of analytics tracking. The fundamental formula is: Pages Per Session = Total Pageviews / Total Sessions. To illustrate with a practical example, if your website recorded 75,000 total pageviews across 50,000 sessions during a month, your Pages Per Session would be 1.5. This means that on average, each visitor viewed 1.5 pages before leaving. It’s important to note that this metric counts repeated views of the same page within a single session, so if a user visits the homepage, then a product page, then returns to the homepage, that counts as three pageviews.
The technical implementation of Pages Per Session tracking relies on proper analytics setup and configuration. Google Analytics 4 (GA4), the current standard for web analytics, automatically calculates this metric and displays it in various reports. However, understanding the underlying mechanics helps you interpret the data more effectively. The metric is session-based rather than user-based, meaning it calculates the average across all sessions, not individual users. This distinction is important because a single user might have multiple sessions, each with different Pages Per Session values. Additionally, the metric can be segmented by various dimensions including traffic source, device type, geographic location, user behavior, and time period, allowing for granular analysis of engagement patterns. Modern analytics platforms also allow you to create custom reports that track Pages Per Session alongside other metrics like bounce rate, average session duration, and conversion rate to gain comprehensive insights into user behavior.
Pages Per Session directly impacts business outcomes across multiple dimensions. For eCommerce businesses, research demonstrates that users who view 6 or more pages during a shopping session are 75% more likely to convert than those viewing fewer pages. This correlation exists because multiple page views indicate active product research and comparison, which are strong indicators of purchase intent. In the retail sector specifically, top-performing websites report Pages Per Session values between 4 to 6, with some high-performing sites reaching 5.01 pages on desktop and maintaining strong engagement on mobile platforms as well. The metric becomes even more pronounced in specialized sectors—online grocery stores, for instance, frequently see 15-20 pages per session and sometimes exceed 30 pages during peak shopping periods, as customers browse multiple product categories to fill their virtual carts.
Beyond conversion metrics, Pages Per Session serves as a proxy for content satisfaction and user experience quality. When visitors view multiple pages, they’re implicitly voting with their behavior that your content meets their needs and interests them enough to continue exploring. This engagement signal has become increasingly important in the context of search engine optimization and AI-powered search platforms. Search engines like Google consider engagement metrics as ranking factors, and higher Pages Per Session values suggest that your website provides valuable content that keeps users engaged. For content publishers and blogs, maintaining healthy Pages Per Session values is essential for monetization through advertising, as more page views translate directly to more ad impressions and revenue opportunities. Additionally, Pages Per Session data helps identify which content types, topics, and formats resonate most with your audience, informing your content strategy and editorial decisions.
Different analytics platforms and AI monitoring tools handle Pages Per Session measurement with varying approaches and capabilities. Google Analytics 4 remains the most widely used platform and provides Pages Per Session data through its standard reports and custom explorations. To access this metric in GA4, users navigate to the Explore section, create a new exploration, add dimensions like “Page path and screen class” and “Session medium,” and add the metric “Views per session” to their report. The platform also allows for segmentation by traffic source, device type, and other dimensions, enabling detailed analysis of engagement patterns across different user groups.
AmICited, as an AI prompts monitoring platform, approaches Pages Per Session from a unique perspective by tracking how your brand and content appear across AI-powered search platforms like ChatGPT, Perplexity, Google AI Overviews, and Claude. While traditional Pages Per Session measures user behavior on your own website, AmICited helps you understand how your content performs when cited or referenced in AI-generated responses. This represents an emerging dimension of digital presence monitoring, as AI systems increasingly influence how users discover and interact with information. Understanding your brand’s visibility and citation frequency across these platforms becomes increasingly important as AI search continues to grow. Other analytics platforms like Contentsquare, Independent Analytics, and AgencyAnalytics each provide their own implementations of Pages Per Session tracking, often with additional features like session replay, heatmaps, and advanced segmentation capabilities that help marketers understand not just how many pages users view, but how they interact with those pages.
Improving Pages Per Session requires a multifaceted approach that addresses content quality, site structure, and user experience simultaneously. The most effective strategy is to improve site navigation by creating clear, intuitive menu structures and implementing breadcrumb navigation that helps users understand their location within your site hierarchy. When visitors can easily find related content and understand how pages connect to each other, they’re more likely to continue exploring. Strategic internal linking is equally important—by placing contextual links to relevant content within your pages, you create natural pathways that encourage users to view additional pages. These links should be genuinely relevant to the content and user intent, not forced or manipulative, as users quickly recognize and ignore irrelevant links.
Content quality and relevance form the foundation of higher Pages Per Session values. Users will only view multiple pages if they find the content valuable and engaging. This means understanding your audience’s needs, questions, and pain points, then creating comprehensive content that addresses these thoroughly. For eCommerce sites, product recommendations and related product suggestions significantly boost Pages Per Session—research shows that well-implemented recommendation systems can increase this metric by 25-40%. Page load speed is another critical factor; each second of delay decreases pages viewed by approximately 11%, so optimizing your site’s performance is essential. Mobile optimization deserves special attention, as sites with responsive designs see 31% more pages viewed on smartphones compared to non-optimized competitors. Additionally, analyzing your traffic sources and focusing on channels that deliver higher-engagement visitors can improve your overall Pages Per Session metric. Organic search traffic, for instance, averages 5.8 pages per session compared to paid search’s 2.9 pages, so investing in SEO may yield better engagement metrics than paid advertising alone.
The definition and application of Pages Per Session is evolving as digital ecosystems become more complex and AI-powered platforms gain prominence. Traditionally, Pages Per Session has been measured within the context of a single website, but the rise of AI search platforms like ChatGPT, Perplexity, and Google AI Overviews introduces new dimensions to how content is discovered and consumed. In these AI-driven environments, users may not visit your website directly but instead encounter your content through AI-generated summaries or citations. This shift necessitates a broader understanding of engagement metrics that extends beyond traditional website analytics. AmICited and similar platforms are pioneering this evolution by tracking how frequently your brand and content appear in AI responses, effectively creating a new form of “Pages Per Session” metric for the AI era.
The future of Pages Per Session measurement will likely involve integration with multiple data sources and platforms. As users increasingly interact with content across websites, mobile apps, social media, and AI platforms, understanding engagement requires a more holistic view. Privacy regulations like GDPR and the deprecation of third-party cookies are also influencing how Pages Per Session is measured and reported, pushing the industry toward first-party data collection and more sophisticated analytics approaches. Additionally, the rise of single-page applications (SPAs) and progressive web apps (PWAs) is challenging traditional Pages Per Session measurement, as these technologies load content dynamically without traditional page reloads. Analytics platforms are adapting by tracking “screen views” or “interactions” rather than traditional pageviews, ensuring that engagement metrics remain relevant in modern web architectures. Looking forward, Pages Per Session will likely become increasingly integrated with AI-powered insights that can explain why users view certain numbers of pages and predict which optimizations will most effectively improve engagement metrics.
Pages Per Session remains one of the most important and actionable metrics in digital analytics, providing clear insights into user engagement, content effectiveness, and website performance. Whether you’re running an eCommerce store, publishing content, or managing a SaaS platform, understanding and optimizing this metric directly impacts your business outcomes. The metric’s simplicity—measuring the average number of pages viewed per session—belies its profound importance in understanding user behavior and satisfaction. By implementing the optimization strategies outlined above and regularly monitoring your Pages Per Session across different segments and traffic sources, you can make informed decisions that improve user experience, increase conversions, and strengthen your overall digital presence. As digital ecosystems continue to evolve and AI platforms become increasingly important in how users discover content, the principles underlying Pages Per Session measurement will remain relevant, even as the specific implementations and platforms continue to adapt and innovate.
Pages Per Session is calculated by dividing the total number of pageviews by the total number of sessions during a specific period. The formula is: Pages Per Session = Total Pageviews / Total Sessions. For example, if your website generated 75,000 pageviews across 50,000 sessions, your Pages Per Session would be 1.5. This calculation includes repeated views of the same page within a single session, providing a comprehensive view of user engagement depth.
Industry benchmarks vary significantly by website type and sector. According to recent data, blogs typically average 1.4 pages per session, general business websites average 1.7 pages, and eCommerce sites average 4.0 pages per session. Overall, a benchmark of 2.6 pages per session is considered solid across all industries, with top 20% of websites achieving 4.0 pages and top 10% reaching 5.2 pages per session. Your specific target should align with your industry, content strategy, and business objectives.
Pages Per Session measures the average number of pages viewed across all sessions, while Unique Page Views counts the number of times a specific page was viewed within a single session, excluding repeated views of the same page. Pages Per Session is a session-based metric that provides overall engagement insights, whereas Unique Page Views are user-based and help identify which pages retain visitor interest. Both metrics are valuable for understanding user behavior, but they serve different analytical purposes in your digital strategy.
Pages Per Session signals to search engines that your website provides valuable, engaging content that keeps users exploring. Higher engagement metrics like Pages Per Session correlate with better user experience signals, which search engines like Google consider in ranking algorithms. When users view multiple pages during a session, it indicates content relevance and quality, potentially contributing to improved search visibility. Additionally, increased page views create more opportunities for internal linking and keyword optimization, further supporting SEO performance.
Multiple factors influence Pages Per Session, including content quality and relevance, website navigation structure and intuitiveness, page load speed (each second of delay decreases pages viewed by approximately 11%), internal linking strategy and call-to-action placement, mobile optimization and responsive design, user intent and search relevance, and product catalog size for eCommerce sites. Additionally, traffic source quality matters significantly—organic search traffic typically shows higher Pages Per Session (5.8) compared to paid search (2.9), indicating different user intent levels across channels.
Optimize your website by improving site navigation with clear menus and breadcrumb trails, enhancing content quality and relevance to user intent, implementing strategic internal linking to related content, adding compelling calls-to-action throughout pages, optimizing page load speed, ensuring mobile responsiveness, and using product recommendations or related content suggestions. Additionally, analyze your traffic sources and focus on channels delivering higher-engagement visitors, create content that naturally guides users through your funnel, and regularly test design changes to measure their impact on engagement metrics.
Pages Per Session has a strong positive correlation with conversion rates. Research shows that sessions with 5+ pages viewed have conversion rates up to 3 times higher than single-page sessions in many eCommerce verticals. Users who browse multiple pages demonstrate stronger purchase intent and engagement with your offerings, making them more likely to convert. However, this relationship isn't always linear—sometimes high Pages Per Session combined with high bounce rates may indicate navigation confusion rather than genuine engagement, so it's important to analyze this metric alongside bounce rate and session duration.
Pages Per Session varies significantly by traffic source. Organic search traffic averages 5.8 pages per session, direct traffic averages 4.3 pages, referral traffic averages 4.0 pages, email marketing averages 3.6 pages, social media averages 3.2 pages, and paid search averages 2.9 pages per session. These differences reflect varying user intent levels—organic search users typically have higher intent and engagement, while paid search users may be more transaction-focused. Understanding these channel-specific patterns helps optimize your marketing strategy and content approach for each traffic source.
Start tracking how AI chatbots mention your brand across ChatGPT, Perplexity, and other platforms. Get actionable insights to improve your AI presence.
Session duration measures the total time users spend on a website per visit. Learn how to calculate it, why it matters for engagement, and how to improve it wit...
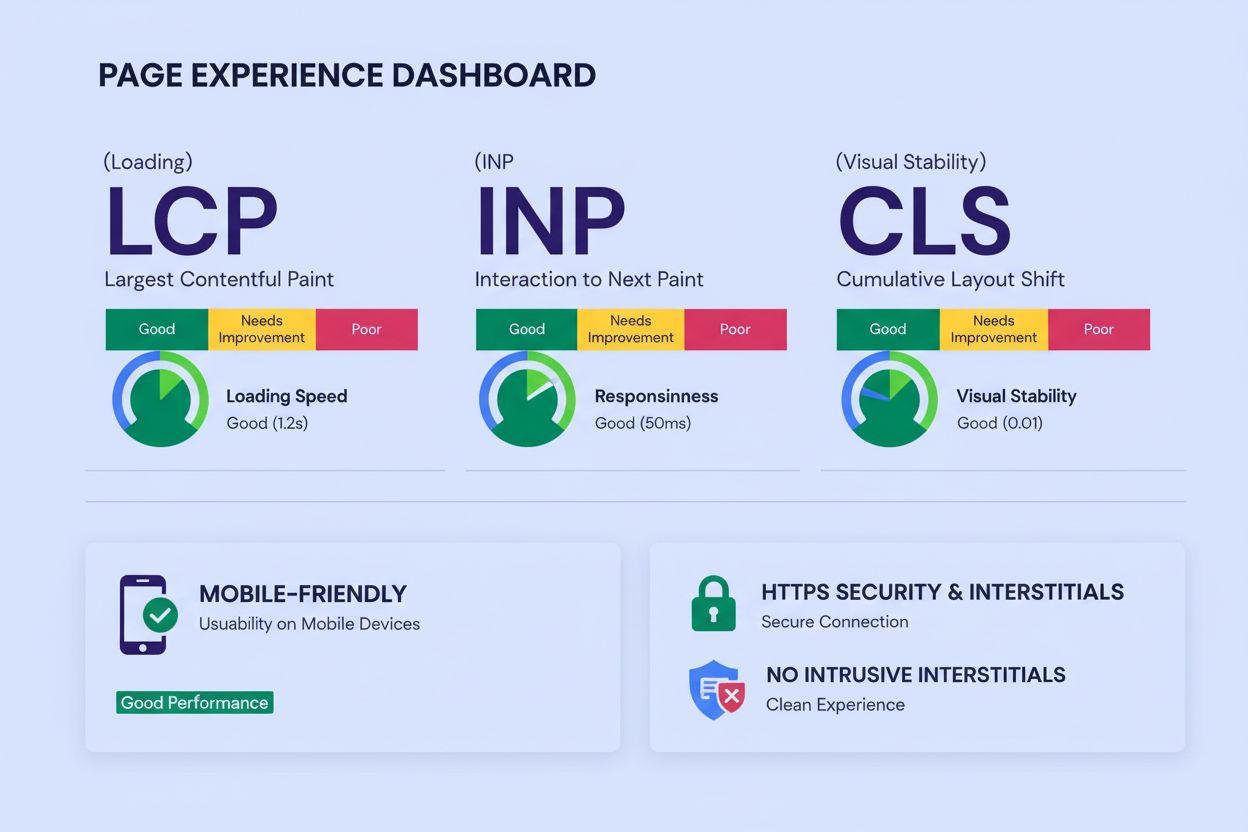
Page Experience measures user interaction quality through Core Web Vitals, mobile-friendliness, HTTPS security, and intrusive interstitials. Learn how it impact...

Page speed measures how quickly a webpage loads. Learn about Core Web Vitals metrics, why page speed matters for SEO and conversions, and how to optimize loadin...
Cookie Consent
We use cookies to enhance your browsing experience and analyze our traffic. See our privacy policy.