AI Index Coverage
Learn what AI Index Coverage is and why it matters for your brand's visibility in ChatGPT, Google AI Overviews, and Perplexity. Discover technical factors, best...
8 min read
The percentage of relevant industry queries where a brand appears in AI-generated responses across platforms like ChatGPT, Perplexity, Google AI Overviews, and Claude. This metric measures how comprehensively your brand is represented when AI systems answer questions within your industry vertical, capturing the breadth of visibility across the entire AI response ecosystem rather than focusing on individual keyword rankings.
The percentage of relevant industry queries where a brand appears in AI-generated responses across platforms like ChatGPT, Perplexity, Google AI Overviews, and Claude. This metric measures how comprehensively your brand is represented when AI systems answer questions within your industry vertical, capturing the breadth of visibility across the entire AI response ecosystem rather than focusing on individual keyword rankings.
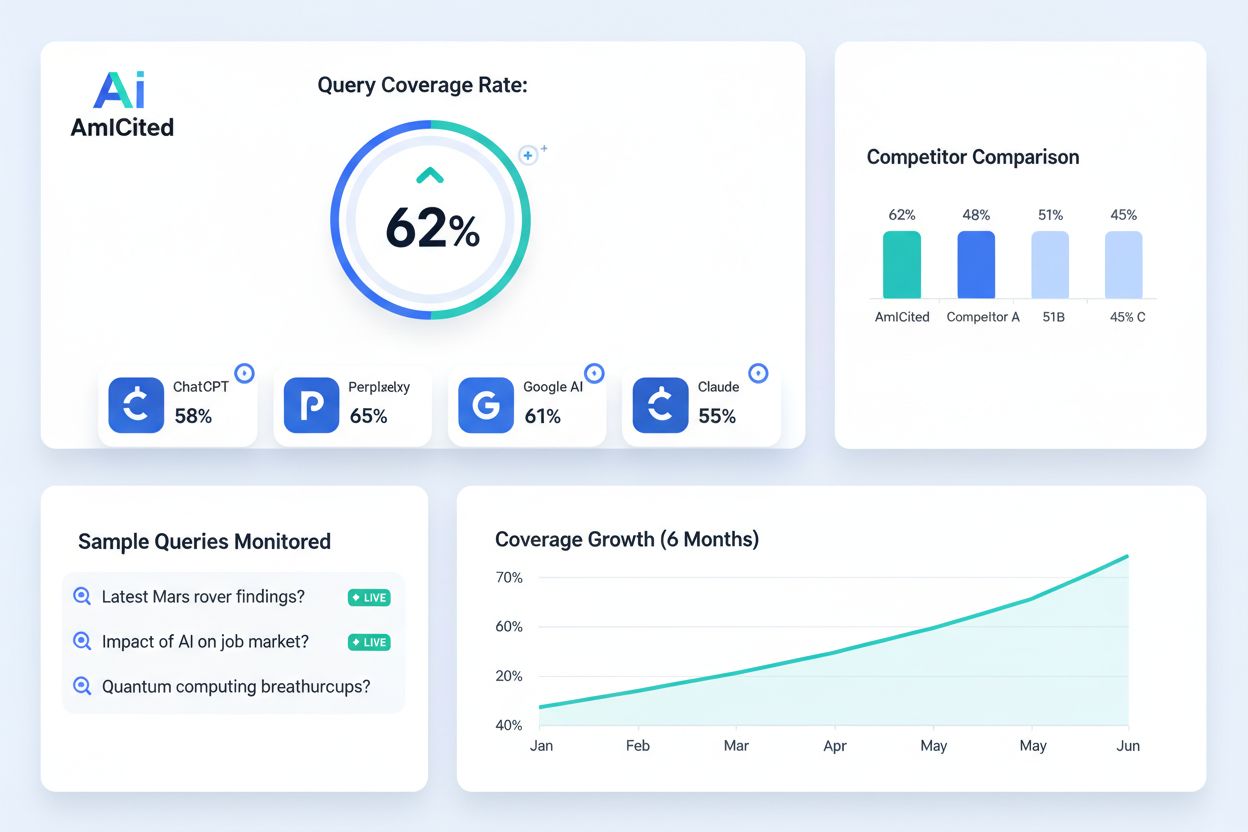
Query Coverage Rate is the percentage of relevant industry queries where a brand appears in AI-generated responses across major platforms including ChatGPT, Perplexity, Google AI Overviews, and Claude. This metric measures how comprehensively your brand is represented when AI systems answer questions within your industry vertical. Unlike traditional search engine rankings that focus on position and click-through rates, Query Coverage Rate captures the breadth of your visibility across the entire AI response ecosystem. It answers a fundamental question: “Of all the questions AI systems answer in my industry, how many include my brand?” This distinction is critical because AI responses operate differently than traditional search—they synthesize information from multiple sources into single answers, meaning your brand’s presence depends on being cited as a relevant authority rather than ranking for individual keywords. A brand with 45% Query Coverage Rate appears in nearly half of all relevant industry queries answered by AI systems, providing consistent visibility regardless of how the question is phrased. This metric has become essential for B2B companies, SaaS platforms, and industry leaders because AI-generated answers increasingly influence purchasing decisions and brand perception. Coverage Rate directly impacts brand awareness, lead generation, and thought leadership positioning in an era where AI systems are becoming primary information sources for professionals.
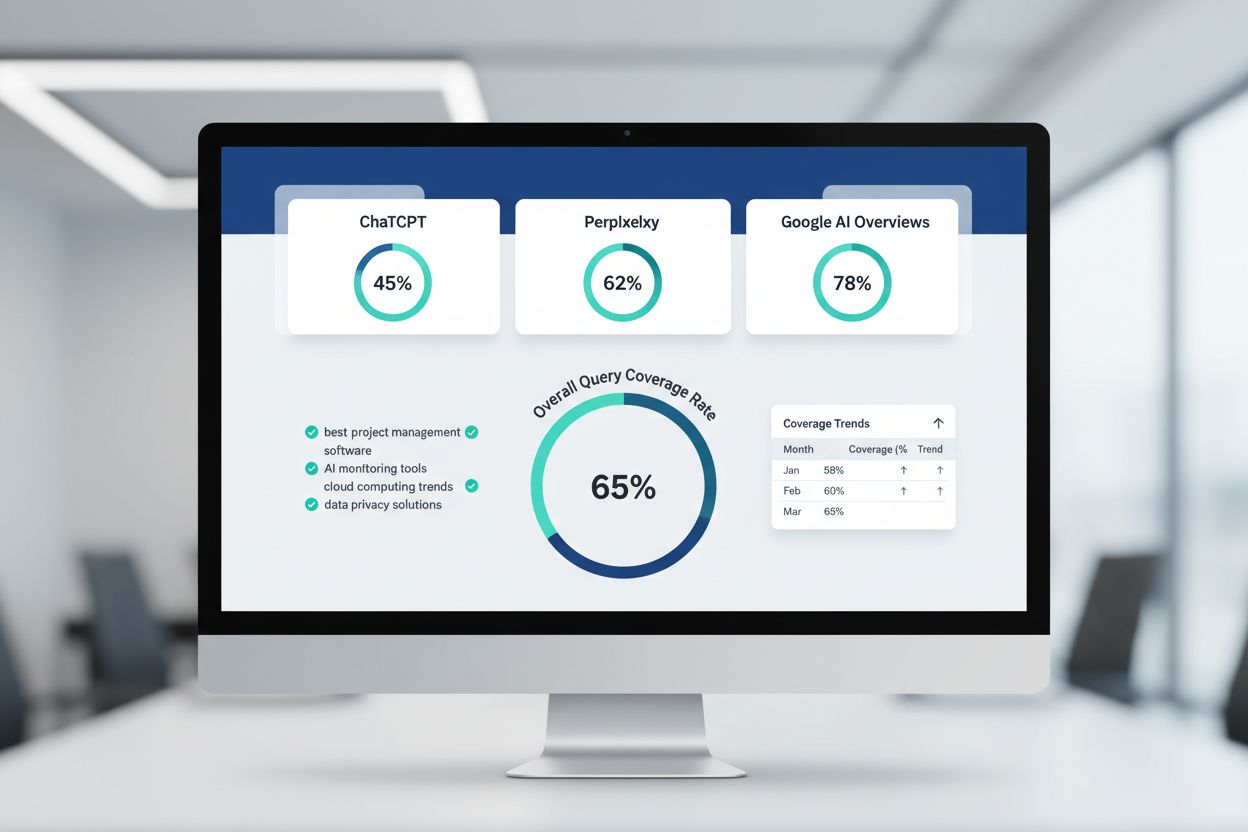
Query Coverage Rate operates by tracking a brand’s appearance across AI platforms in response to a defined set of relevant industry queries. The calculation involves three core steps: first, identifying a comprehensive list of industry-relevant queries (typically 100-500+ queries depending on industry scope); second, running those queries across each major AI platform and documenting whether your brand appears in the response; third, calculating the percentage of queries where your brand received at least one mention or citation. The mechanics vary slightly across platforms—Perplexity maintains a 99.95% query response rate with consistent citation patterns, while Google AI Overviews appears in approximately 18% of global searches with a 58.15% response rate on industry-specific queries. ChatGPT prioritizes Wikipedia sources (48% of citations) and established authorities, while Claude emphasizes accuracy and source diversity. Benchmarking data shows that enterprise brands typically achieve 30-60% coverage rates in their primary industry verticals, with market leaders reaching 70%+ coverage. Mid-market companies often see 15-35% coverage, while emerging brands struggle to break 10% without deliberate optimization. The variation depends on factors including domain authority, content distribution, citation patterns on source platforms, and how frequently your brand is mentioned in training data and indexed sources.
| Platform | Response Rate | Citation Diversity | Coverage Variance |
|---|---|---|---|
| Perplexity | 99.95% | High (Reddit 6.6%, YouTube 2%) | 5-15% |
| Google AI Overviews | 58.15% | Medium (Wikipedia 48%) | 8-20% |
| ChatGPT | ~95% | Medium-High (Wikipedia dominant) | 10-25% |
| Claude | ~92% | High (Diverse sources) | 12-28% |
Measuring Query Coverage Rate requires systematic tracking across multiple platforms using both automated tools and manual verification. Tools and Methods include dedicated AI visibility platforms like Profound, Peec AI, Hall, and AmICited.com, which automate query testing and coverage tracking. These platforms maintain databases of 500-5,000+ industry-relevant queries and continuously monitor AI responses for brand mentions and citations. Manual approaches involve selecting 50-200 representative queries, running them through each AI platform, and documenting results in a spreadsheet. Practical measurement approaches:
Most organizations establish a baseline measurement, then track monthly or quarterly to monitor progress and identify emerging opportunities.
Query Coverage Rate operates distinctly from related AI visibility metrics, each measuring different aspects of brand presence. Mention Rate counts total mentions across all queries (a brand might be mentioned 3 times in a single response), while Coverage Rate measures query breadth (whether you appear at all in a query). A brand could have high mention rate but low coverage rate if it dominates a few queries while missing most others. Citation Share measures the percentage of citations attributed to your brand versus competitors within responses—a brand might appear in 40% of queries but receive only 15% of total citations if competitors dominate. Representation Accuracy evaluates whether AI systems describe your brand correctly, while Coverage Rate simply tracks presence. Authority Score measures how frequently AI systems cite your brand as a primary source versus secondary mention, whereas coverage is binary presence/absence. Response Rate (platform-specific) indicates how often an AI system answers a query at all, independent of your brand’s inclusion. The unique value of Query Coverage Rate lies in its comprehensiveness—it reveals whether your brand is systematically missing from industry conversations at scale. A brand with 35% coverage rate knows it’s absent from 65% of relevant queries, providing clear optimization targets. This metric directly correlates with market visibility and brand awareness in ways that mention rate or citation share cannot capture alone.
Increasing Query Coverage Rate requires strategic content and optimization efforts focused on becoming a cited authority across your industry. Seven actionable strategies:
Develop authoritative content addressing common industry questions: Create comprehensive guides, research reports, and thought leadership pieces that directly answer the 100+ queries in your coverage analysis. AI systems prioritize well-researched, authoritative content from established sources.
Optimize for AI-friendly content formats: Structure content with clear headers, bullet points, and concise paragraphs that AI systems can easily extract and cite. Include data, statistics, and original research that AI systems value as authoritative sources.
Build citations on high-authority platforms: Secure mentions on platforms AI systems heavily cite—Reddit (6.6% of Perplexity citations), YouTube (2%), Gartner (1%), industry publications, and Wikipedia where appropriate. Each citation increases probability of AI inclusion.
Implement strategic internal linking: Link related content pieces to establish topical authority and help AI systems understand your expertise breadth. This signals comprehensive coverage of industry topics.
Publish original research and data: AI systems prioritize original research, surveys, and proprietary data. Publishing annual reports, industry benchmarks, or original studies significantly increases citation likelihood.
Optimize for featured snippets and knowledge panels: These Google features feed into AI training data and influence how AI systems perceive your authority. Target snippet-worthy content formats.
Monitor and respond to coverage gaps: Use AmICited.com or similar tools to identify which queries exclude your brand, then create targeted content addressing those specific gaps. Prioritize high-volume, high-intent queries where you’re currently absent.
Consistent execution of these strategies typically increases coverage rate by 10-25% over 6-12 months, depending on starting position and competitive intensity.
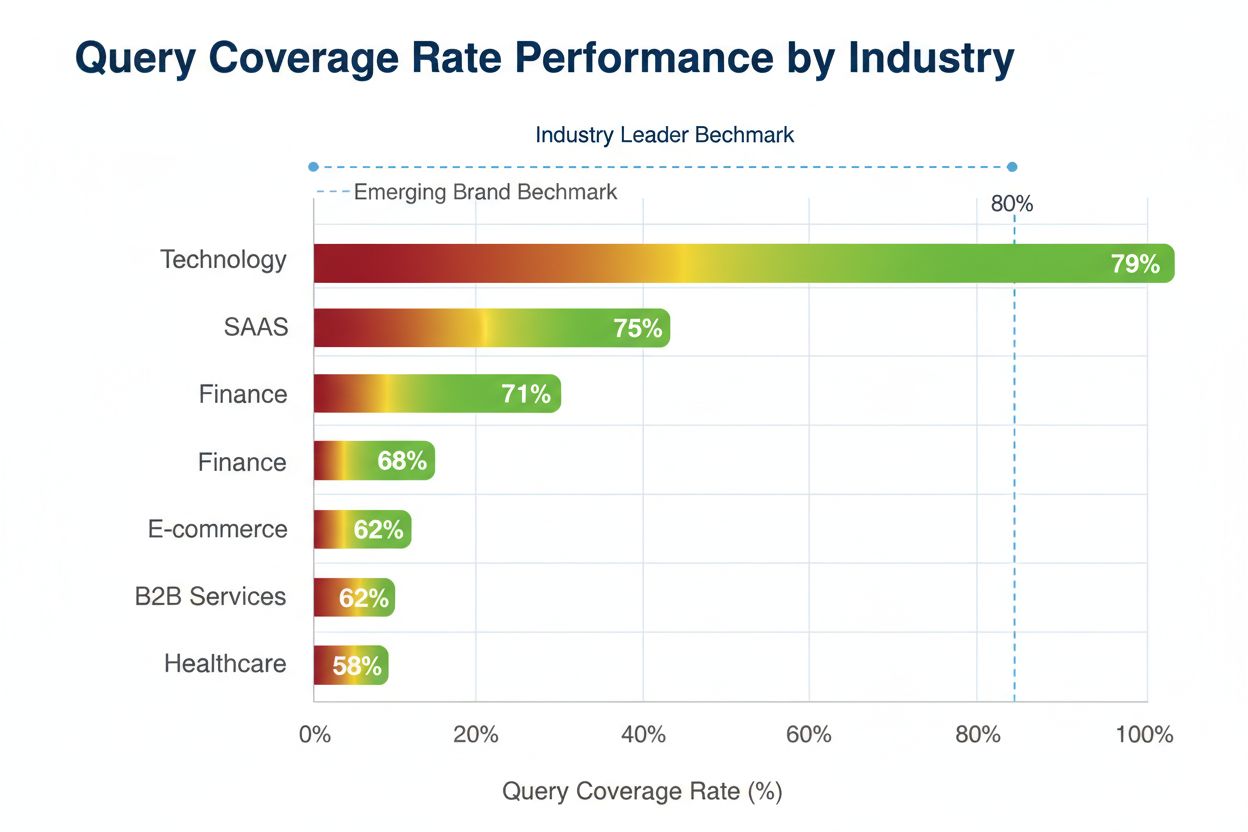
Understanding where your Query Coverage Rate stands relative to industry standards helps establish realistic goals and identify competitive positioning. Enterprise-level brands (Fortune 500, market leaders) typically achieve 65-85% coverage rates in their primary verticals, with some reaching 90%+ in narrow specializations. These organizations benefit from established authority, extensive content libraries, and consistent media coverage that feeds AI training data. Mid-market companies (Series B-D startups, established regional players) typically range 25-50% coverage, with high performers reaching 60%. This segment has sufficient resources for content creation but faces competition from larger, more established brands. Emerging brands and startups typically see 5-20% coverage, with rapid growth possible through focused optimization. Industry-specific variations significantly impact benchmarks—B2B SaaS companies average 35-45% coverage, professional services firms average 40-55%, technology companies average 50-65%, and consumer brands average 30-45%. These variations reflect differences in how AI systems weight authority, citation patterns on source platforms, and content distribution strategies. Competitive analysis shows that market leaders typically maintain 15-30% higher coverage rates than second-tier competitors. A brand at 40% coverage in a market where leaders average 65% has clear optimization opportunity. Quarterly benchmarking against top 3-5 competitors provides context for goal-setting and strategy adjustment. Most organizations should target 10-15% annual coverage rate growth, with realistic expectations that growth accelerates as authority builds.
Brands frequently make preventable mistakes that limit Query Coverage Rate growth, often without realizing the impact. Common pitfalls include:
Ignoring query diversity: Focusing content on branded keywords and obvious industry terms while missing long-tail, problem-solution, and comparison queries where AI systems frequently cite sources. This creates coverage gaps in high-intent queries.
Creating content for humans, not AI systems: Writing marketing-focused content optimized for conversion rather than information delivery. AI systems prioritize comprehensive, objective, well-structured content over sales-oriented messaging.
Neglecting source platform optimization: Failing to secure mentions on platforms AI systems heavily cite (Reddit, YouTube, industry publications, Gartner). Your website alone cannot achieve high coverage without external citations.
Inconsistent publishing cadence: Publishing sporadically rather than maintaining regular content updates. AI systems favor brands demonstrating consistent expertise and current information.
Poor content structure: Using dense paragraphs, minimal headers, and unclear organization that makes extraction difficult for AI systems. Structured, scannable content receives higher citation rates.
Overlooking competitor analysis: Not understanding which queries competitors dominate or which gaps exist in the market. This leads to wasted effort on already-saturated queries.
Failing to measure and iterate: Setting coverage goals without tracking progress or adjusting strategy based on results. Without measurement, optimization efforts lack direction.
Ignoring platform-specific citation patterns: Treating all AI platforms identically when they have distinct citation preferences. ChatGPT emphasizes Wikipedia and established sources; Perplexity values diverse sources including Reddit; Google AI Overviews prioritize authoritative domains.
Using AmICited.com or similar monitoring tools prevents these mistakes by providing visibility into coverage gaps, competitor positioning, and platform-specific performance, enabling data-driven optimization.
Query Coverage Rate will evolve significantly as AI systems become more sophisticated and integral to information discovery. Emerging trends include increased platform fragmentation—as specialized AI systems emerge for vertical industries (legal AI, medical AI, financial AI), brands will need to optimize for platform-specific citation patterns rather than generic coverage. Personalization will likely increase, with AI systems tailoring responses based on user context, company size, and industry, making aggregate coverage rate less meaningful without segmentation. Real-time citation dynamics will become more important as AI systems increasingly pull from live data sources rather than static training data, requiring brands to maintain current, updated content continuously. Attribution transparency is improving, with AI systems increasingly showing source citations explicitly, making coverage rate more directly tied to user trust and click-through behavior. Regulatory pressure on AI systems to cite sources accurately and comprehensively will likely increase coverage opportunities for authoritative brands while reducing visibility for low-quality sources. Integration with traditional search will deepen, with AI Overviews becoming standard across search engines, making Query Coverage Rate increasingly central to overall search visibility strategy. Forward-looking brands should view Query Coverage Rate not as a standalone metric but as a leading indicator of overall market visibility and authority. Organizations investing in comprehensive, authoritative content and strategic citation building now will establish competitive advantages as AI systems become the primary information discovery mechanism for professionals and consumers.
A good Query Coverage Rate depends on your industry and competitive position. Enterprise brands typically achieve 65-85% coverage in their primary verticals, mid-market companies range 25-50%, and emerging brands typically see 5-20%. Most organizations should target 10-15% annual growth, with realistic expectations that growth accelerates as authority builds.
Query Coverage Rate measures the percentage of queries where your brand appears at all, while Share of Voice measures the proportion of total mentions or citations your brand receives compared to competitors. You could have high coverage (appearing in many queries) but low share of voice (competitors dominate those mentions).
Prioritize based on your audience: Google AI Overviews for broad reach, ChatGPT for general professional audiences, Perplexity for research-focused users, and Claude for technical audiences. Most organizations should optimize for all major platforms simultaneously since universal best practices (content structure, schema markup, E-E-A-T signals) improve visibility across all platforms.
Establish baseline measurements, then track monthly or quarterly depending on resources. Most organizations benefit from monthly tracking to monitor progress and identify emerging opportunities. Automated tools enable continuous monitoring with weekly or daily updates, providing faster feedback for optimization efforts.
Yes, emerging brands can achieve meaningful coverage through focused optimization. While established brands have advantages, new brands can compete by creating exceptional content, securing citations on high-authority platforms, and building topical authority in specific niches. Realistic expectations are 5-20% initial coverage with potential for 10-15% annual growth.
AI-driven traffic converts 4.4 times better than average organic traffic, making Query Coverage Rate directly tied to business impact. Higher coverage rates increase brand awareness and consideration, leading to more qualified leads. However, coverage must be paired with accurate brand representation and quality content to drive actual conversions.
Content freshness significantly impacts coverage, especially on Perplexity which shows visibility decay after 2-3 days without updates. Regular content updates (weekly for priority pages, bi-weekly for secondary content) maintain and improve coverage rates. Stale content gradually loses visibility as AI systems prioritize current information.
Domain authority significantly influences coverage, accounting for approximately 15% of ranking factors. High-authority domains receive preferential treatment from AI systems. However, page-specific authority and content quality create opportunities for newer sites with exceptional content to achieve meaningful coverage despite lower overall domain authority.
Track how often your brand appears in AI-generated responses with AmICited's comprehensive monitoring platform. Get real-time insights into your coverage rates across ChatGPT, Perplexity, Google AI Overviews, and more.
Learn what AI Index Coverage is and why it matters for your brand's visibility in ChatGPT, Google AI Overviews, and Perplexity. Discover technical factors, best...
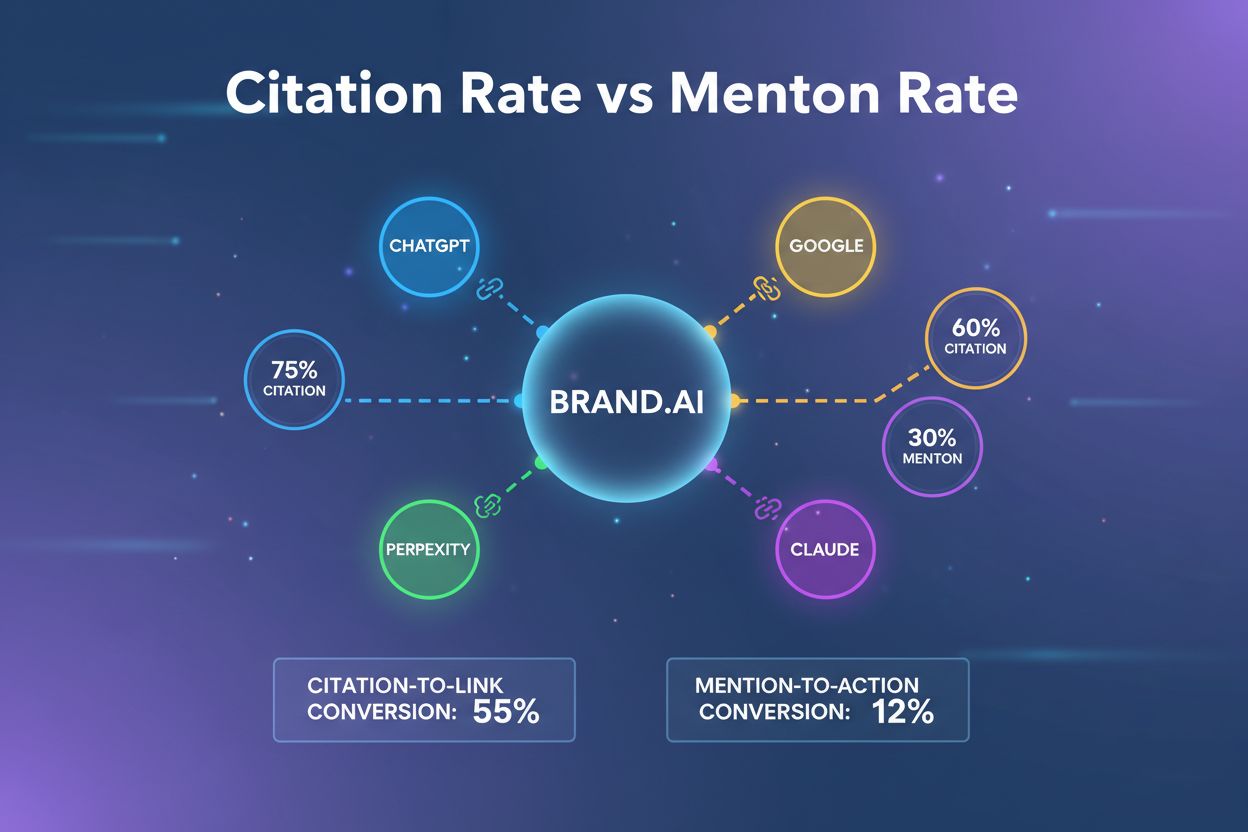
Understand the critical difference between citation rate and mention rate in AI monitoring. Learn which metric drives more value, how to measure both, and strat...
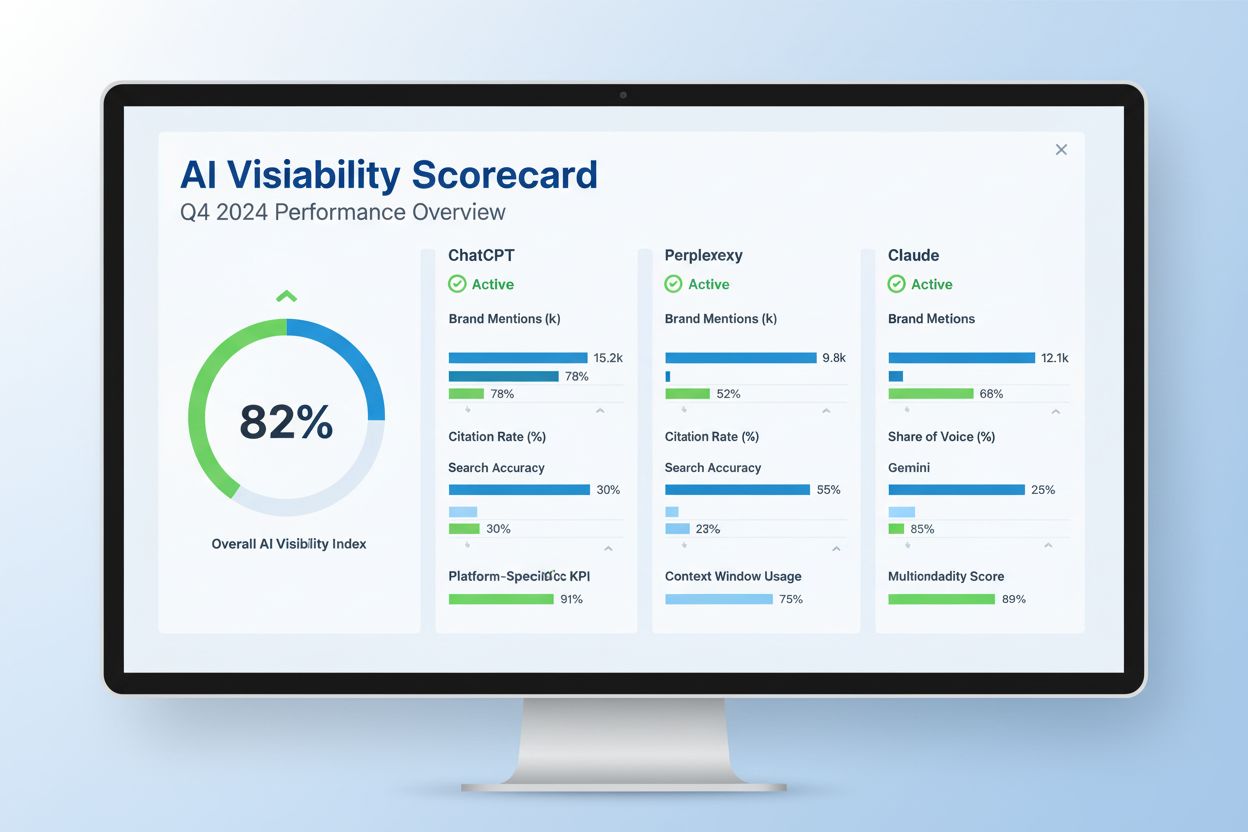
Learn what an AI Visibility Score is and how it measures your brand's presence across ChatGPT, Perplexity, Claude, and other AI platforms. Essential metric for ...
Cookie Consent
We use cookies to enhance your browsing experience and analyze our traffic. See our privacy policy.