AI ROI - Return on AI Optimization Investment
AI ROI measures the financial and operational returns from AI investments. Learn how to calculate hard and soft ROI, key metrics, and strategies to maximize AI ...
18 min read
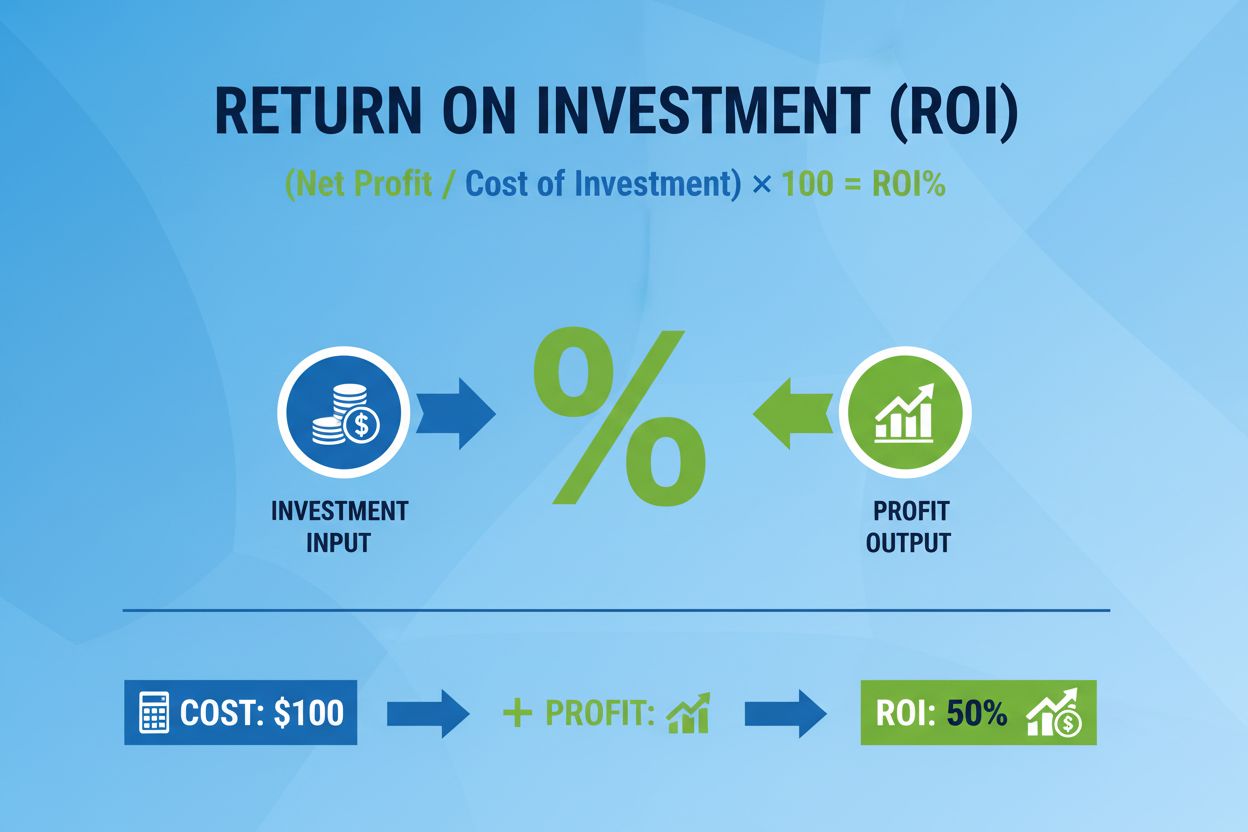
Return on Investment (ROI) is a financial metric that measures the profitability of an investment by comparing the net profit earned to the cost of the investment, expressed as a percentage. It answers the fundamental question: ‘For every dollar invested, how much profit is generated?’ ROI is calculated using the formula: (Net Profit ÷ Cost of Investment) × 100.
Return on Investment (ROI) is a financial metric that measures the profitability of an investment by comparing the net profit earned to the cost of the investment, expressed as a percentage. It answers the fundamental question: 'For every dollar invested, how much profit is generated?' ROI is calculated using the formula: (Net Profit ÷ Cost of Investment) × 100.
Return on Investment (ROI) is a fundamental financial metric that measures the profitability and efficiency of an investment by comparing the net profit generated to the initial cost of that investment. Expressed as a percentage, ROI answers one of the most critical questions in finance and business: “How much profit am I making for every dollar I invest?” The metric is universally applied across industries—from stock market investments and real estate to marketing campaigns and technology implementations. ROI provides investors, business leaders, and financial analysts with a straightforward way to evaluate whether capital has been deployed effectively and whether alternative investment opportunities might offer better returns. The simplicity and universal applicability of ROI make it one of the most widely used profitability metrics in the world, though this simplicity also comes with important limitations that sophisticated investors must understand.
The ROI formula is elegantly simple, requiring only two key inputs: the net profit earned from an investment and the total cost of that investment. The standard formula is expressed as: ROI = (Net Profit ÷ Cost of Investment) × 100. To calculate net profit, subtract all costs associated with the investment from the total returns or proceeds received. For example, if an investor purchases a stock for $1,000 and sells it for $1,250, the net profit is $250. Dividing $250 by the $1,000 investment cost yields 0.25, which when multiplied by 100 equals a 25% ROI. This calculation can be applied to virtually any investment scenario—whether evaluating a single stock purchase, a real estate transaction, a marketing campaign, or a corporate technology initiative. The percentage format makes ROI immediately comparable across different investment types and sizes, allowing investors to rank opportunities on a standardized scale. However, the calculation’s simplicity masks important nuances: the formula does not account for the time period over which returns are generated, does not adjust for inflation or the time value of money, and can be manipulated if certain costs are excluded from the calculation.
The concept of measuring investment returns dates back centuries, with early merchants and traders using rudimentary cost-benefit analyses to evaluate trading ventures. However, the formalized ROI metric as we know it today emerged during the early 20th century as corporations sought standardized methods to evaluate capital allocation decisions. The DuPont Corporation pioneered systematic ROI analysis in the 1920s, developing frameworks to decompose ROI into component ratios for deeper financial analysis. Throughout the latter half of the 20th century, ROI became the dominant metric for evaluating corporate investments, capital projects, and strategic initiatives. The metric’s popularity grew because it required minimal data inputs and could be easily understood by non-financial stakeholders. In recent decades, particularly with the rise of digital marketing and technology investments, ROI has been adapted to measure returns on advertising spend (ROAS), marketing campaigns, and software implementations. According to recent research, approximately 78% of enterprises now use some form of ROI-driven metrics to evaluate technology investments, though many struggle with accurate measurement. The evolution of ROI measurement continues today, with organizations increasingly supplementing traditional ROI with more sophisticated metrics like Internal Rate of Return (IRR) and Net Present Value (NPV) to address the metric’s inherent limitations.
| Metric | Definition | Time Consideration | Best Use Case | Key Limitation |
|---|---|---|---|---|
| ROI | Net profit divided by investment cost, expressed as percentage | No; ignores timing | Quick profitability assessment, comparing investments | Doesn’t account for holding period or time value of money |
| Annualized ROI | ROI adjusted to reflect average annual return over holding period | Yes; accounts for years held | Comparing investments with different time horizons | Assumes consistent annual returns |
| Internal Rate of Return (IRR) | Discount rate that makes NPV equal to zero; expressed as percentage | Yes; considers cash flow timing | Complex projects with varying cash flows; private equity | Can be manipulated; multiple IRRs possible |
| Net Present Value (NPV) | Present value of all future cash flows minus initial investment | Yes; discounts future cash flows | Long-term projects with defined endpoints | Requires assumption of discount rate; less intuitive |
| Return on Assets (ROA) | Net income divided by total assets; measures asset efficiency | Annual basis | Evaluating how efficiently company uses assets | Doesn’t reflect capital structure or leverage |
| Return on Equity (ROE) | Net income divided by shareholder equity; measures shareholder returns | Annual basis | Evaluating returns to shareholders | Can be inflated by leverage; doesn’t account for risk |
| Payback Period | Time required to recover initial investment | Yes; measures recovery timeline | Risk assessment; projects with uncertain long-term returns | Ignores returns after payback; doesn’t measure profitability |
The mechanics of ROI calculation vary depending on the investment type, but the fundamental principle remains consistent: comparing profit to cost. In equity investments, an investor purchases shares at an entry price, holds them for a period, and sells at an exit price. The net profit is the difference between exit proceeds and entry cost, divided by the entry cost. For example, purchasing 1,000 shares at $50 per share ($50,000 investment) and selling at $60 per share ($60,000 proceeds) generates a $10,000 profit and 20% ROI. In real estate investments, ROI includes not only appreciation but also rental income, tax benefits, and all associated costs (mortgage interest, property taxes, maintenance, insurance). A property purchased for $300,000 that generates $30,000 in annual net rental income has a 10% annual ROI from cash flow alone, separate from any appreciation. In marketing and advertising, ROI measures revenue generated from campaigns relative to spending. A marketing campaign costing $10,000 that generates $50,000 in attributed sales revenue produces a 400% ROI. In technology and software implementations, ROI compares cost savings, productivity gains, and revenue increases against implementation and ongoing costs. The calculation requires identifying all relevant costs (purchase price, installation, training, maintenance) and all relevant benefits (labor savings, increased output, reduced errors). The challenge in technology ROI is quantifying intangible benefits and attributing outcomes to specific initiatives when multiple factors influence results.
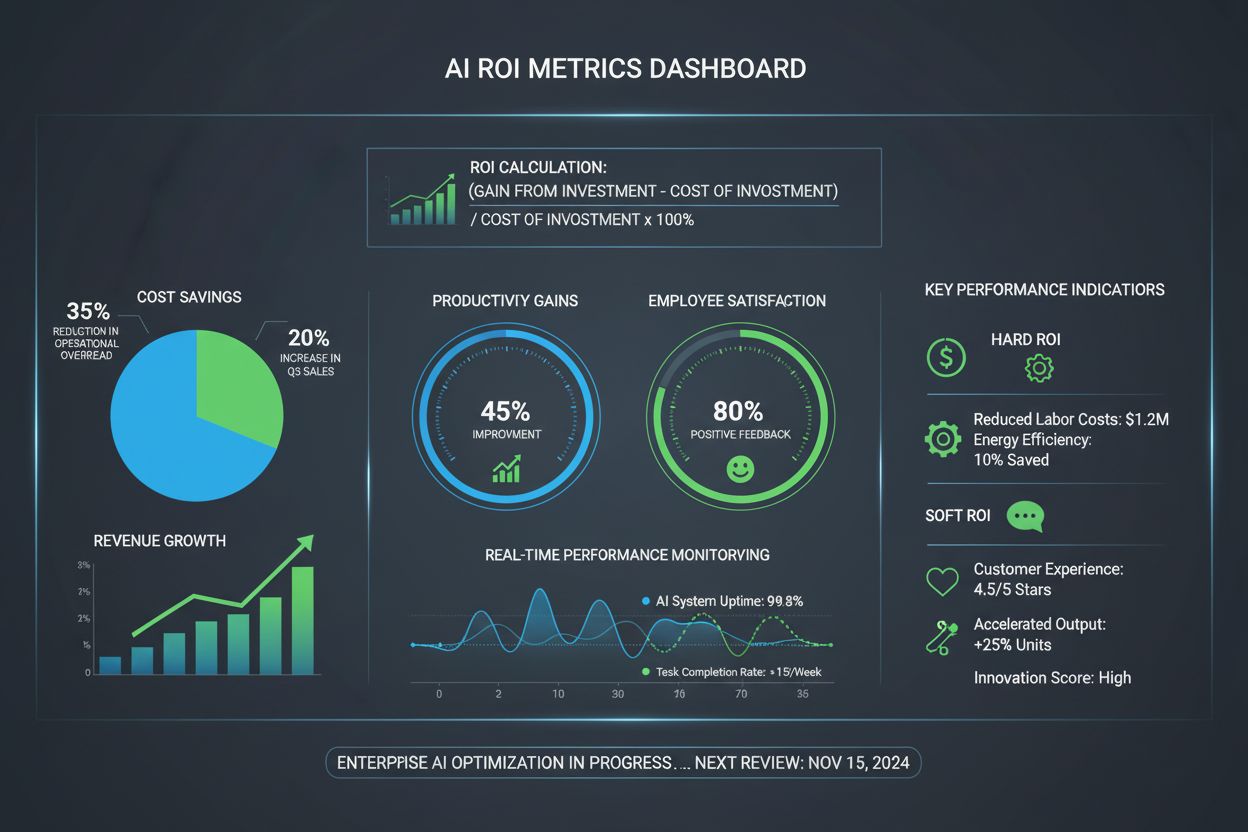
Understanding and measuring ROI is critical for organizational decision-making at multiple levels. At the strategic level, ROI guides capital allocation decisions—executives use ROI projections to decide which projects to fund and which to reject. According to Deloitte’s 2024 research on technology investments, organizations that systematically measure ROI achieve 23% higher returns on their technology spending compared to those without formal ROI frameworks. At the operational level, ROI tracking helps managers optimize resource allocation within approved projects and identify underperforming initiatives requiring intervention. For investors, ROI enables portfolio comparison and rebalancing decisions. However, the business impact of ROI extends beyond financial metrics. Organizations that emphasize ROI measurement develop stronger financial discipline, more rigorous project planning, and better accountability for capital deployment. Conversely, poor ROI measurement leads to capital waste, failed projects, and strategic misalignment. Recent data reveals that 95% of enterprise AI projects fail to deliver measurable ROI, highlighting the critical importance of accurate measurement frameworks. This statistic underscores why organizations increasingly invest in monitoring platforms and analytics tools to track ROI systematically. For companies implementing AI monitoring solutions like brand tracking platforms, measuring ROI becomes essential for justifying ongoing investment and demonstrating value to stakeholders.
Despite its widespread use, ROI has significant limitations that investors and analysts must understand. The most fundamental limitation is that ROI ignores the time value of money—a 50% return over five years appears identical to 50% over one year in basic ROI calculations, yet the latter is substantially more valuable. This limitation led to the development of annualized ROI, which divides total ROI by the number of years to show average annual returns. A second major limitation is that ROI provides no information about risk or volatility. Two investments might have identical 20% ROI, but one could be a stable dividend-paying stock while the other is a speculative startup—the risk profiles are completely different, yet ROI treats them equally. Third, ROI is susceptible to manipulation through selective cost accounting. A marketing manager might calculate ROI by including only direct campaign costs while excluding overhead, training, and management time, artificially inflating the result. Fourth, ROI assumes reinvestment at the same rate, which may not reflect reality. If an investment generates 15% annual returns but available reinvestment opportunities only offer 8%, the actual long-term return will be lower than ROI calculations suggest. Fifth, ROI ignores opportunity costs—the returns foregone by choosing one investment over another. Finally, ROI struggles with intangible benefits like brand reputation, employee morale, or customer satisfaction, which are difficult to quantify in monetary terms but may represent significant value.
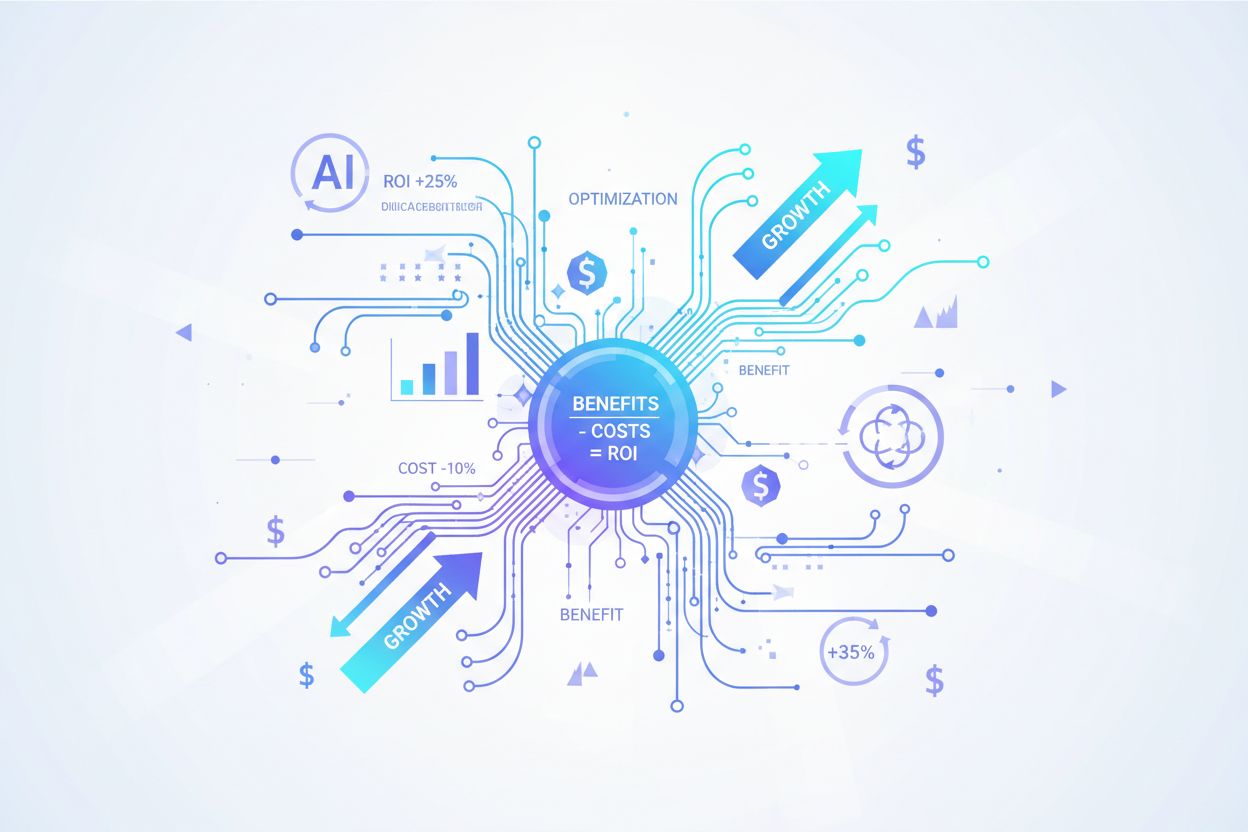
In the emerging field of AI monitoring and brand tracking, ROI measurement takes on new dimensions and challenges. Organizations increasingly use platforms like AmICited to track how their brands, domains, and URLs appear in AI-generated responses across systems like ChatGPT, Perplexity, Google AI Overviews, and Claude. The ROI of such monitoring involves comparing the value of visibility and insights gained against the cost of the monitoring platform. Benefits might include early detection of brand mentions in AI responses, competitive intelligence about how competitors appear in AI systems, crisis prevention through early identification of negative mentions, and strategic insights for SEO and content optimization. According to Nielsen’s 2025 research on AI ROI, organizations using AI-powered monitoring solutions report average ROI improvements of 34% in their digital marketing effectiveness. However, measuring ROI in AI monitoring is complex because benefits are often indirect and long-term. A brand mention in an AI response might drive traffic weeks or months later, making attribution difficult. Additionally, some benefits—like brand authority and thought leadership positioning—are qualitative and difficult to monetize. Organizations implementing AI monitoring must develop frameworks that combine quantitative metrics (traffic, leads, conversions) with qualitative assessments (brand perception, competitive positioning) to accurately calculate ROI.
To address ROI’s limitation regarding time, financial analysts developed the annualized ROI formula: [(Ending Value ÷ Beginning Value) ^ (1 ÷ Number of Years)] – 1. This formula converts any ROI into an equivalent annual return rate, enabling meaningful comparison between investments held for different periods. For example, an investment that generates 50% total ROI over three years has an annualized ROI of approximately 14.5% per year. This adjustment is critical for investment comparison. Consider two scenarios: Investment A returns 30% over one year, while Investment B returns 50% over three years. The basic ROI comparison suggests Investment B is superior (50% vs. 30%), but annualized ROI reveals Investment A is actually better (30% annually vs. 14.5% annually). Annualized ROI is particularly important in real estate, where holding periods typically span years or decades, and in private equity, where investment horizons are often 5-10 years. The annualized approach also facilitates comparison with standard benchmarks like the S&P 500’s historical 10% average annual return. However, annualized ROI assumes consistent annual returns, which rarely occurs in practice. An investment might generate 80% returns in year one and -10% in year two, averaging 35% annualized, but the actual experience is volatile. Despite this limitation, annualized ROI remains the standard method for time-adjusted return comparison across the investment industry.
Calculating accurate ROI requires discipline and comprehensive cost accounting. First, include all relevant costs: not just the obvious purchase price but also fees, taxes, insurance, maintenance, training, and opportunity costs. Many organizations underestimate ROI by excluding indirect costs. Second, use consistent time periods when comparing investments—compare annual ROI to annual ROI, not annual to multi-year. Third, account for cash flow timing by using annualized ROI for investments held different periods. Fourth, separate one-time costs from ongoing costs to understand both initial ROI and steady-state ROI. A software implementation might have high first-year costs but lower ongoing costs, creating different ROI profiles year-to-year. Fifth, document assumptions clearly, including expected holding periods, reinvestment rates, and benefit estimates. This documentation enables others to understand and validate your calculations. Sixth, use sensitivity analysis to test how ROI changes if key assumptions vary. If ROI is highly sensitive to one assumption, that assumption requires careful validation. Seventh, supplement ROI with other metrics like payback period, IRR, or NPV to gain a more complete picture. Finally, track actual results against projections to improve future ROI forecasting and identify systematic biases in your estimation process.
The definition and application of ROI continue to evolve as business environments become more complex and data-driven. One emerging trend is the development of Social Return on Investment (SROI), which quantifies social and environmental benefits alongside financial returns. SROI was initially developed in the late 1990s and has gained traction among organizations pursuing Environmental, Social, and Governance (ESG) objectives. Another trend is the integration of AI and machine learning into ROI calculation and forecasting. Advanced analytics platforms now automatically track ROI across portfolios, identify underperforming investments, and predict future returns based on historical patterns. In marketing, attribution modeling has become increasingly sophisticated, using multi-touch attribution to assign credit across multiple touchpoints rather than crediting only the final click. This evolution enables more accurate ROI calculation for complex customer journeys. In technology and AI monitoring, organizations are developing real-time ROI dashboards that track returns continuously rather than calculating ROI retrospectively. The rise of AI-driven decision-making also raises new questions about ROI measurement—how do you quantify the value of better decisions made with AI insights? As organizations become more data-mature, ROI measurement will likely become more granular, real-time, and integrated with broader performance management systems. Additionally, the increasing focus on sustainability and long-term value creation may shift emphasis from short-term ROI to longer-term value metrics that account for environmental and social externalities.
Return on Investment (ROI) remains one of the most important and widely-used financial metrics despite its limitations. Its simplicity, universal applicability, and intuitive interpretation make it invaluable for investment evaluation, capital allocation, and performance assessment. However, sophisticated users understand that ROI must be supplemented with additional metrics and context to provide a complete picture of investment performance. The metric’s evolution—from basic profitability calculation to annualized returns, SROI, and AI-enhanced measurement—reflects the increasing complexity of modern investment landscapes. For organizations implementing monitoring solutions, marketing campaigns, or technology initiatives, accurate ROI measurement is essential for justifying investments and optimizing resource allocation. As data analytics capabilities advance and business environments become more complex, ROI measurement will continue to evolve, incorporating real-time tracking, AI-driven forecasting, and broader value frameworks that extend beyond pure financial returns. Understanding ROI fundamentals—the formula, calculation methods, limitations, and best practices—provides the foundation for making informed investment decisions and evaluating whether capital deployment is generating appropriate returns.
ROI measures total profit relative to investment cost without considering time, while annualized ROI adjusts for the holding period to show average annual returns. Annualized ROI is calculated using the formula: [(Ending Value ÷ Beginning Value) ^ (1 ÷ Number of Years)] – 1. This distinction matters because a 50% ROI over 5 years is significantly different from 50% ROI over 1 year. Annualized ROI provides a more accurate comparison between investments with different time horizons.
A 'good' ROI depends on multiple factors including investment type, risk tolerance, holding period, and industry benchmarks. Historically, the S&P 500 has averaged approximately 10% annual returns, making this a common baseline for stock market investments. However, real estate investments, startups, and marketing campaigns may have different expectations. Short-term investments typically require higher ROI to justify the capital commitment, while long-term investments may accept lower returns due to compounding effects.
ROI has several critical limitations: it ignores the time value of money, making a 50% return over 5 years appear identical to 50% over 1 year; it doesn't account for risk or volatility; it can be manipulated by excluding certain costs; and it provides no information about cash flow timing. Additionally, ROI assumes reinvestment at the same rate and doesn't consider opportunity costs or alternative investments. For these reasons, sophisticated investors often supplement ROI with metrics like Internal Rate of Return (IRR) or Net Present Value (NPV).
In AI monitoring platforms like AmICited, ROI measures the value gained from tracking brand mentions across AI systems (ChatGPT, Perplexity, Google AI Overviews, Claude) relative to the monitoring platform's cost. Organizations calculate ROI by comparing benefits such as brand visibility insights, competitive intelligence, and crisis prevention against subscription fees. According to recent data, 95% of enterprise AI projects fail to deliver measurable ROI, making accurate tracking and measurement critical for justifying technology investments.
The basic ROI formula is: ROI = (Net Profit ÷ Cost of Investment) × 100. For example, if you invest $1,000 and earn $250 in profit, your ROI is ($250 ÷ $1,000) × 100 = 25%. Net Profit is calculated by subtracting all costs from total returns. The formula works for any investment type—stocks, real estate, marketing campaigns, or technology implementations. Always ensure you include all relevant costs (fees, maintenance, taxes) in your calculation to avoid inflated ROI figures.
Leverage amplifies ROI by allowing you to control a larger asset with less personal capital through borrowing. For example, purchasing a $200,000 property with $40,000 down (80% financing) and earning $20,000 profit yields 50% ROI on your $40,000 investment, versus 10% ROI if you paid cash. However, leverage also magnifies losses—if the property declines in value, losses are calculated against your smaller investment, creating negative ROI. Interest costs and fees further reduce net returns, making leverage a high-risk strategy requiring careful analysis.
Organizations face multiple ROI measurement challenges: lack of advanced tracking tools (cited by many firms as a primary obstacle), difficulty attributing benefits to specific initiatives, hidden or indirect costs, and inconsistent data collection methods. According to research, many companies lack the analytical infrastructure to calculate ROI based on robust data. Additionally, long implementation periods, changing market conditions, and difficulty quantifying intangible benefits (brand reputation, employee satisfaction) make accurate ROI assessment complex and time-consuming.
Start tracking how AI chatbots mention your brand across ChatGPT, Perplexity, and other platforms. Get actionable insights to improve your AI presence.
AI ROI measures the financial and operational returns from AI investments. Learn how to calculate hard and soft ROI, key metrics, and strategies to maximize AI ...
Learn how to calculate AI ROI effectively. Understand hard vs soft ROI, measurement frameworks, common mistakes, and real-world case studies showing 270%+ retur...
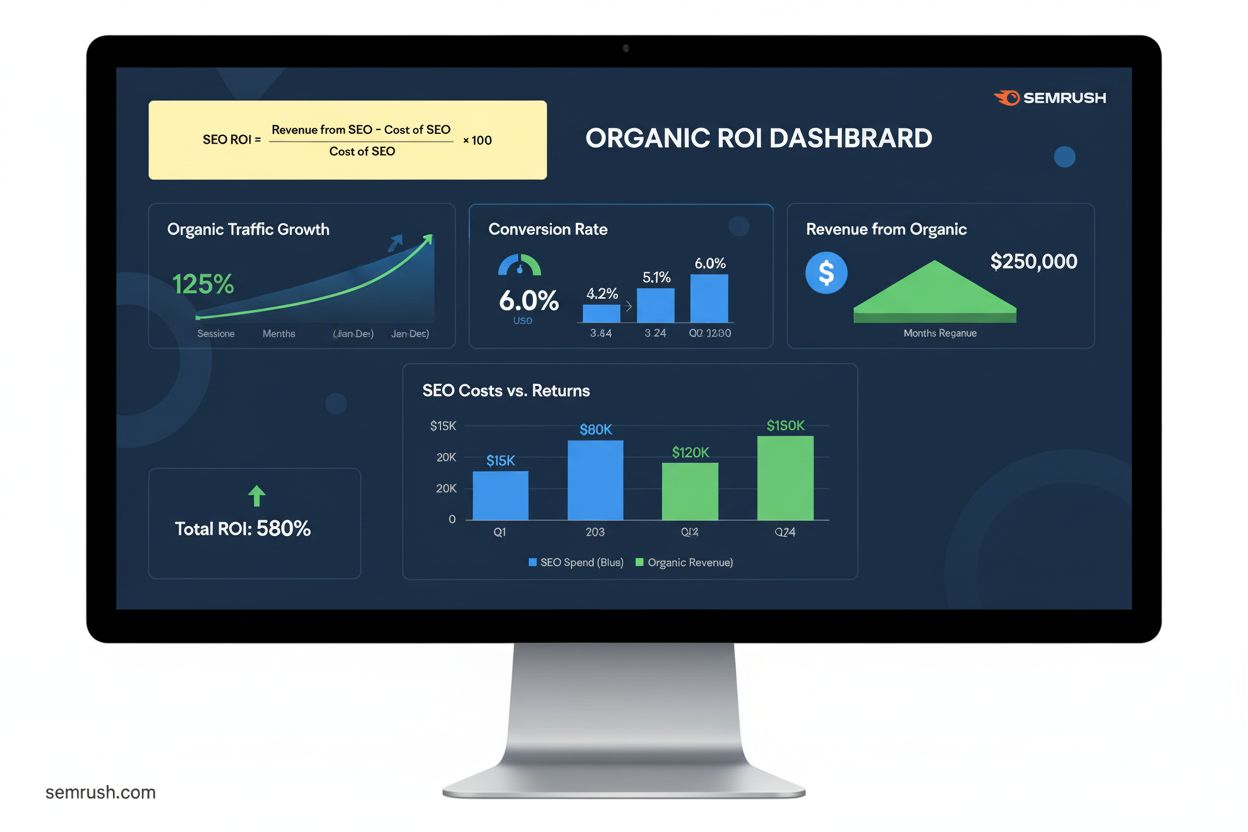
Organic ROI measures financial returns from SEO efforts versus investment costs. Learn how to calculate, track, and optimize organic search return on investment...