A/B Testing
A/B testing definition: A controlled experiment comparing two versions to determine performance. Learn methodology, statistical significance, and optimization s...
11 min read
Split testing, also known as A/B testing, is a method of comparing two or more versions of a webpage or digital asset by dividing traffic between them to determine which variation performs better at achieving a specific business goal. It involves randomly assigning visitors to different versions and measuring performance metrics to make data-driven optimization decisions.
Split testing, also known as A/B testing, is a method of comparing two or more versions of a webpage or digital asset by dividing traffic between them to determine which variation performs better at achieving a specific business goal. It involves randomly assigning visitors to different versions and measuring performance metrics to make data-driven optimization decisions.
Split testing, also known as A/B testing, is a quantitative research methodology that divides incoming website traffic between two or more variations of a digital asset to determine which version performs best according to predetermined business metrics. In a split test, each visitor is randomly assigned to experience only one version of the page, ensuring a controlled comparison between variants. The control version represents the original or current design, while the variant or challenger represents the modified version with one or more changes. By measuring key performance indicators such as conversion rate, click-through rate, bounce rate, or revenue per user, organizations can make data-driven decisions about which design changes genuinely improve user behavior and business outcomes. Split testing eliminates guesswork and opinion-based decision-making by providing empirical evidence of what actually resonates with real users in live environments.
The fundamental principle behind split testing is that small, incremental improvements compound over time. Rather than making sweeping redesigns based on assumptions, split testing allows teams to validate hypotheses with actual user data. This approach has become standard practice across industries—from e-commerce giants like Amazon and eBay to SaaS companies, media publishers, and financial services firms. The methodology is particularly valuable because it reduces the risk of implementing changes that might harm performance, while simultaneously identifying opportunities for meaningful optimization that directly impact revenue and user satisfaction.
Split testing emerged from the direct-response marketing industry, where practitioners have been running controlled experiments for over a century. Direct-mail marketers, for example, would test different headlines, offers, and designs by sending variations to different audience segments and tracking response rates. When the internet became a dominant marketing channel, this proven methodology was adapted for digital environments, giving rise to what we now call A/B testing or split testing. The term “A/B testing” specifically refers to comparing two versions (A and B), while “split testing” more broadly describes the practice of dividing traffic between variations.
The adoption of split testing accelerated dramatically in the 2000s with the emergence of dedicated testing platforms and tools. Companies like Optimizely, VWO, AB Tasty, and Unbounce democratized access to sophisticated testing capabilities, making it feasible for organizations of all sizes to run experiments. According to industry research, approximately 78% of enterprises now use some form of A/B testing or experimentation platform to optimize their digital properties. This widespread adoption reflects the proven ROI of split testing—studies consistently show that organizations implementing systematic testing programs achieve conversion rate improvements ranging from 10% to 300%, depending on their starting point and testing rigor.
The evolution of split testing has also been shaped by advances in statistical analysis and machine learning. Early testing relied on frequentist statistics and fixed sample sizes, but modern platforms increasingly employ Bayesian statistics and adaptive algorithms that can identify winners more quickly while maintaining statistical rigor. Additionally, the integration of split testing with personalization engines and AI-driven optimization has created new possibilities for testing at scale, allowing organizations to simultaneously run hundreds of experiments and automatically implement winning variations.
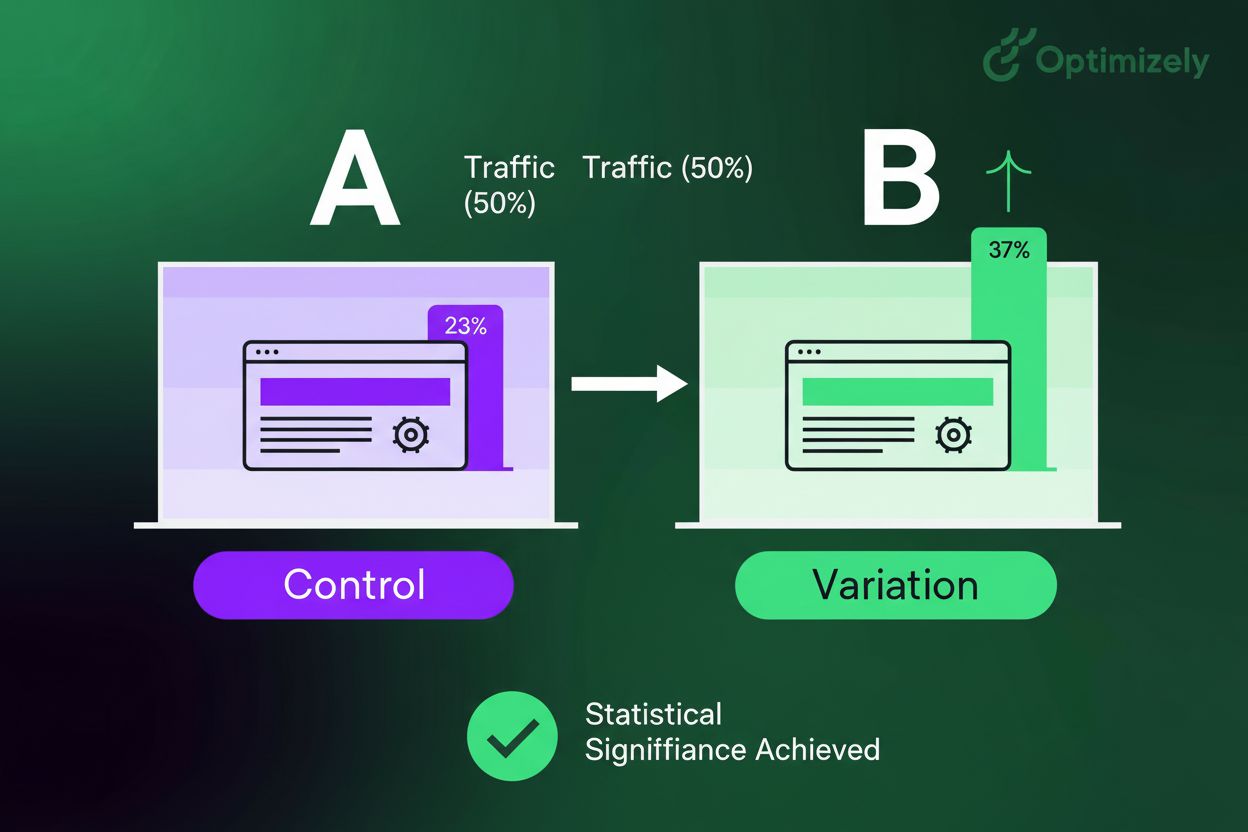
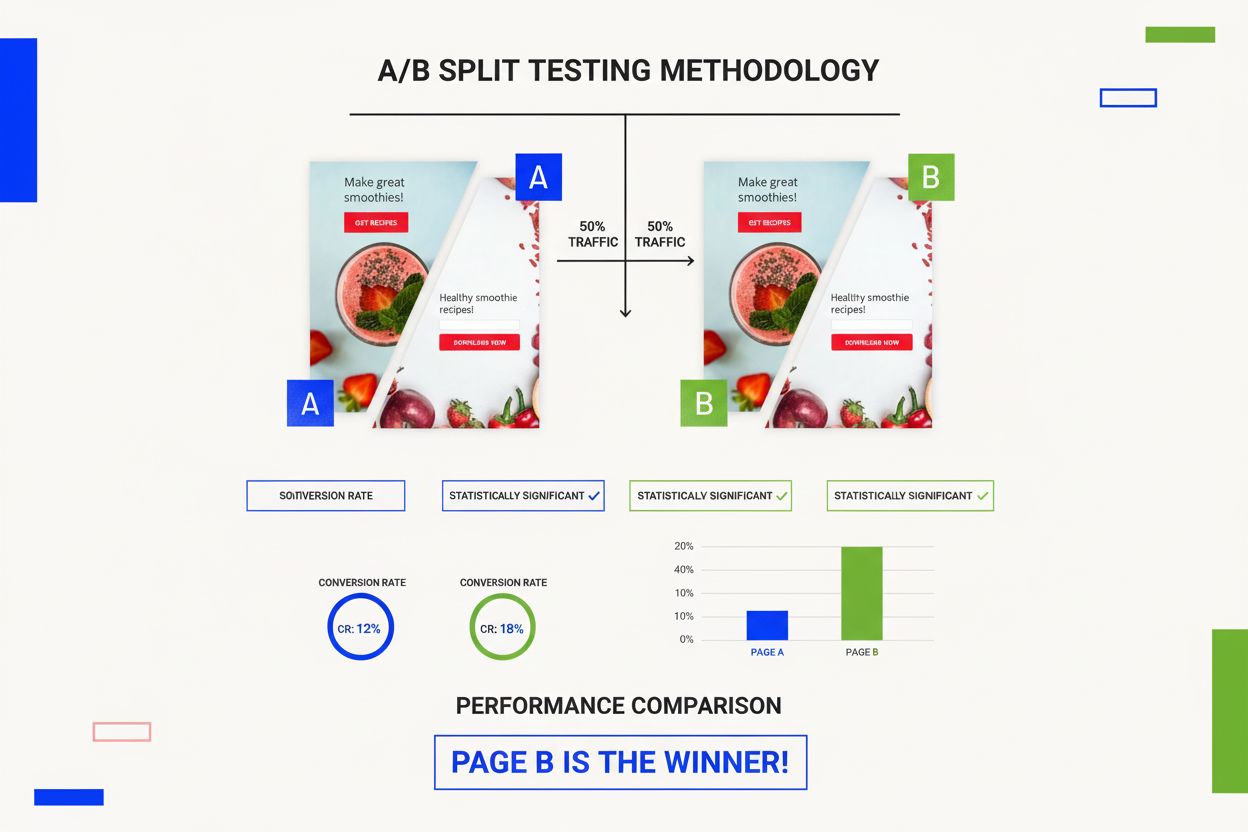
The mechanics of split testing follow a straightforward but scientifically rigorous process. When a visitor arrives at your website, a traffic allocation algorithm randomly assigns them to one of your test variants based on predetermined weightings. In a standard 50/50 split test, approximately half of visitors see the control version while the other half see the variant. However, traffic allocation can be adjusted based on business objectives and risk tolerance—for example, a 90/10 split might be used when testing a risky redesign to minimize potential negative impact on the majority of visitors.
Once assigned to a variant, each visitor experiences a consistent version throughout their session and on subsequent visits, ensuring data integrity. The testing platform then tracks specified conversion events and other metrics for each variant. These events might include form submissions, button clicks, purchases, video plays, or any other action aligned with your business goals. The platform continuously collects data and calculates performance metrics, comparing the baseline outcome metric (the control’s current performance) against the minimum detectable effect (the smallest change you want to reliably detect).
Statistical significance is calculated using mathematical formulas that determine the probability that observed differences between variants are real rather than due to random variation. Most platforms use a 95% confidence level (p=0.05) as the standard threshold, meaning there’s only a 5% probability that results occurred by chance. Achieving statistical significance requires sufficient sample size—the number of visitors and conversions needed depends on your baseline conversion rate, the effect size you’re trying to detect, and your desired confidence level. Sample size calculators help determine how long a test must run to reach reliable conclusions.
| Aspect | Split Testing (A/B) | Multivariate Testing (MVT) | Multipage Testing | Time-Split Testing |
|---|---|---|---|---|
| Number of Variables | One primary change per test | Multiple elements tested simultaneously | Changes across multiple pages in a funnel | Same page tested at different times |
| Traffic Required | Moderate (relatively less) | Very high (significantly more) | High (depends on funnel length) | Not recommended (unreliable) |
| Test Duration | 1-2 weeks minimum | 2-4+ weeks (often longer) | 2-4+ weeks | Highly variable and unreliable |
| Complexity | Simple and straightforward | Complex (many combinations) | Moderate to complex | Low but statistically flawed |
| Best Use Case | Testing radically different ideas, major redesigns | Optimizing existing pages, testing element interactions | Testing sequential user journeys, checkout flows | Not suitable for reliable testing |
| Statistical Power | High (reaches significance faster) | Lower (requires more data per combination) | Moderate (depends on funnel complexity) | Compromised by external factors |
| Implementation Effort | Low to moderate | Moderate to high | Moderate | Low |
| Typical Improvement Range | 10-50%+ | 5-20% | 5-30% | Unreliable results |
| Example | Testing headline A vs. headline B | Testing headline + image + CTA combinations | Testing landing page → product page → checkout variations | Comparing Monday traffic to Tuesday traffic |
Modern split testing platforms operate through two primary implementation methods: client-side testing and server-side testing. Client-side testing uses JavaScript to modify page content in the visitor’s browser after the page loads, making it quick to implement but potentially causing visual flicker as the page renders. Server-side testing modifies content before the page is delivered to the browser, eliminating flicker and providing better performance but requiring more technical implementation effort.
The choice between these approaches depends on your technical infrastructure and testing requirements. Platforms like Unbounce, Optimizely, and VWO offer visual editors that allow non-technical users to create test variations through drag-and-drop interfaces, while enterprise platforms often support custom code implementations for more complex testing scenarios. Integration with analytics platforms like Google Analytics, Mixpanel, and Amplitude is essential for tracking conversion events and analyzing results.
When implementing split tests, organizations must consider several technical factors: page load time (ensuring tests don’t slow down the site), mobile responsiveness (testing across different devices and screen sizes), browser compatibility (ensuring variants render correctly across all browsers), and data privacy compliance (GDPR, CCPA, and other regulations). Additionally, sample size calculators built into most platforms help determine the required traffic volume and test duration based on your specific metrics and goals.
Split testing is the cornerstone of Conversion Rate Optimization (CRO), a discipline focused on increasing the percentage of website visitors who complete desired actions. The strategic importance of split testing lies in its ability to systematically identify and implement improvements that directly impact revenue. For e-commerce businesses, even a 1% improvement in conversion rate can translate to significant revenue increases—if a site generates $1 million in annual revenue at a 2% conversion rate and improves to 2.5%, that represents a 25% revenue increase with no additional traffic.
Beyond immediate revenue impact, split testing provides competitive advantage through continuous learning. Organizations that systematically test and optimize accumulate knowledge about what resonates with their specific audience, creating a testing culture that becomes increasingly sophisticated over time. This institutional knowledge—captured in documented test results and learnings—becomes a valuable asset that competitors cannot easily replicate. Companies like Amazon, Netflix, and Spotify have built their optimization capabilities into their core operations, running thousands of experiments annually to maintain competitive advantage.
Split testing also serves a crucial risk mitigation function. Rather than implementing changes based on executive preference or industry trends, organizations can validate assumptions before full rollout. This is particularly important for high-stakes changes like checkout flow redesigns, pricing modifications, or major layout changes. By testing with a subset of traffic first, organizations can identify potential problems and refine solutions before exposing all visitors to potentially harmful changes.
Organizations can test virtually any element of their digital properties, but certain variables consistently deliver high-impact results. Headlines are among the most important elements to test, as they determine whether visitors continue reading or leave the page. Testing different value propositions, emotional appeals, or specificity levels in headlines often yields significant improvements. Call-to-action buttons are another high-impact testing area—variations in button color, text, size, and placement can substantially affect click-through rates.
Form optimization represents another critical testing area, particularly for lead generation and e-commerce sites. Testing form length (number of fields), field types (text input vs. dropdown), required vs. optional fields, and form layout can significantly impact submission rates. Pricing and offers are frequently tested in e-commerce and SaaS contexts—testing different price points, discount structures, payment terms, and guarantee offers can reveal optimal monetization strategies. Page layout and design variations test fundamental structural changes, such as single-column vs. multi-column layouts, above-the-fold content placement, and navigation structure.
Product imagery and video testing explores how different visual representations affect purchase decisions. Testing product photos vs. lifestyle images, professional photography vs. user-generated content, and video presence vs. static images can reveal audience preferences. Copy and messaging variations test different writing styles, tone, benefit-focused vs. feature-focused language, and social proof elements like testimonials and reviews. Trust signals and security elements test the impact of security badges, money-back guarantees, customer testimonials, and company credentials on conversion rates.
Successful split testing requires adherence to established best practices that ensure reliable, actionable results. The first critical practice is starting with a clear hypothesis—rather than testing random ideas, formulate specific predictions about what changes will improve performance and why. A strong hypothesis is grounded in user research, analytics data, and understanding of user behavior. For example: “Changing the CTA button from ‘Learn More’ to ‘Start Free Trial’ will increase click-through rate because it clearly communicates the value proposition and reduces perceived friction.”
Isolating variables is essential for understanding what actually drives performance changes. Testing only one element at a time allows you to attribute performance differences to that specific change. Testing multiple elements simultaneously creates ambiguity—if performance improves, you won’t know which change was responsible. The only exception is when testing complete redesigns where multiple coordinated changes are intentional.
Determining adequate sample size before launching a test prevents premature conclusions. Using sample size calculators, specify three parameters: your baseline conversion rate, the minimum detectable effect (the smallest improvement you want to reliably detect), and your desired confidence level (typically 95%). These inputs determine how many visitors you need to reach statistical significance. Running tests for at least 1-2 weeks ensures you capture daily and weekly variations in user behavior.
Monitoring for statistical significance rather than stopping tests based on preliminary results is critical. Many organizations make the mistake of ending tests as soon as one variant appears to be winning, but this leads to false positives. Continue running tests until you reach your predetermined sample size and statistical significance threshold. Most modern platforms display confidence percentages that indicate whether results are statistically reliable.
Documenting and learning from all tests—both winners and losers—builds organizational knowledge. Even failed tests provide valuable insights about what doesn’t work for your audience. Maintaining a testing roadmap and wins database helps teams avoid retesting similar hypotheses and builds a foundation for increasingly sophisticated optimization efforts.
Split testing success depends on tracking the right metrics aligned with business objectives. Primary metrics directly measure your test goal and should be the focus of decision-making. For e-commerce sites, this might be purchase rate or revenue per visitor. For SaaS companies, it might be free trial signup rate or demo request completion. For publishers, it might be article completion rate or newsletter signup rate.
Guardrail metrics monitor for unintended negative consequences of winning variants. For example, a test might increase click-through rate but decrease average order value, resulting in lower overall revenue. Guardrail metrics might include bounce rate, time on page, pages per session, return visitor rate, and customer lifetime value. Tracking these metrics prevents optimizing for one metric at the expense of overall business performance.
Leading indicators predict future conversions and help identify promising variants before final conversion events occur. These might include form start rate, video play rate, scroll depth, or time spent on page. Monitoring leading indicators allows you to identify potential winners earlier in the testing process. Lagging indicators like customer retention rate and repeat purchase rate measure long-term impact of changes, though they require longer observation periods.
Different split testing platforms offer varying capabilities suited to different organizational needs and technical sophistication levels. Unbounce specializes in landing page testing with a visual builder and built-in A/B testing, making it ideal for marketers without technical backgrounds. Optimizely provides enterprise-grade testing capabilities with advanced segmentation and personalization features. VWO offers comprehensive testing, heatmapping, and session recording capabilities. AB Tasty combines testing with personalization and AI-driven optimization.
For organizations using specific platforms, understanding platform-specific features is important. Some platforms offer multivariate testing capabilities that allow testing multiple elements simultaneously. Others provide traffic allocation controls that let you adjust the percentage of traffic going to each variant. Audience segmentation features allow testing different variants for different visitor segments. Integration capabilities with analytics platforms, CRM systems, and marketing automation tools determine how easily test data flows into your broader analytics infrastructure.
Statistical engines vary between platforms—some use frequentist statistics with fixed sample sizes, while others employ Bayesian approaches that can identify winners more quickly. Understanding your platform’s statistical methodology helps you interpret results correctly and set appropriate confidence thresholds.
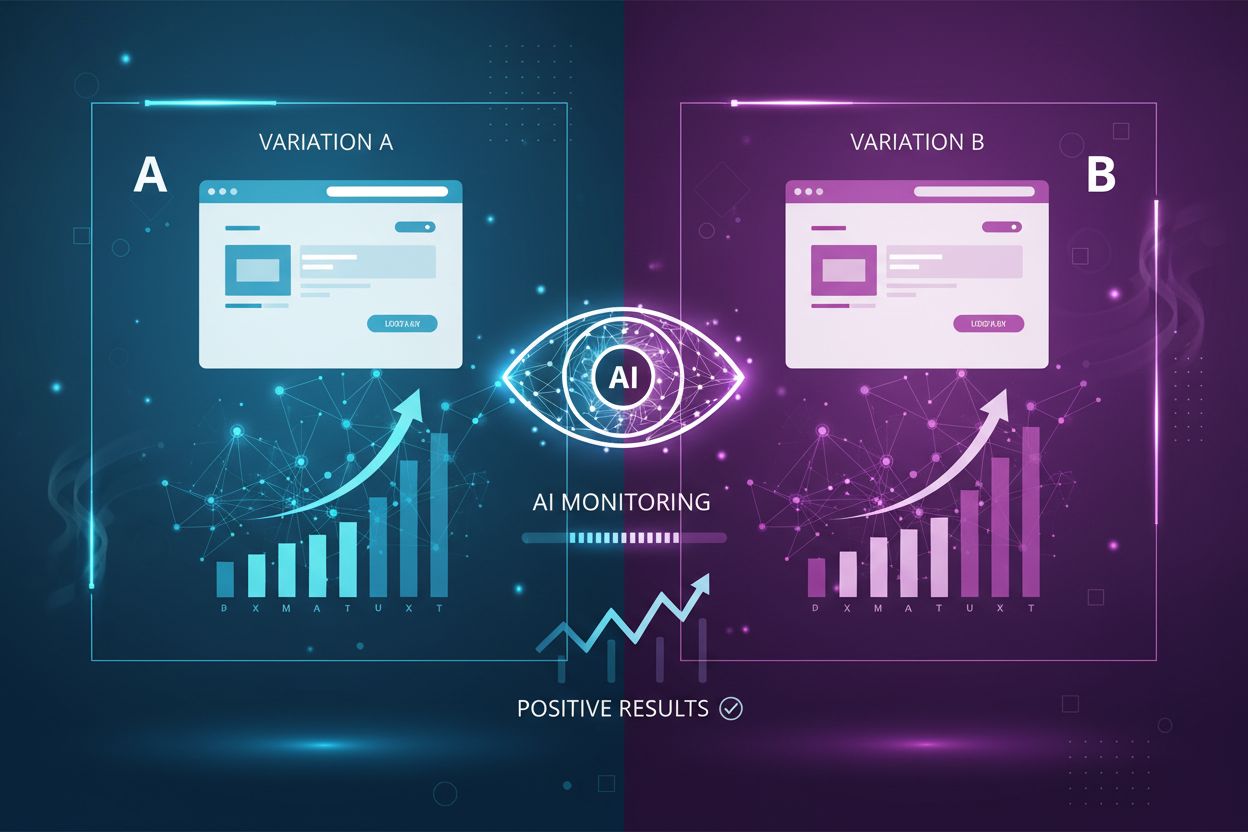
The future of split testing is being shaped by several emerging trends. AI-powered optimization is increasingly automating the testing process, with machine learning algorithms identifying promising variations and automatically allocating more traffic to winning variants. Continuous testing approaches replace traditional discrete tests with ongoing optimization that continuously learns and adapts. Personalization at scale combines split testing with individual-level personalization, allowing different variants to be shown to different user segments based on their characteristics and behavior.
Cross-channel testing extends split testing beyond websites to mobile apps, email campaigns, and other digital touchpoints. Privacy-first testing addresses growing concerns about data collection and cookie restrictions by implementing testing methodologies that work within privacy-constrained environments. Real-time experimentation powered by edge computing and serverless architectures enables faster test execution and results.
The integration of split testing with AI monitoring platforms like AmICited represents an emerging frontier. As organizations optimize their content through split testing, they increasingly need to understand how their best-performing pages appear in AI-generated responses from systems like ChatGPT, Perplexity, and Google AI Overviews. This creates a feedback loop where split testing insights inform content optimization, which in turn affects AI citation patterns. Organizations that understand both split testing and AI citation dynamics will have significant competitive advantages in capturing visibility across both human and AI-driven search and discovery channels.
Split testing has evolved from a specialized technique used by direct-response marketers to a fundamental business practice employed by organizations across industries. The methodology’s power lies in its simplicity—divide traffic, measure results, implement winners—combined with its scientific rigor that ensures decisions are based on evidence rather than opinion. Organizations that embrace split testing as a core capability, rather than an occasional tactic, consistently outperform competitors in conversion rates, customer acquisition costs, and overall profitability.
The key to successful split testing is treating it as an ongoing discipline rather than a one-time project. By systematically testing hypotheses, documenting learnings, and building on previous results, organizations create a culture of experimentation that drives continuous improvement. Combined with emerging technologies like AI-powered optimization and AI citation monitoring through platforms like AmICited, split testing becomes even more powerful—allowing organizations to optimize not just for human visitors but for visibility across the entire digital ecosystem where their content appears.
Split testing (A/B testing) compares two or more complete page variations with potentially multiple changes, while multivariate testing tests multiple specific elements and their combinations on a single page. Split testing requires less traffic and is faster for radical changes, whereas multivariate testing requires significantly more traffic but reveals how different elements interact with each other. Choose split testing for testing fundamentally different designs and multivariate testing for optimizing existing pages by testing specific element combinations.
Split tests should run for at least 1-2 weeks to account for daily and weekly fluctuations in user behavior, even if statistical significance is reached earlier. The exact duration depends on your traffic volume, baseline conversion rate, and minimum detectable effect size. Most experts recommend collecting at least 100-200 conversions per variant and ensuring the test captures a full business cycle. Using a sample size calculator based on your specific metrics helps determine the appropriate test duration for reliable results.
Primary metrics should directly measure your test goal, such as conversion rate, click-through rate, or purchase rate. Additionally, track guardrail metrics like bounce rate, time on page, and retention rate to ensure the winning variant doesn't negatively impact other important behaviors. For e-commerce, monitor metrics like average order value and customer acquisition cost. Tracking multiple metrics prevents false positives where one metric improves while others decline, ensuring your optimization truly benefits the business.
No, stopping a test early based on preliminary results is a common mistake that leads to unreliable conclusions. Even if one variant appears to be winning, you must continue until you reach your predetermined sample size and statistical significance threshold (typically 95% confidence). Early stopping can result in false positives due to random variation. Statistical significance calculators built into most testing platforms help determine when you have sufficient data to confidently declare a winner.
Start by testing elements that directly impact your conversion funnel, identified through usability testing and analytics. High-impact elements to test first include headlines, call-to-action buttons, form length, and page layout. Prioritize testing changes that address problems identified in user research or analytics data rather than random elements. Focus on testing one variable at a time to isolate the impact of each change, and test bigger, bolder changes before minor tweaks, as they produce faster, more reliable results.
Split testing generates performance data that organizations need to track and monitor across digital channels. AI monitoring platforms like AmICited help track how split testing results and optimized content appear in AI-generated responses from systems like ChatGPT, Perplexity, and Google AI Overviews. By understanding which page variations perform best through split testing, organizations can optimize their content for both human visitors and AI citation, ensuring their highest-performing versions are the ones cited by AI systems.
Statistical significance measures the probability that test results are due to actual differences between variants rather than random chance. A 95% confidence level (p=0.05) is the industry standard, meaning there's only a 5% probability the results occurred by chance. Achieving statistical significance requires sufficient sample size and test duration. Most A/B testing platforms calculate this automatically, displaying confidence percentages that indicate whether results are reliable enough to implement. Without statistical significance, you cannot confidently declare one variant superior to another.
Start tracking how AI chatbots mention your brand across ChatGPT, Perplexity, and other platforms. Get actionable insights to improve your AI presence.
A/B testing definition: A controlled experiment comparing two versions to determine performance. Learn methodology, statistical significance, and optimization s...
Master A/B testing for AI visibility with our comprehensive guide. Learn GEO experiments, methodology, best practices, and real-world case studies for better AI...
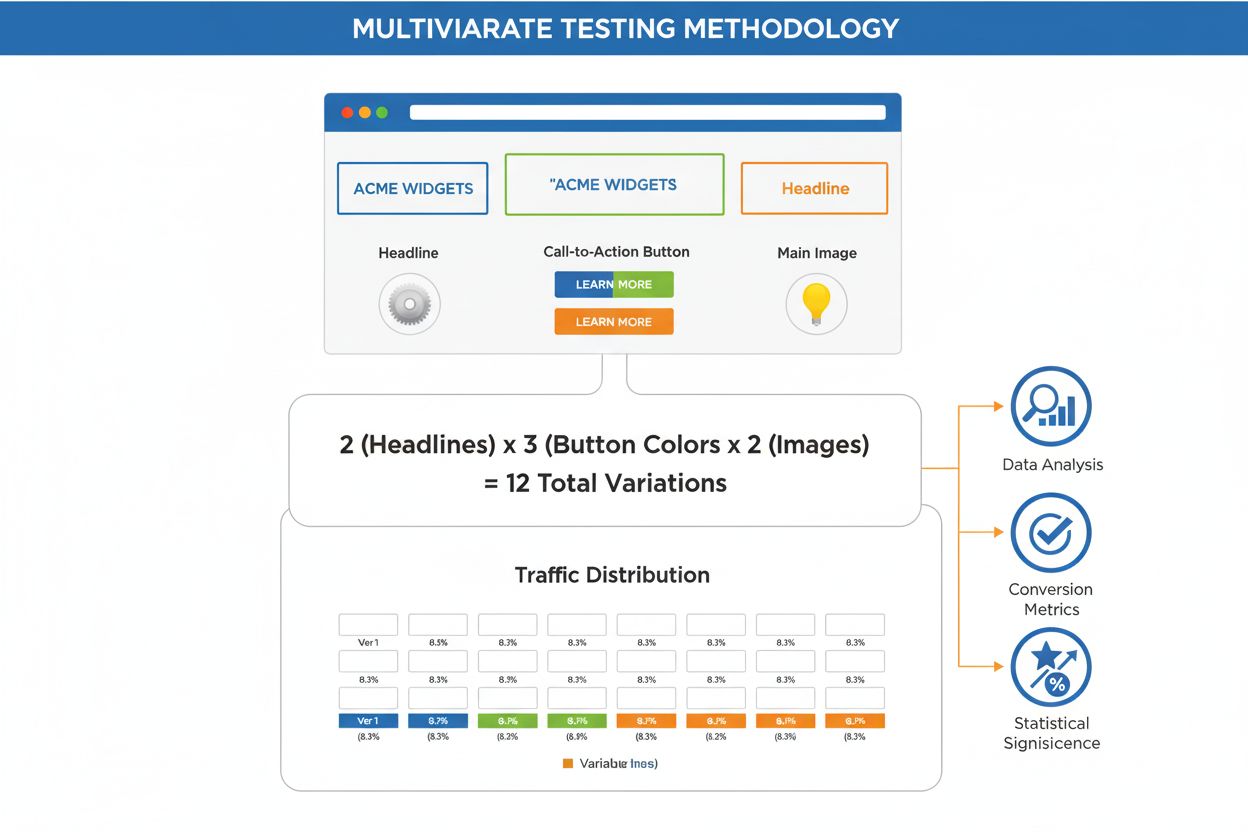
Multivariate testing definition: A data-driven methodology for testing multiple page variables simultaneously to identify optimal combinations that maximize con...