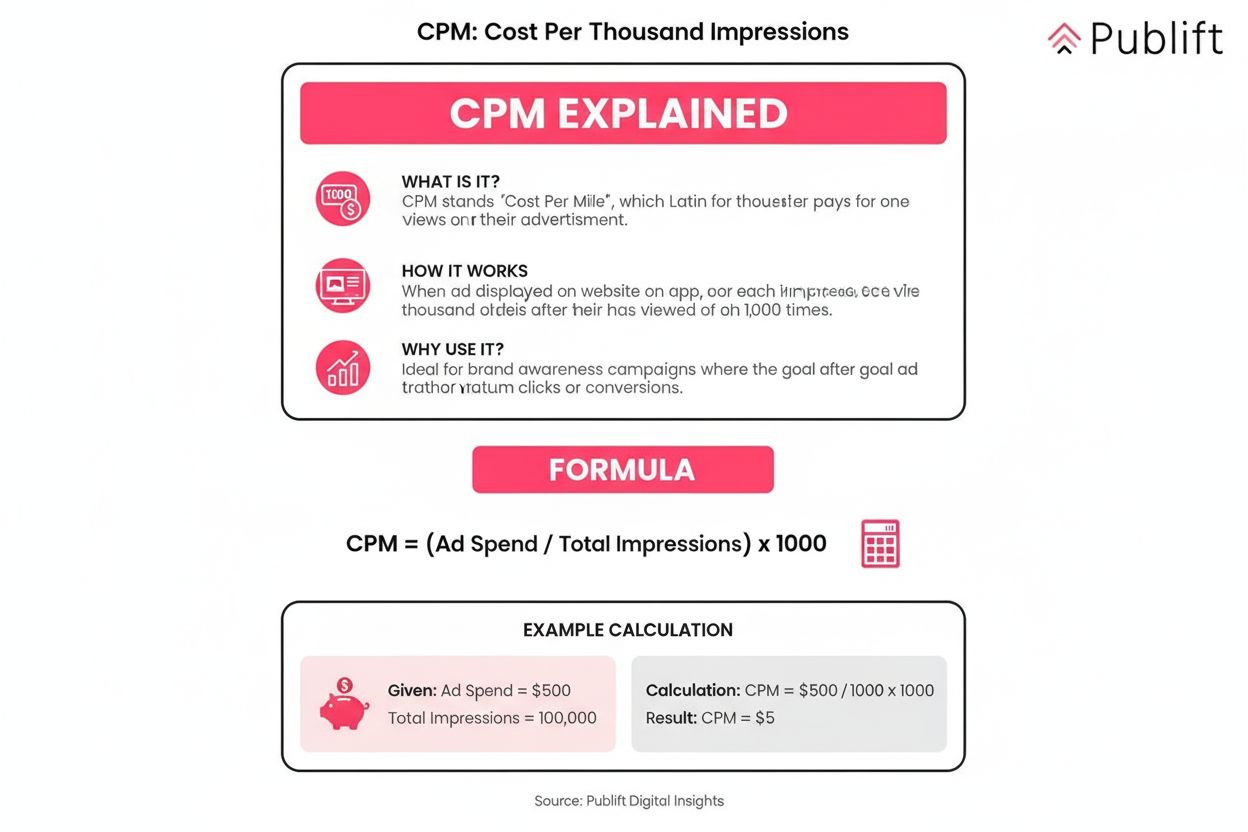
Cost Per Thousand (CPM)
Learn what CPM (Cost Per Thousand) means in digital advertising. Understand the formula, calculation methods, industry benchmarks, and how CPM compares to other...
9 min read
Cost Per Acquisition (CPA) is a marketing metric that measures the total cost required to acquire one paying customer through a specific marketing campaign or channel. It is calculated by dividing total marketing costs by the number of new customers acquired, providing a direct measure of marketing efficiency and profitability.
Cost Per Acquisition (CPA) is a marketing metric that measures the total cost required to acquire one paying customer through a specific marketing campaign or channel. It is calculated by dividing total marketing costs by the number of new customers acquired, providing a direct measure of marketing efficiency and profitability.
Cost Per Acquisition (CPA) is a fundamental marketing metric that measures the total cost required to acquire one paying customer through a specific marketing campaign, channel, or tactic. It represents the direct financial investment needed to convert a prospect into a customer and is calculated by dividing total marketing costs by the number of new customers acquired during a defined period. CPA serves as a critical indicator of marketing efficiency and directly impacts business profitability, making it essential for data-driven decision-making in modern marketing organizations. Unlike vanity metrics such as impressions or clicks, CPA connects advertising spend directly to revenue-generating outcomes, providing clear visibility into whether marketing investments are generating acceptable returns.
The concept of Cost Per Acquisition emerged during the early 2000s as digital marketing matured and attribution tracking became more sophisticated. Initially, marketers relied on broad metrics like cost-per-click and conversion rates, but as e-commerce and performance marketing grew, the need for a more precise financial metric became apparent. The rise of Google Ads, Facebook Ads, and other programmatic platforms accelerated CPA adoption, as these platforms provided built-in conversion tracking capabilities that made CPA calculation straightforward and reliable. Today, CPA has become the gold standard for evaluating campaign performance across industries, with over 78% of enterprises using some form of AI-driven cost monitoring tools to track acquisition efficiency. The metric has evolved beyond simple calculation to encompass sophisticated attribution modeling, multi-touch analysis, and real-time optimization strategies that account for complex customer journeys across multiple touchpoints.
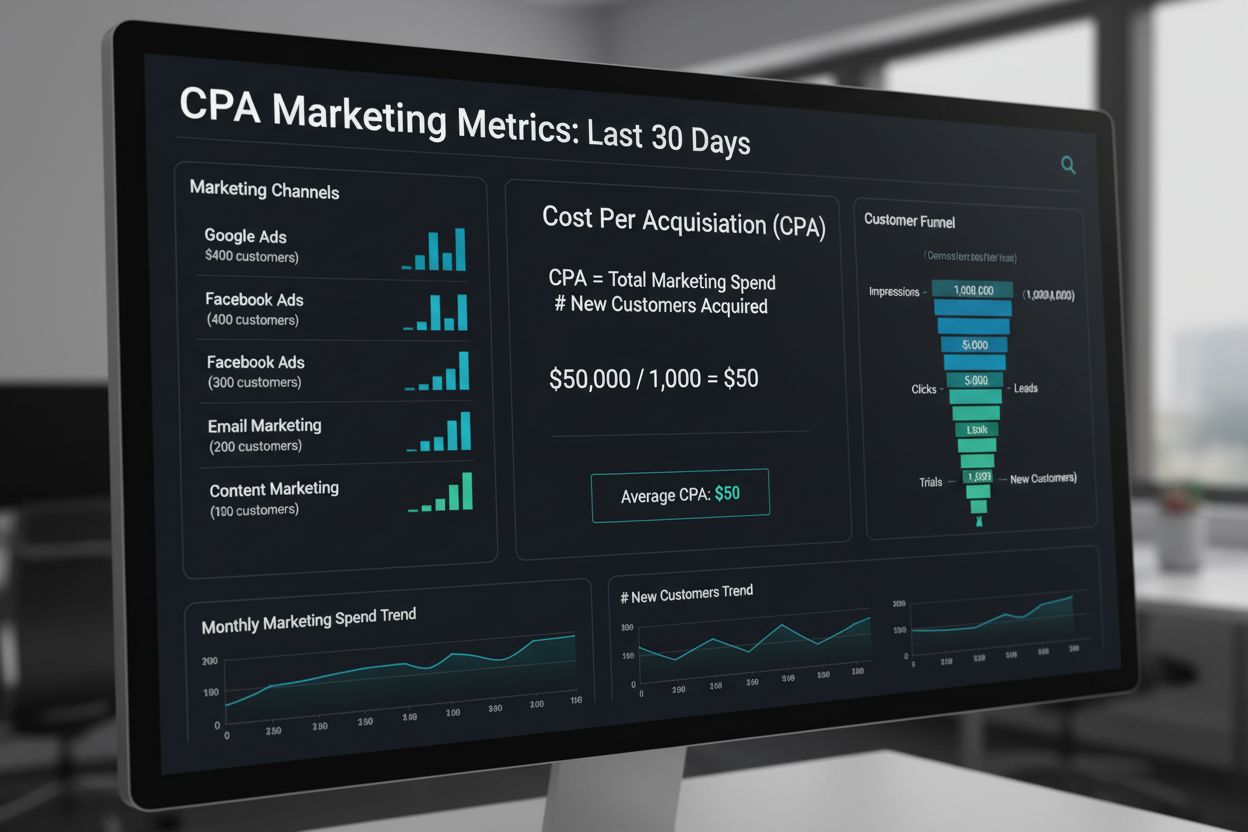
The Cost Per Acquisition formula is elegantly simple yet powerful in its implications: CPA = Total Marketing Costs ÷ Number of New Customers Acquired. To illustrate with a concrete example, if a company invests $5,000 in a Google Ads campaign and acquires 200 customers through that campaign, the CPA is $25 per customer ($5,000 ÷ 200). However, accurate CPA calculation requires careful consideration of what costs to include. Beyond direct ad spend, organizations should factor in creative development costs, software subscription fees for marketing tools, agency management fees, landing page optimization expenses, and any other costs directly attributable to customer acquisition. The challenge intensifies when considering multi-channel attribution, as customers often interact with multiple touchpoints before converting. A customer might see a Facebook ad, search for the brand on Google, receive an email, and finally convert—determining which channel receives credit significantly impacts each channel’s calculated CPA and influences budget allocation decisions.
| Metric | Definition | Scope | Calculation | Primary Use | Time to Measure |
|---|---|---|---|---|---|
| CPA (Cost Per Acquisition) | Cost to acquire one paying customer | Channel or campaign-specific | Total costs ÷ conversions | Campaign optimization and ROI | Immediate (real-time) |
| CAC (Customer Acquisition Cost) | Total cost to acquire customers across all channels | Business-wide, strategic | All marketing + sales costs ÷ total customers | Business planning and profitability | Monthly or quarterly |
| CPL (Cost Per Lead) | Cost to generate one qualified lead | Campaign or channel-specific | Total costs ÷ leads generated | Lead generation campaigns | Immediate |
| CPC (Cost Per Click) | Cost for each click on an advertisement | Ad-level | Total ad spend ÷ clicks | Traffic acquisition and bidding | Real-time |
| ROAS (Return on Ad Spend) | Revenue generated per dollar spent | Campaign or channel-specific | Total revenue ÷ ad spend | Revenue efficiency | Immediate |
| LTV (Lifetime Value) | Total profit from a customer over their lifetime | Customer-level | Average customer profit × retention period | Long-term profitability | Quarterly or annual |
Cost Per Acquisition operates differently depending on the marketing channel, requiring marketers to understand channel-specific nuances. In Pay-Per-Click (PPC) advertising through Google Ads or Bing Ads, CPA calculation is straightforward because platforms provide built-in conversion tracking that directly links ad spend to acquisitions. The platform automatically records which keywords and ads led to conversions, making CPA measurement reliable and real-time. In social media marketing on Facebook, Instagram, or LinkedIn, CPA calculation follows the same formula but attribution becomes more complex due to the discovery nature of social platforms and potential delays between ad exposure and conversion. Affiliate marketing operates on a CPA model by design—companies pay affiliates a fixed fee per sale they generate, making CPA predictable but requiring careful partner management. Content marketing and SEO present the greatest measurement challenges because costs are diffuse (writer salaries, tool subscriptions, time investment) and conversions occur over extended periods, requiring estimation rather than precise tracking. Email marketing CPA is typically very low for existing customers but must account for the cost of acquiring email subscribers initially. Understanding these channel-specific dynamics enables marketers to set realistic CPA targets and optimize appropriately for each channel’s unique characteristics.
The business impact of Cost Per Acquisition extends far beyond marketing metrics—it directly determines company profitability and growth sustainability. A lower CPA means more customers acquired with the same budget, directly increasing profit margins and enabling aggressive scaling. Research indicates that companies optimizing CPA achieve 40-60% better marketing ROI compared to those using only top-of-funnel metrics. CPA optimization becomes particularly critical during economic downturns when marketing budgets tighten and efficiency becomes non-negotiable. For SaaS companies, where customer lifetime value can exceed $10,000, a CPA of $200-300 is acceptable and sustainable, but for e-commerce retailers with lower margins, a CPA exceeding 30% of average order value becomes problematic. The relationship between CPA and Customer Lifetime Value (LTV) is fundamental to business health—a healthy business maintains an LTV:CPA ratio of at least 3:1, meaning each customer’s lifetime value should be at least three times the cost to acquire them. This ratio provides a buffer for operational costs, customer service, and profit margins. Companies that fail to maintain this ratio face unsustainable unit economics and eventual business failure, making CPA optimization not just a marketing concern but a survival imperative.
Cost Per Acquisition varies dramatically across industries based on competition, customer value, and market dynamics. According to 2024 industry data, furniture retail has the highest CPA at $156.72, reflecting high competition and lower conversion rates, while home and garden averages $36.28, benefiting from lower competition and higher purchase intent. SaaS companies typically see CPAs of $205 due to longer sales cycles and higher customer value, retail averages $87, and fashion brands average $129. B2B companies generally experience higher CPAs ($300-500+) because of longer decision cycles and multiple stakeholders, while consumer services average $45-65. Financial services and insurance maintain elevated CPAs ($80-120) due to regulatory complexity and high competition. Healthcare averages $70-100, constrained by targeting restrictions and privacy regulations. Education ranges $100-150 due to long consideration cycles but high lifetime value. These benchmarks provide context but should not dictate strategy—a company’s acceptable CPA depends entirely on its unit economics, profit margins, and customer lifetime value. A company with a $1,000 average order value can sustain a $300 CPA, while a company with a $50 average order value cannot. Understanding your specific business metrics is more important than matching industry averages.
In the emerging landscape of AI-powered search engines and generative AI platforms, Cost Per Acquisition takes on new dimensions that traditional marketers must understand. When brands appear in ChatGPT responses, Perplexity AI results, Google AI Overviews, or Claude outputs, they gain visibility to users actively seeking information—a high-intent audience. However, tracking CPA from these AI sources presents unique challenges because attribution is indirect and requires sophisticated tracking mechanisms. Users may see a brand mentioned in an AI response, visit the website, and convert days or weeks later, making last-click attribution insufficient. AmICited and similar AI monitoring platforms help brands track when and how often their domain appears in AI responses, enabling calculation of AI-specific CPA by dividing marketing investment in AI optimization by conversions attributed to AI visibility. This emerging metric reveals whether AI brand presence translates into profitable customer acquisition. Early data suggests that brands appearing in AI responses experience 15-25% higher conversion rates compared to traditional search results, potentially justifying investment in AI optimization strategies. As AI search continues growing—projected to capture 25-30% of search traffic by 2026—understanding AI-specific CPA becomes critical for competitive advantage and budget allocation decisions.
Effective CPA management requires systematic approaches across multiple dimensions. First, accurate conversion tracking is foundational—ensure conversion pixels are properly implemented on post-purchase pages, form submissions are correctly attributed, and tracking codes are consistently applied across all campaigns. Second, define conversions precisely—a conversion should represent a genuine customer acquisition, not just a lead or form submission, unless your business model specifically targets leads. Third, implement proper attribution modeling rather than relying solely on last-click attribution; consider linear attribution (equal credit to all touchpoints), time-decay attribution (more credit to recent touchpoints), or data-driven attribution (machine learning-based credit allocation). Fourth, segment CPA analysis by channel, campaign, audience, and time period to identify performance drivers and optimization opportunities. Fifth, track CPA trends over time to detect anomalies—a sudden CPA spike might indicate increased competition, ad fatigue, or technical tracking issues requiring immediate investigation. Sixth, align CPA targets with business objectives—if your LTV is $300, set a CPA target of $100 or less; if pursuing market share over profitability, you might accept higher CPAs temporarily. Finally, establish CPA guardrails and automated alerts that notify teams when CPA deviates from expected ranges, enabling rapid response to performance degradation.
The future of Cost Per Acquisition is evolving rapidly as marketing technology advances and customer journeys become increasingly complex. Privacy-first attribution is reshaping how CPA is calculated—with third-party cookies disappearing and privacy regulations tightening, marketers must adopt first-party data strategies and consent-based tracking that may reduce attribution accuracy but improve customer trust. AI-powered attribution using machine learning models will increasingly replace rule-based attribution, providing more sophisticated credit allocation across touchpoints. Incrementality testing and marketing mix modeling will complement CPA metrics by measuring true causal impact rather than correlation, answering the critical question: “How much of this conversion would have happened anyway without this marketing effort?” Unified measurement frameworks combining CPA with brand lift metrics, customer satisfaction scores, and lifetime value predictions will provide holistic views of marketing effectiveness beyond simple acquisition cost. Real-time CPA optimization powered by AI will enable automatic bid adjustments, audience refinements, and budget allocation without human intervention. Cross-device and cross-platform CPA tracking will become standard as customers interact with brands across smartphones, tablets, desktops, and emerging devices. Sustainability-focused CPA metrics may emerge, measuring customer acquisition cost per unit of environmental impact, reflecting growing corporate responsibility concerns. The integration of AI monitoring platforms into CPA analysis will enable brands to understand acquisition costs specifically from AI-powered search and recommendation systems, creating new optimization opportunities and competitive advantages for early adopters.
Cost Per Acquisition is not an isolated metric but rather a critical component of broader marketing ROI and business growth strategies. When combined with Customer Lifetime Value (LTV), CPA enables calculation of the LTV:CPA ratio, which directly indicates business sustainability and growth potential. A company with a 5:1 LTV:CPA ratio has significantly more flexibility to invest in growth, test new channels, and weather market downturns compared to a company with a 2:1 ratio. CPA optimization directly impacts Return on Ad Spend (ROAS)—a lower CPA with consistent average order value automatically increases ROAS, making marketing budgets more efficient. For forecasting and planning, a predictable CPA enables accurate revenue projections; if you know your CPA is $50 and your LTV is $300, you can confidently forecast that a $100,000 marketing investment will generate approximately 2,000 customers worth $600,000 in lifetime value. CPA data also informs competitive positioning—companies with lower CPAs than competitors can undercut pricing, invest more in customer experience, or achieve higher profit margins, creating sustainable competitive advantages. In board presentations and investor communications, CPA demonstrates marketing efficiency and business scalability in language that resonates with financial stakeholders. Finally, CPA optimization creates a virtuous cycle where lower acquisition costs enable more aggressive growth investment, which generates more customer data for optimization, which further reduces CPA, creating compounding efficiency gains that compound over time.
CPA (Cost Per Acquisition) is a tactical, channel-specific metric that measures the cost to acquire a customer through a particular campaign or platform, while CAC (Customer Acquisition Cost) is a strategic, business-wide metric that includes all sales and marketing costs across all channels. CPA is granular and used for campaign optimization, whereas CAC provides a holistic view of total acquisition expenses including salaries, tools, and overhead costs.
Cost Per Acquisition is calculated using the formula: CPA = Total Marketing Costs ÷ Number of New Customers Acquired. For example, if you spend $5,000 on a Google Ads campaign and acquire 200 customers, your CPA is $25 ($5,000 ÷ 200). This calculation should include all direct costs such as ad spend, creative development, software fees, and agency management costs associated with the campaign.
A good CPA is one that maintains a healthy ratio with Customer Lifetime Value (LTV), ideally 3:1 or higher, meaning your CPA should be no more than one-third of your LTV. For example, if your average customer lifetime value is $300, your target CPA should be $100 or less. However, benchmarks vary significantly by industry—SaaS companies average $205 CPA, retail averages $87, and fashion brands average $129, so context matters.
CPC (Cost Per Click) measures the cost for each click on an ad, CPL (Cost Per Lead) measures the cost to generate a lead or form submission, while CPA measures the cost to acquire a paying customer. CPA is the bottom-of-funnel metric that directly impacts revenue, whereas CPC and CPL are top-of-funnel metrics that indicate interest but not conversion. Understanding all three helps optimize the entire customer acquisition funnel.
Key factors affecting CPA include industry competition and keyword costs, audience targeting precision and segmentation quality, ad creative quality and relevance, landing page conversion rate optimization, and seasonal market trends. Additionally, the attribution model used, Quality Score in PPC platforms, and the overall marketing channel mix significantly impact CPA. External factors like market saturation and competitor bidding also play important roles.
Businesses can reduce CPA by optimizing landing pages for higher conversion rates, refining audience targeting to reach high-intent users, improving ad creative and copy quality, implementing A/B testing across campaigns, leveraging retargeting to re-engage interested users, and shifting budget to lower-CPA channels. Additionally, improving Quality Score in PPC campaigns, removing negative keywords, and implementing proper conversion tracking ensures accurate measurement and optimization opportunities.
CPA is critical for AI monitoring platforms like AmICited because it helps brands understand the cost-effectiveness of their customer acquisition efforts across AI-powered search engines and platforms. By tracking CPA alongside brand mentions in AI responses (ChatGPT, Perplexity, Google AI Overviews, Claude), companies can measure whether their AI visibility translates into profitable customer acquisition, connecting brand presence to actual business outcomes.
CPA and ROAS are complementary metrics that together provide a complete picture of campaign profitability. While CPA measures the cost to acquire each customer, ROAS measures the revenue generated for every dollar spent on advertising. A low CPA combined with high ROAS indicates an efficient, profitable campaign. For example, a $25 CPA with an average order value of $100 generates a 4:1 ROAS, demonstrating strong campaign performance.
Start tracking how AI chatbots mention your brand across ChatGPT, Perplexity, and other platforms. Get actionable insights to improve your AI presence.
Learn what CPM (Cost Per Thousand) means in digital advertising. Understand the formula, calculation methods, industry benchmarks, and how CPM compares to other...

Learn what Cost Per Click (CPC) means in digital advertising. Understand CPC calculation, bidding strategies, and how it compares to CPM and CPA models for opti...
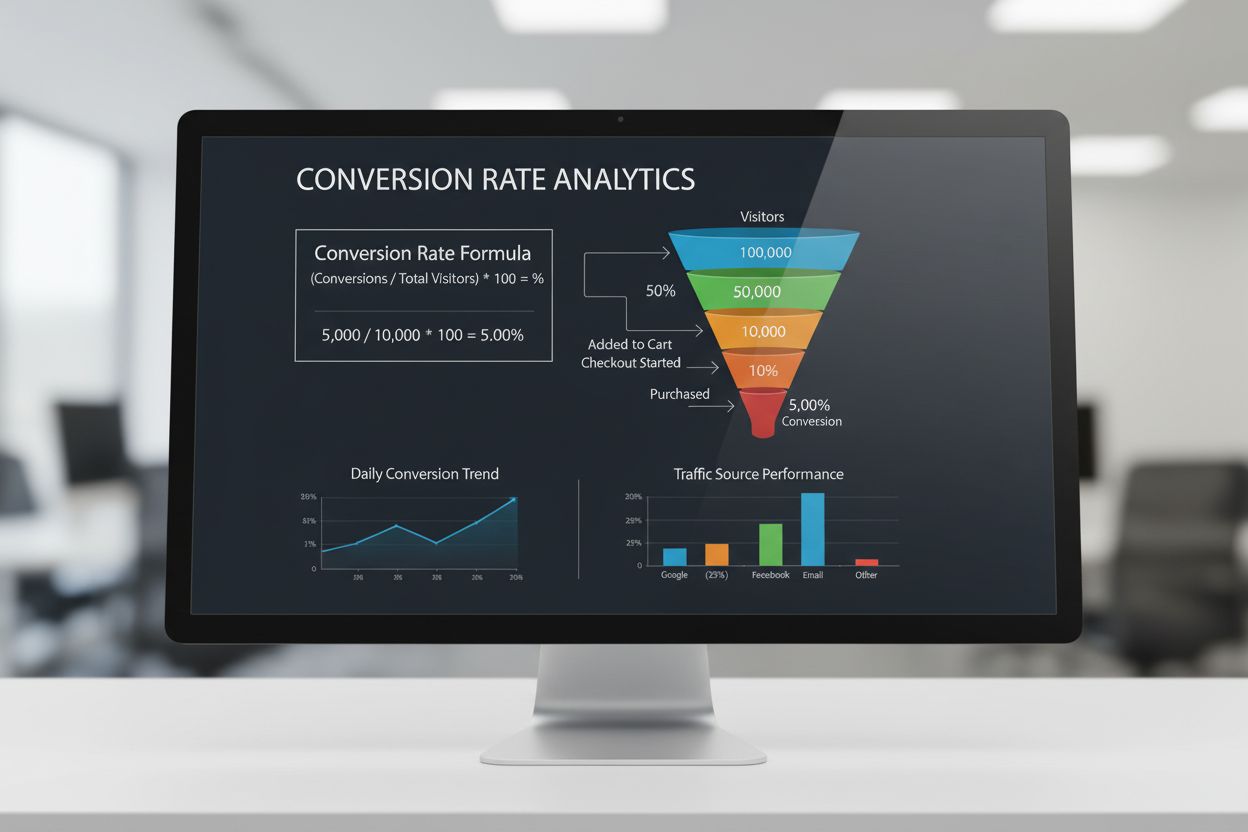
Conversion rate measures the percentage of visitors completing desired actions. Learn the formula, industry benchmarks, types, and optimization strategies for t...
Cookie Consent
We use cookies to enhance your browsing experience and analyze our traffic. See our privacy policy.