
What is a Knowledge Graph and Why Does It Matter? | AI Monitoring FAQ
Discover what knowledge graphs are, how they work, and why they're essential for modern data management, AI applications, and business intelligence.
8 min read
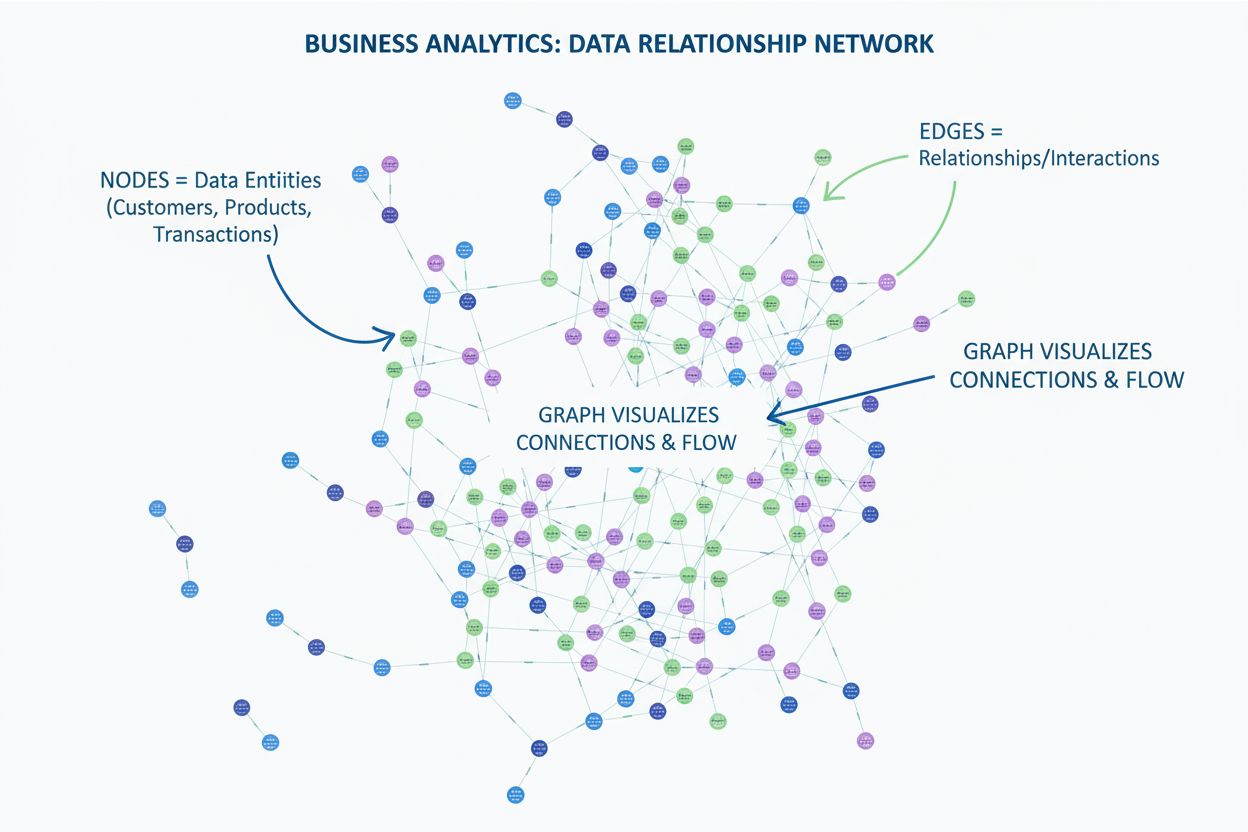
A graph is a visual representation that displays relationships between data points using nodes (vertices) and edges (connections). It enables the clear illustration of how different data entities interact, connect, and influence one another within complex datasets.
A graph is a visual representation that displays relationships between data points using nodes (vertices) and edges (connections). It enables the clear illustration of how different data entities interact, connect, and influence one another within complex datasets.
A graph is a visual representation that displays relationships and connections between data points using a structured system of nodes (also called vertices) and edges (also called links or connections). In data visualization, graphs transform abstract relationship data into intuitive visual formats that reveal patterns, dependencies, and network structures that would be difficult to discern from raw data tables. The fundamental purpose of a graph is to make complex interconnections immediately comprehensible, enabling analysts, decision-makers, and researchers to understand how different entities relate to, influence, and depend upon one another. Graphs have become indispensable tools across industries—from social network analysis and supply chain mapping to pharmaceutical research and AI monitoring platforms—because they translate relational complexity into visual clarity.
The concept of using visual representations to show relationships dates back centuries, but modern graph visualization emerged from graph theory, a mathematical discipline formalized in the 18th century by Leonhard Euler. Euler’s famous “Seven Bridges of Königsberg” problem established the foundational principles of how networks could be mathematically analyzed and visually represented. However, practical graph visualization remained limited until the digital age, when computational power made it feasible to render thousands or millions of interconnected nodes in real time. The evolution accelerated dramatically in the 21st century with the rise of social networks, knowledge graphs, and big data analytics. Today, the global enterprise data visualization platform market was valued at $8.8 billion in 2024 and is projected to grow at a compound annual growth rate of 14.1% between 2025 and 2034, with graph-based visualizations representing a significant portion of this growth. The enterprise knowledge graph market specifically is experiencing explosive growth, projected to expand at a 24.3% CAGR from 2025 to 2029, reflecting the increasing recognition of graphs’ value in capturing complex business relationships.
Track how AI chatbots mention your brand across ChatGPT, Perplexity, and other platforms.
Understanding graphs requires familiarity with their fundamental building blocks. Nodes (vertices) are the individual entities or data points within a graph, typically represented as circles, dots, or other shapes. Each node can contain properties or attributes that describe the entity it represents—for example, a person’s name, age, or role in an organizational graph. Edges (links, connections, or relationships) are the lines or arrows connecting nodes, representing the relationships between entities. Edges can be directed (showing a one-way relationship with an arrow pointing from source to target) or undirected (showing a mutual or bidirectional relationship). In many advanced graph implementations, edges themselves carry properties—such as relationship type, strength, or weight—that provide additional context about the connection. For instance, in a customer relationship graph, an edge might be labeled “purchased from” with a weight indicating the transaction value. This dual-layer structure of nodes with properties and edges with attributes creates a rich, multidimensional representation of data relationships that simple tables cannot achieve.
| Graph Type | Primary Use Case | Node Representation | Edge Representation | Best For |
|---|---|---|---|---|
| Network Diagram | Social connections, organizational structures | People, organizations, entities | Relationships, connections | Identifying influencers, network clusters |
| Tree Diagram | Hierarchical data, organizational charts | Categories, departments, items | Parent-child relationships | Showing organizational hierarchies, taxonomies |
| Chord Diagram | Many-to-many relationships | Categories, groups | Flows between categories | Visualizing complex interconnections |
| Sankey Diagram | Flow and movement of resources | Starting/ending points | Flow paths with magnitude | Customer journeys, energy flows, supply chains |
| Force-Directed Graph | Complex relationship networks | Any entities | Any relationships | Discovering natural clusters and communities |
| Knowledge Graph | Semantic relationships, AI systems | Concepts, entities, topics | Semantic relationships | AI training, recommendation systems, search |
| Bipartite Graph | Two distinct entity types | Two categories of nodes | Connections between categories | User-product interactions, author-publication |
Get the latest insights on AI mentions, brand monitoring, and optimization strategies.
From a technical perspective, graphs are implemented as data structures consisting of a set of nodes and a set of edges that define connections between those nodes. In computer science, graphs can be represented in multiple ways: adjacency matrices (a 2D array showing which nodes connect to which), adjacency lists (a list for each node showing its connected neighbors), or edge lists (a simple list of all connections). The choice of representation affects computational efficiency and memory usage. Directed graphs (digraphs) have edges with direction, meaning a relationship flows from one node to another—useful for representing hierarchies, workflows, or causal relationships. Undirected graphs have edges without direction, representing mutual or symmetric relationships like friendships or partnerships. Weighted graphs assign numerical values to edges, representing relationship strength, distance, cost, or frequency. Cyclic graphs contain loops where you can traverse from a node back to itself through a series of edges, while acyclic graphs (like trees) have no such loops. Understanding these structural variations is essential for selecting the appropriate graph type for specific analytical tasks and for optimizing query performance in graph databases.
In modern business intelligence environments, graphs have become essential tools for revealing insights hidden within relational data. Business intelligence professionals use graphs to visualize customer networks, identify high-value relationships, map supply chain dependencies, and detect anomalies or fraud patterns. The ability to see relationships visually accelerates decision-making: research shows that visual data representations reduce time to value, allowing key decision-makers to quickly comprehend patterns, trends, and relationships. In financial services, graphs reveal transaction networks and money flows that might indicate fraud. In healthcare, graphs connect patients, treatments, symptoms, and outcomes to support clinical research and drug discovery. In retail, graphs map customer purchase patterns and product affinities to drive recommendation engines. The Knowledge Graph Analytics Platform (KGAP) developed by Indiana University researchers demonstrates this principle: by representing biomedical data as a graph rather than traditional relational tables, researchers could identify drug-gene relationships for Parkinson’s Disease research in a single query that would have required complex SQL joins and months of processing time on traditional systems.
The landscape of graph visualization tools has expanded dramatically to meet diverse analytical needs. Gephi is an open-source, desktop-based platform specializing in network visualization and analysis, offering advanced styling controls and high-resolution export capabilities. Neo4j combines graph database functionality with visualization, enabling organizations to store, query, and visualize complex relationship networks at scale. Flourish provides web-based, interactive network graph creation without requiring coding expertise. D3.js is a powerful JavaScript library for creating custom, highly interactive graph visualizations for web applications. Cypher, Neo4j’s query language, uses pictorial syntax that mirrors graph structure itself—for example, (node1)-[:RELATIONSHIP]->(node2) visually represents the relationship being queried. These tools democratize graph visualization, making it accessible to analysts without deep programming expertise while still offering advanced capabilities for data scientists and engineers. The choice of tool depends on data volume, required interactivity, integration needs, and whether the primary goal is exploration, analysis, or communication.
For platforms like AmICited, which monitors brand and domain appearances across AI systems, graphs provide the ideal visualization framework. When a brand appears in responses from ChatGPT, Perplexity, Google AI Overviews, and Claude, these appearances can be represented as nodes, with edges showing relationships like co-mentions, citation patterns, or contextual associations. A graph visualization immediately reveals: which AI platforms mention your brand most frequently, which domains are cited alongside yours, how your brand’s visibility compares to competitors, and whether your mentions are increasing or decreasing over time. This graph-based approach transforms raw monitoring data into actionable intelligence. Organizations can identify which AI systems are most important for their visibility, understand the context in which they’re mentioned, and track how their AI presence evolves. The relational nature of graphs makes them particularly valuable for understanding the interconnected landscape of AI responses, where a single query might trigger mentions across multiple platforms with varying contexts and relationships.
The future of graph visualization is being shaped by several converging trends. AI-driven graph analysis is becoming increasingly sophisticated, with machine learning algorithms automatically detecting communities, predicting missing relationships, and recommending relevant connections. 3D and immersive graph visualization is emerging as computational power increases, enabling exploration of ultra-complex networks in virtual and augmented reality environments. Real-time graph processing is becoming standard, allowing organizations to visualize and analyze streaming data as relationships form and evolve. Graph-AI integration is deepening, with knowledge graphs becoming central to large language models and generative AI systems—platforms like AmICited leverage this integration to track how AI systems reference and relate different entities. Federated graph systems are enabling organizations to query and visualize relationships across multiple data sources and platforms without centralizing data. The convergence of graph technology with natural language processing is making graph creation and querying more accessible through conversational interfaces. As data becomes increasingly interconnected and relationship-driven, graphs will transition from specialized analytical tools to fundamental infrastructure for data management and AI systems. Organizations that master graph visualization and analysis will gain significant competitive advantages in understanding complex systems, detecting emerging patterns, and making relationship-informed decisions in an increasingly connected world.
Start tracking how AI chatbots mention your brand across ChatGPT, Perplexity, and other platforms. Get actionable insights to improve your AI presence.
Discover what knowledge graphs are, how they work, and why they're essential for modern data management, AI applications, and business intelligence.
Data visualization is the graphical representation of data using charts, graphs, and dashboards. Learn how visual data transforms complex information into actio...
Learn what charts are, their types, and how they transform raw data into actionable insights. Essential guide to data visualization formats for analytics and re...
Cookie Consent
We use cookies to enhance your browsing experience and analyze our traffic. See our privacy policy.