Leading vs Lagging AI Visibility Indicators
Learn the difference between leading and lagging AI visibility indicators. Discover which metrics predict future AI citations and which prove actual impact on y...
8 min read
Historical metrics that measure past AI visibility performance, including actual citations received, traffic from AI sources, and conversions. These metrics confirm what has already happened and validate the effectiveness of AI visibility strategies by providing objective proof of business impact.
Historical metrics that measure past AI visibility performance, including actual citations received, traffic from AI sources, and conversions. These metrics confirm what has already happened and validate the effectiveness of AI visibility strategies by providing objective proof of business impact.
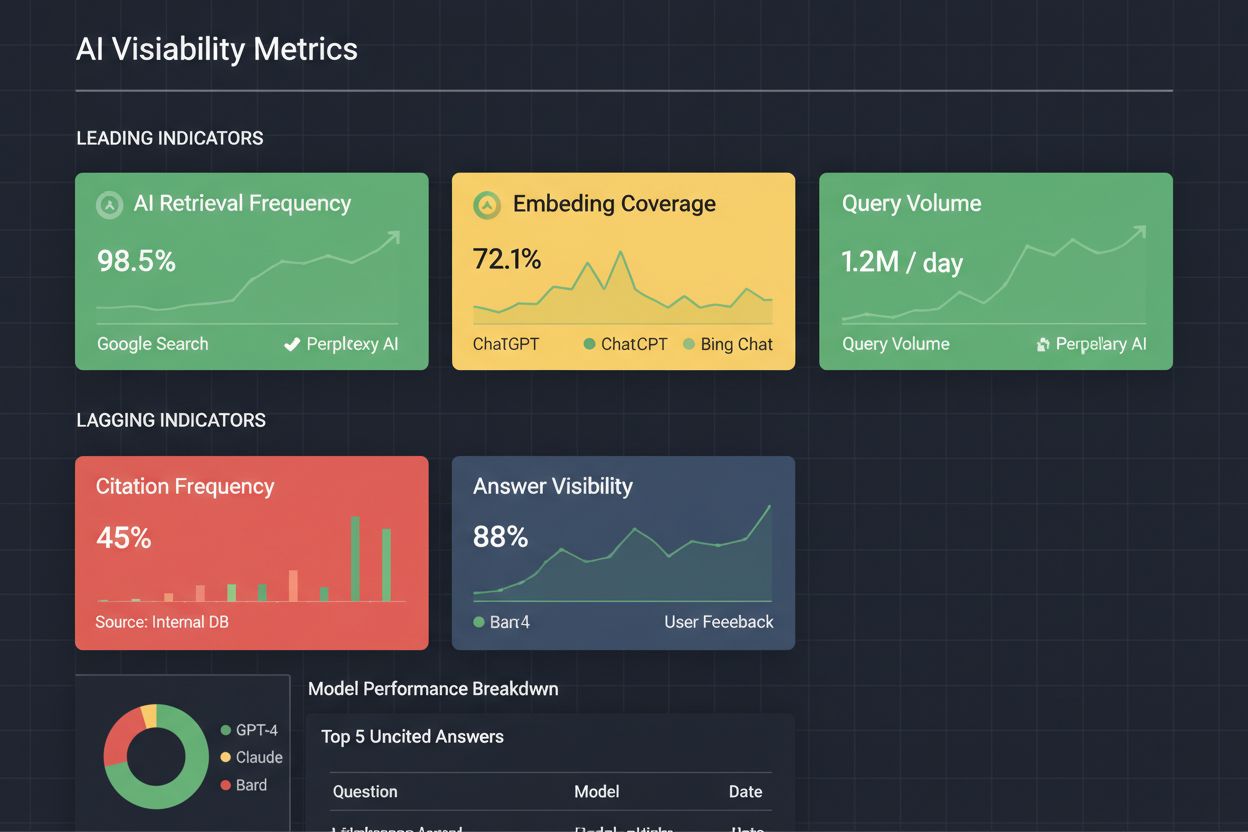
Lagging AI indicators are historical metrics that measure past performance in your brand’s visibility across AI-powered platforms like ChatGPT, Perplexity, and Google AI Overviews. Unlike forward-looking metrics, lagging indicators confirm what has already happened—they show actual citations received, real traffic from AI sources, and genuine conversions that resulted from AI visibility. These metrics provide concrete evidence of your AI visibility strategy’s effectiveness, answering the critical question: “Did our efforts actually work?” By tracking lagging indicators, you gain objective proof of past performance and can validate whether your AI visibility investments delivered measurable business results.
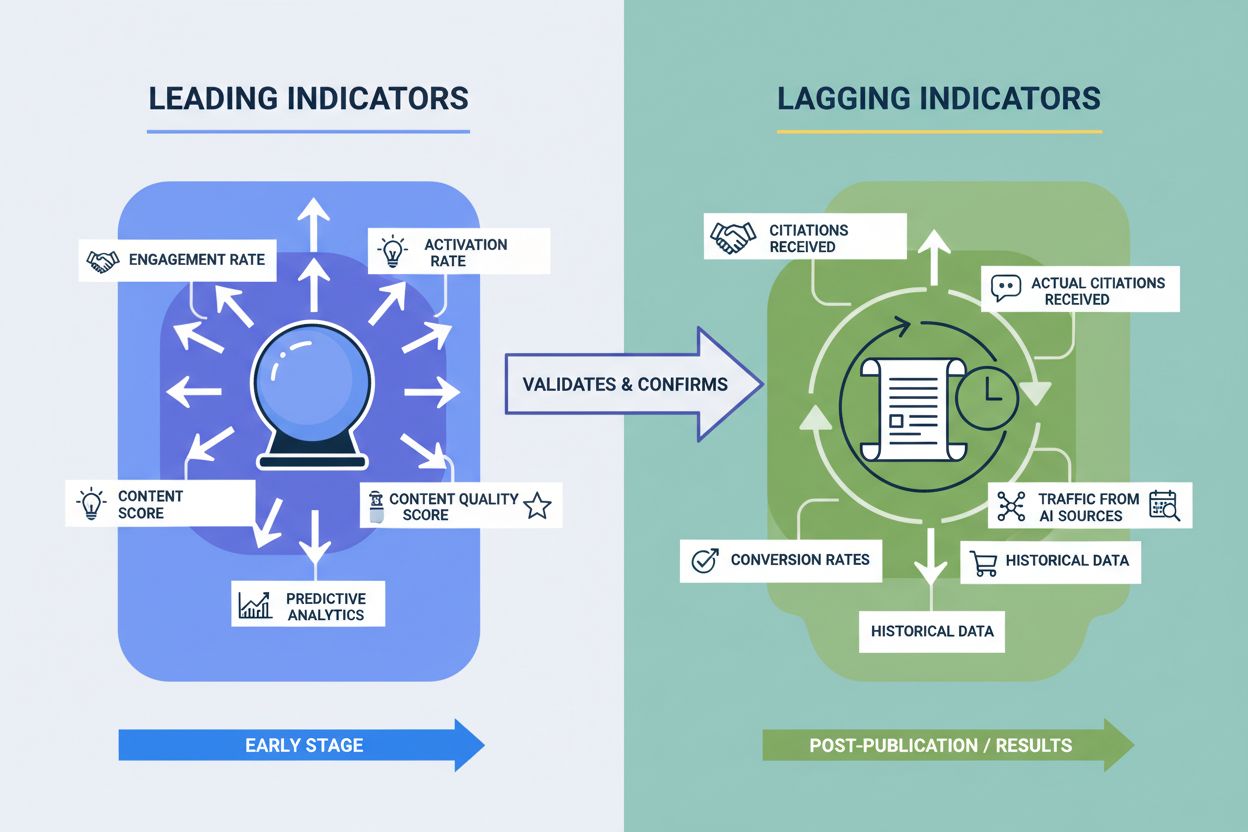
Understanding the relationship between lagging and leading indicators is essential for building a comprehensive AI visibility strategy. While leading indicators predict future outcomes, lagging indicators confirm what already happened.
| Aspect | Lagging Indicators | Leading Indicators |
|---|---|---|
| Definition | Measure past outcomes and confirmed results | Predict future performance and outcomes |
| Time Frame | Historical data (weeks, months, quarters past) | Real-time or near-real-time data |
| Predictive Value | Confirms what happened; validates strategy | Signals what will likely happen next |
| Examples | Citations received, AI traffic, conversions | Content engagement, activation rate, brand mentions |
| Use Case | Measure ROI, validate strategy, report results | Guide daily actions, adjust tactics, prevent problems |
Lagging indicators serve as the validation layer for your leading indicator strategy. If your leading indicators (like content engagement) are strong but your lagging indicators (like actual citations) are weak, you’ve identified a critical gap. Conversely, strong lagging indicators confirm that your leading indicator strategy is working. The most effective AI visibility programs track both simultaneously, using leading indicators to guide decisions and lagging indicators to measure actual business impact.
The following seven metrics represent the most important lagging indicators for measuring AI visibility performance:
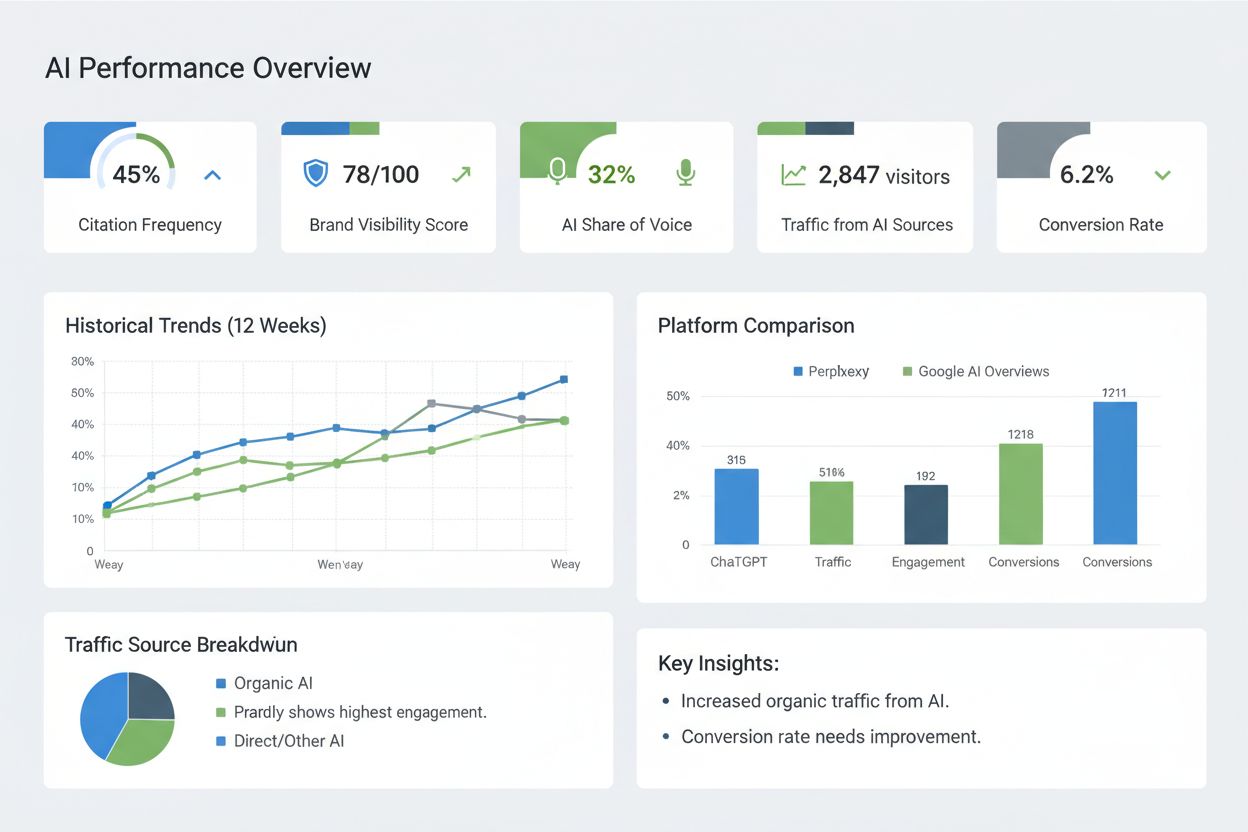
Citation Frequency: The actual number of times your brand, content, or website was cited in AI-generated responses across all platforms during a specific period. This metric answers: “How often did AI systems actually mention us?” Higher citation frequency indicates stronger brand recognition within AI models. Track this weekly to spot trends and identify which content types earn the most citations.
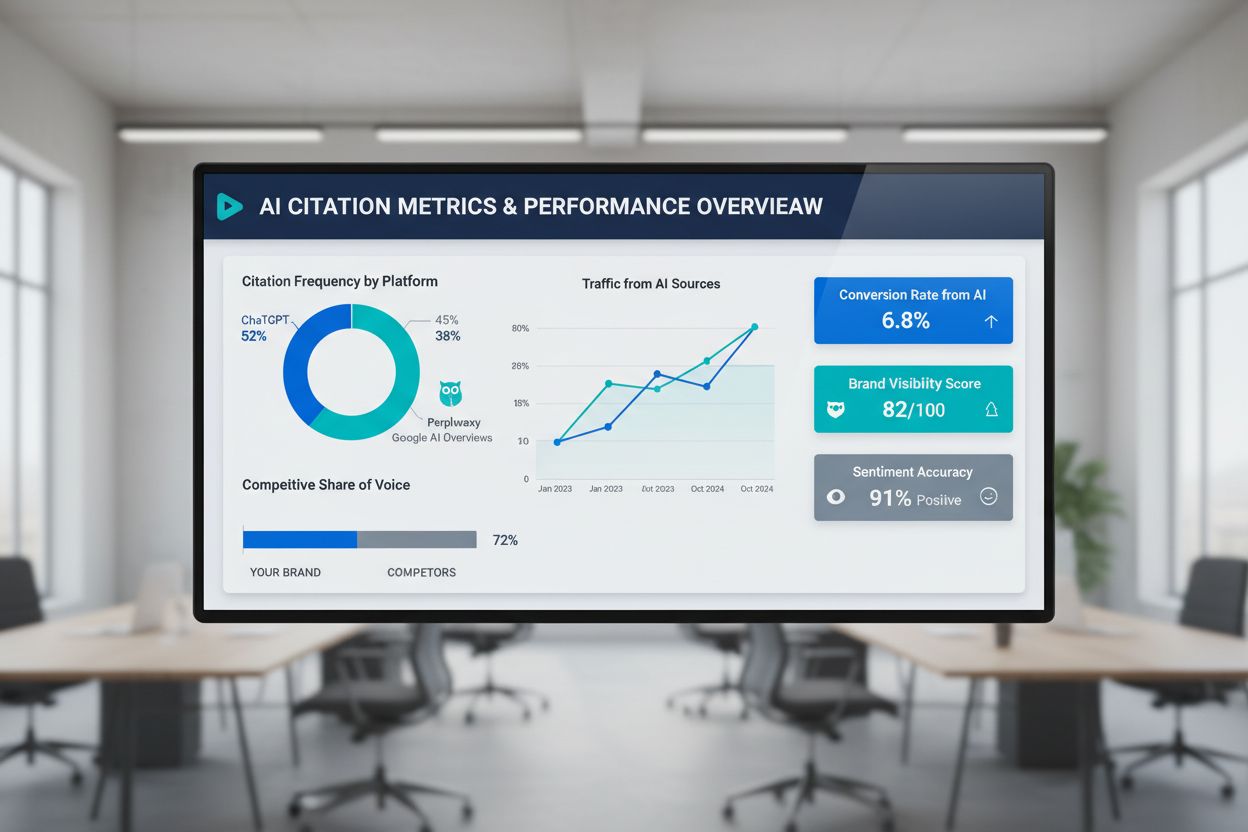
Brand Visibility Score (BVS): A composite metric combining citation frequency, citation placement (lead mention vs. footnote), link presence, and sentiment weight. This score normalizes multiple factors into a single trackable number, typically ranging from 0-100. A BVS of 75+ indicates strong, consistent visibility across AI platforms. This metric matters because not all citations are equal—a headline mention carries more weight than a buried footnote.
AI Share of Voice (AI SOV): Your brand’s percentage of total citations in your category compared to competitors. If your brand receives 25 citations while competitors receive 75 total citations, your AI SOV is 25%. This metric reveals competitive positioning in AI-generated answers. Brands with higher AI SOV typically see better conversion rates because they’re positioned as category leaders.
Traffic from AI Sources: The actual number of visitors arriving at your website from AI platforms (ChatGPT, Perplexity, Claude, Google AI Overviews, etc.). This is tracked through GA4 by creating custom channel groupings for AI referrers. Unlike traditional organic traffic, AI-referred visitors typically arrive pre-informed and pre-qualified, making this traffic exceptionally valuable.
Conversion Rate from AI Traffic: The percentage of AI-referred visitors who complete a desired action (signup, purchase, demo request, etc.). Research shows AI-referred visitors convert at 4.4x the rate of traditional organic search visitors. If you receive 1,000 AI visitors and 68 convert, your AI conversion rate is 6.8%—significantly higher than typical organic conversion rates of 1-2%.
Content Citation Rate: The percentage of your published content that actually gets cited by AI systems. If you’ve published 50 pieces of content and AI systems cite 12 of them, your content citation rate is 24%. This metric identifies which content types, topics, and formats AI systems prefer. High-performing content typically includes statistics, clear answer blocks, and comprehensive topic coverage.
Sentiment Accuracy: How accurately AI systems describe your brand when they mention it. This measures whether AI-generated descriptions align with your actual positioning, features, and value proposition. Positive sentiment indicates AI systems describe your brand favorably; negative sentiment suggests misrepresentation or outdated information. Aim for 70%+ positive sentiment across all platforms.
Lagging indicators serve four critical functions in your AI visibility strategy. First, they validate strategy effectiveness. Leading indicators might show strong engagement with your content, but only lagging indicators confirm whether that engagement translated into actual citations and traffic. This validation is essential for justifying continued investment in AI visibility efforts.
Second, they measure ROI objectively. When you track actual citations received, traffic from AI sources, and conversions from AI visitors, you can calculate precise return on investment. If you invest $5,000 monthly in AI visibility optimization and generate $50,000 in revenue from AI-referred customers, your ROI is 900%—a compelling business case for continued investment.
Third, they provide accountability. Lagging indicators create objective, measurable proof of performance. Rather than relying on vanity metrics or predictions, you can point to actual citations, real traffic, and genuine conversions. This accountability is crucial when reporting to executives, justifying budgets, or evaluating team performance.
Fourth, they establish historical context. By tracking lagging indicators over time, you build a historical record of what worked and what didn’t. This context helps you understand seasonal patterns, identify which content types earn citations, and recognize which competitors consistently outperform you. This historical perspective informs future strategy and prevents repeating unsuccessful approaches.
Multiple tools exist for tracking lagging AI indicators, each with different strengths and price points:
| Tool | Starting Price | Key Features | Best For |
|---|---|---|---|
| AmICited.com | Custom pricing | Real-time AI citation tracking across ChatGPT, Perplexity, Google AI Overviews; sentiment analysis; competitive benchmarking; traffic attribution | Brands serious about AI visibility; comprehensive monitoring |
| Otterly.ai | $29/month | Brand Visibility Index; automated link tracking; conversational keyword research; Semrush integration | Marketing teams wanting strong visualization and reporting |
| Promptmonitor | $29/month | Multi-model tracking; AI crawler analytics; source discovery; 1-3 years historical data | SMBs and agencies wanting enterprise features at accessible prices |
| Semrush AI Toolkit | $99/month | Integrates with existing Semrush workflow; sentiment analysis; competitor tracking (up to 50 competitors) | Teams already invested in Semrush ecosystem |
To measure lagging indicators effectively, set up GA4 custom channel grouping to capture AI referral traffic. Create a custom channel that includes these referrers: chatgpt.com, perplexity.ai, claude.ai, you.com, gemini.google.com, copilot.microsoft.com. This configuration allows you to track AI-referred traffic separately from traditional organic search, enabling accurate conversion rate measurement and ROI calculation.
Example 1: E-commerce Company Tracking Citation Frequency A mid-market e-commerce brand selling project management tools tracked citation frequency across AI platforms for 12 weeks. In week 1, they appeared in 18% of AI responses for “best project management software” queries. By week 12, through content optimization and strategic positioning, they increased citation frequency to 42%. This 24-point increase translated to 3,200 additional AI-referred visitors monthly and $180,000 in incremental revenue from AI sources.
Example 2: SaaS Company Measuring AI Traffic Conversion A B2B SaaS company discovered that visitors arriving from Perplexity converted at 8.2%, compared to their traditional organic conversion rate of 1.9%. By analyzing this lagging indicator, they realized AI-referred visitors were significantly more qualified. They increased investment in AI visibility optimization, growing AI-referred traffic from 400 monthly visitors to 2,100 monthly visitors. This 425% increase in AI traffic, combined with the 8.2% conversion rate, generated $320,000 in additional annual revenue.
Example 3: B2B Company Monitoring Competitive Share of Voice A B2B software company tracked AI Share of Voice against three primary competitors. In month 1, they held 18% AI SOV while competitors held 82% combined. By month 6, through targeted content creation and citation optimization, they increased their AI SOV to 31% while competitors’ combined SOV dropped to 69%. This competitive gain correlated with a 45% increase in qualified leads from AI-referred sources and a 28% improvement in brand awareness metrics.
Establish a baseline measurement before implementing any AI visibility strategy. Document your current citation frequency, AI traffic volume, and conversion rates. This baseline enables accurate measurement of improvement over time.
Track consistently on a weekly schedule for high-priority metrics like citation frequency and AI traffic. Consistency reveals trends and prevents misinterpreting short-term fluctuations as meaningful changes.
Compare against competitors using the same metrics and prompts. Competitive benchmarking reveals whether your improvements are outpacing the market or falling behind.
Monitor sentiment alongside volume metrics. A 50% increase in citations means little if 80% of those mentions are negative. Track sentiment to ensure visibility gains are positive visibility gains.
Segment by AI platform rather than treating all AI traffic as identical. ChatGPT visitors may convert differently than Perplexity visitors. Platform-specific tracking reveals which AI sources drive the highest-quality traffic.
Calculate conversion value by multiplying AI traffic volume by conversion rate by average customer value. This calculation transforms abstract metrics into concrete revenue impact.
Review lagging indicators monthly to validate leading indicator strategy. If leading indicators are strong but lagging indicators are weak, investigate the disconnect.
Document content performance by tracking which specific pages and content pieces generate citations. This identifies high-performing content types worth replicating.
Set realistic targets based on your industry, competition level, and current baseline. A 10% monthly improvement in citation frequency is ambitious; a 2-3% monthly improvement is realistic and sustainable.
Communicate results to stakeholders using lagging indicators as proof of strategy effectiveness. Executives understand revenue impact and conversion rates better than abstract engagement metrics.
Ignoring context and external factors: A sudden drop in AI citations might result from an AI model update, not from your strategy failure. Always investigate context before drawing conclusions. External factors like competitor actions, platform algorithm changes, or market shifts influence lagging indicators.
Over-relying on single metrics: Citation frequency alone doesn’t tell the complete story. A brand might receive many citations but with poor sentiment or low conversion rates. Always evaluate multiple lagging indicators together for a complete picture.
Comparing to wrong benchmarks: Comparing your AI SOV to a competitor in a different market segment is meaningless. Benchmark against direct competitors in your specific category and market segment.
Expecting immediate results: Lagging indicators measure past performance, so improvements take time to materialize. Expect 4-8 weeks before seeing meaningful changes in citation frequency and 8-12 weeks before seeing traffic and conversion improvements.
Neglecting to track competitor changes: If competitors improve faster than you, your relative position declines even if your absolute metrics improve. Always track competitive metrics alongside your own performance.
Misattributing causation: A correlation between two metrics doesn’t prove causation. Just because citations increased after you published new content doesn’t mean the new content caused the increase. Use controlled testing to establish causation.
Forgetting to adjust for seasonality: Many businesses experience seasonal fluctuations in AI visibility. Compare month-to-month or year-over-year rather than week-to-week to account for seasonal patterns.
Treating all traffic equally: AI-referred traffic from a high-intent query like “best CRM for enterprise” is more valuable than traffic from a low-intent query like “what is CRM.” Segment traffic by intent level to understand true value.
Lagging AI indicators are historical metrics that measure past performance in your brand's visibility across AI platforms like ChatGPT, Perplexity, and Google AI Overviews. They include actual citations received, traffic from AI sources, conversion rates, and brand visibility scores. Unlike leading indicators that predict future performance, lagging indicators confirm what has already happened and provide objective proof of strategy effectiveness.
Lagging indicators measure past outcomes (citations received, traffic, conversions), while leading indicators predict future performance (engagement rates, activation rates, content quality). Leading indicators guide daily actions; lagging indicators validate strategy effectiveness. The most effective AI visibility programs track both simultaneously—using leading indicators to guide decisions and lagging indicators to measure actual business impact.
The seven core lagging indicators are: Citation Frequency (how often you're mentioned), Brand Visibility Score (composite metric of visibility quality), AI Share of Voice (your percentage of category mentions), Traffic from AI Sources (actual visitors), Conversion Rate from AI Traffic (percentage converting), Content Citation Rate (which content gets cited), and Sentiment Accuracy (how positively you're described). Track these metrics weekly or monthly depending on your traffic volume.
Expect 4-8 weeks before seeing meaningful changes in citation frequency after implementing optimization strategies. Traffic and conversion improvements typically appear within 8-12 weeks. The timeline depends on your content quality, optimization effectiveness, and competitive landscape. Consistent, sustained effort produces better results than sporadic optimization attempts.
Calculate AI visibility ROI by dividing revenue generated from AI-referred customers by your total AI visibility investment (tools, content creation, optimization). For example, if you invest $5,000 monthly and generate $50,000 in revenue from AI sources, your ROI is 900%. Research shows AI-referred visitors convert at 4.4x the rate of traditional organic search, making AI visibility a high-ROI investment when properly measured.
AmICited.com specializes in real-time AI citation tracking across ChatGPT, Perplexity, and Google AI Overviews with sentiment analysis and competitive benchmarking. Other options include Otterly.ai ($29/month) for visualization, Promptmonitor ($29/month) for comprehensive platform coverage, and Semrush AI Toolkit ($99/month) for teams already using Semrush. Choose based on your budget, required features, and integration needs.
Review high-priority lagging indicators (citation frequency, AI traffic) weekly to spot trends and identify issues early. Review conversion rates and sentiment monthly to understand quality of visibility. Conduct comprehensive competitive analysis quarterly to assess relative positioning. Weekly reviews enable quick tactical adjustments; monthly and quarterly reviews inform strategic decisions.
Lagging indicators measure past performance, not future performance. However, historical lagging indicator trends can inform predictions. If your citation frequency has grown 5% monthly for six months, you might project similar growth next month. Combine lagging indicator trends with leading indicators (engagement, activation) for more accurate predictions. Leading indicators predict what will happen; lagging indicators confirm what did happen.
Track actual citations, traffic, and conversions from ChatGPT, Perplexity, and Google AI Overviews. Get real-time insights into your AI visibility performance and competitive positioning.
Learn the difference between leading and lagging AI visibility indicators. Discover which metrics predict future AI citations and which prove actual impact on y...
Learn what leading AI indicators are and how predictive metrics like content freshness and source authority forecast future AI visibility changes. Discover how ...
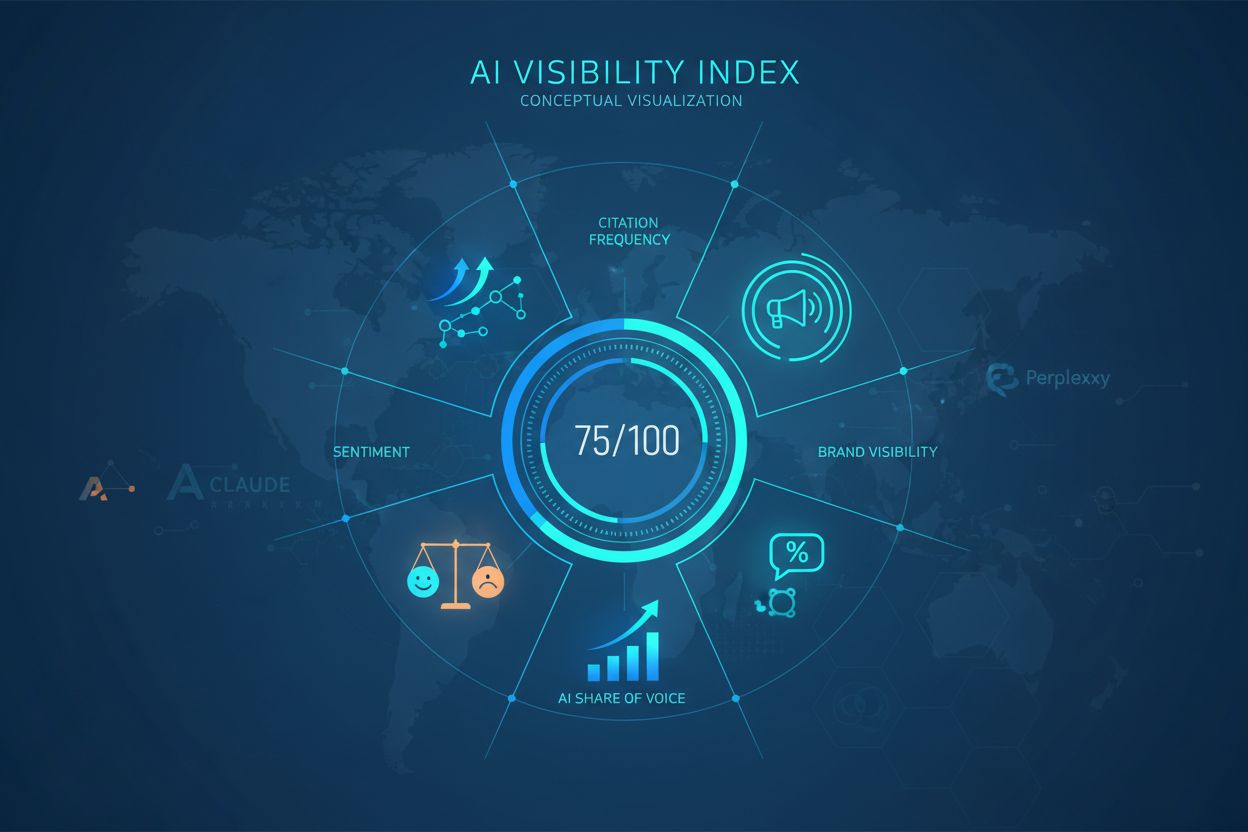
Learn what an AI Visibility Index is, how it combines citation rate, position, sentiment, and reach metrics, and why it matters for brand visibility in ChatGPT,...
Cookie Consent
We use cookies to enhance your browsing experience and analyze our traffic. See our privacy policy.