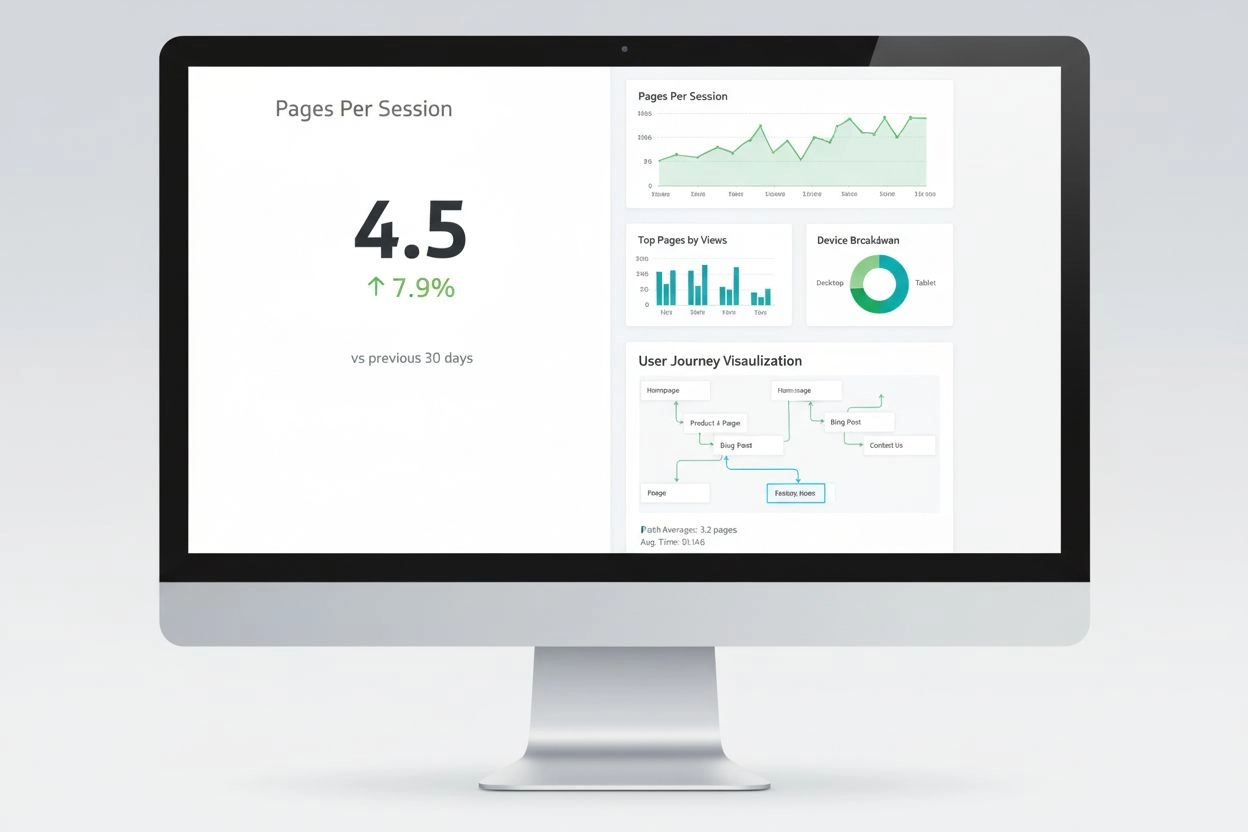
Pages Per Session
Pages Per Session measures average pages viewed per visit. Learn how this engagement metric impacts user behavior, conversion rates, and SEO performance with in...
12 min read
Session duration is the total amount of time a user spends on a website or application during a single visit, measured from their first interaction until they leave or become inactive. This metric is a critical indicator of user engagement and content effectiveness, helping website owners understand how well their site retains visitor attention and delivers value.
Session duration is the total amount of time a user spends on a website or application during a single visit, measured from their first interaction until they leave or become inactive. This metric is a critical indicator of user engagement and content effectiveness, helping website owners understand how well their site retains visitor attention and delivers value.
Session duration, also known as time on site or session length, is the total amount of time a user spends on a website or application during a single visit. This metric is calculated by measuring the time elapsed from when a visitor first lands on a page until they leave the site or become inactive. Session duration is one of the most fundamental engagement metrics in web analytics, providing critical insights into how well a website captures and maintains visitor attention. Unlike simple traffic metrics that only count the number of visitors, session duration reveals the quality of user engagement and the effectiveness of content in delivering value to your audience.
The importance of session duration extends beyond simple curiosity about user behavior. This metric directly influences business outcomes, search engine rankings, and strategic decisions about website optimization. When visitors spend more time on a site, it typically indicates they find the content relevant, the user experience satisfactory, and the website valuable enough to warrant extended exploration. Conversely, very short session durations may signal that visitors are not finding what they need, encountering usability issues, or being distracted by poor design or slow performance. Understanding and optimizing session duration has become essential for digital marketers, web developers, and business owners seeking to improve their online presence.
The concept of session duration emerged as web analytics evolved from simple page view counting to more sophisticated user behavior analysis. In the early days of the internet, website owners could only track how many people visited their sites. As analytics technology advanced, particularly with the introduction of tools like Google Analytics, the ability to measure how long users spent on websites became a game-changer for understanding user engagement. The metric gained prominence because it provided a more nuanced view of website performance than raw traffic numbers alone.
Over the past two decades, session duration has become a standard KPI (Key Performance Indicator) across industries. According to recent data from Databox, the median average session duration across all industries in 2024 was approximately 2 minutes and 38 seconds, though this varies significantly by sector. For B2B companies specifically, the median session duration is 77.61 seconds, while B2C websites typically see longer sessions. These benchmarks have become reference points for website owners evaluating their performance and setting realistic improvement goals. The evolution of session duration tracking has paralleled the growth of digital marketing, with the metric becoming increasingly sophisticated as analytics platforms integrate machine learning and AI-driven insights.
The calculation of session duration is straightforward in principle but requires precise tracking in practice. The fundamental formula is: Session Duration = Timestamp of Final Activity - Timestamp of First Activity. When a user lands on your website, analytics tools record the exact time of arrival. As the user navigates through pages and interacts with content, each interaction is timestamped. When the user leaves the site or becomes inactive for a specified period (typically 30 minutes in Google Analytics), the session ends, and the total duration is calculated.
However, there’s an important nuance in how session duration is calculated that many website owners overlook. The metric relies on active interactions to determine when a session ends. If a visitor lands on your site, reads an article for 10 minutes, but doesn’t click any links or perform any other tracked actions, that final page’s time may not be fully captured in the session duration calculation. This is because analytics systems need a “ping” or interaction event to signal that the user has moved on. To get a more accurate picture of session duration, websites track user interactions such as clicking links, filling out forms, watching videos, scrolling, or using interactive tools. These interactions help analytics systems understand not just how long visitors stay, but how they engage with content.
The average session duration is calculated by dividing the total duration of all sessions within a time period by the number of sessions during that period. For example, if your website had 100 sessions totaling 500 minutes in a day, your average session duration would be 5 minutes. This calculation is typically automated by analytics platforms like Google Analytics 4, Adobe Analytics, and other web analytics tools, which continuously track and aggregate this data in real-time dashboards.
| Metric | Definition | Scope | Use Case | Typical Range |
|---|---|---|---|---|
| Session Duration | Total time spent on website during single visit | Entire website visit | Overall engagement measurement | 2-5 minutes average |
| Time on Page | Time spent on individual page before navigation | Single page | Content effectiveness analysis | 30 seconds - 3 minutes |
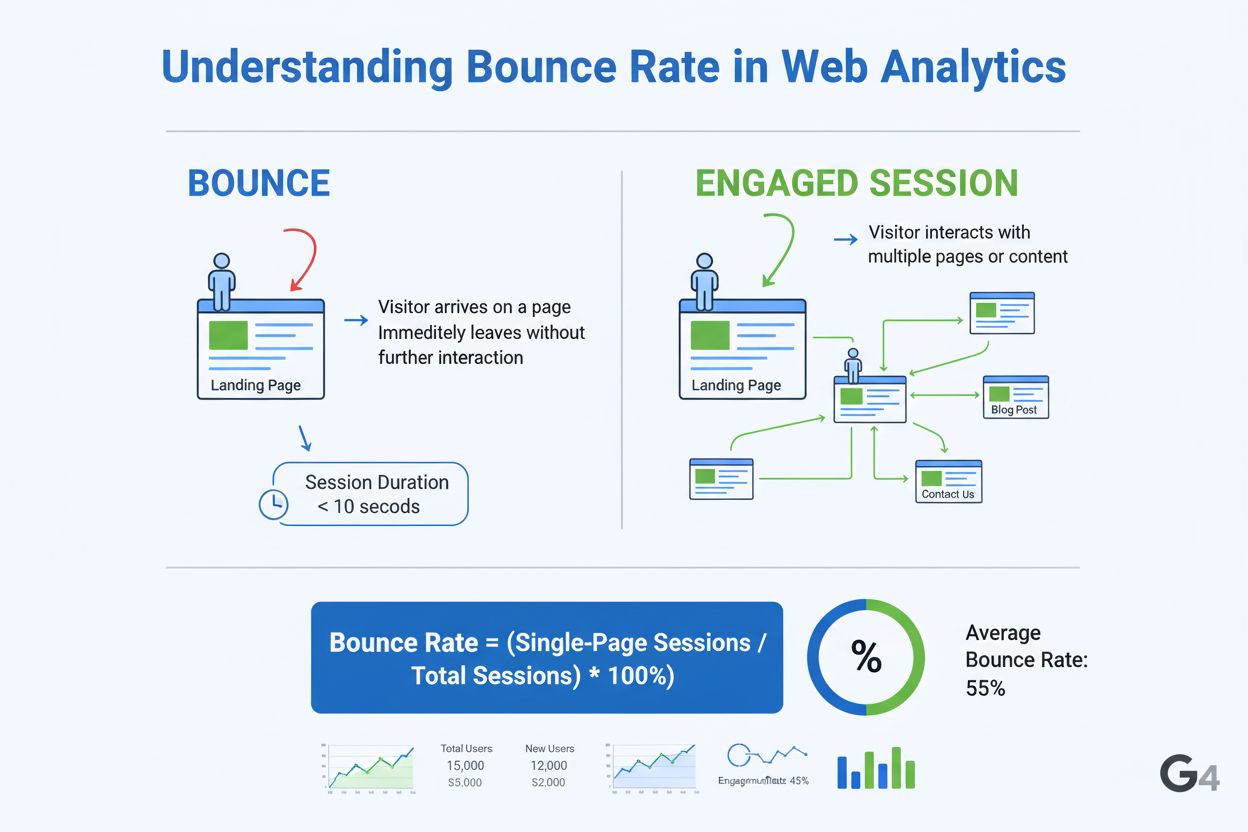
| Bounce Rate | Percentage of single-page sessions with no interaction | Single page view | Exit behavior analysis | 20-50% typical |
| Engagement Rate | Percentage of sessions with meaningful interactions | Entire session | Active engagement measurement | 40-70% typical |
| Pages per Session | Average number of pages viewed per visit | Multiple pages | Navigation depth analysis | 2-5 pages average |
| Session Interval | Time between consecutive sessions for same user | Between sessions | Return visitor behavior | Varies by industry |
| Engaged Sessions | Sessions lasting 10+ seconds with interactions/conversions | Entire session | Quality session measurement | GA4 specific metric |
Understanding the technical mechanics of session duration tracking requires knowledge of how analytics systems work. When a user visits a website, a tracking code (typically JavaScript) is loaded on the page. This code creates a unique session identifier and records the timestamp of the first page view. As the user navigates through the site, each subsequent page view or interaction event is recorded with its own timestamp. The analytics system calculates the time difference between consecutive events to determine how long the user spent on each page.
The calculation becomes more sophisticated when considering multiple pages and interactions. If a user visits Page A at 10:00 AM, then Page B at 10:03 AM, the system records that the user spent 3 minutes on Page A. If they then visit Page C at 10:08 AM, they spent 5 minutes on Page B. The total session duration would be 8 minutes (3 + 5), though the time on the final page (Page C) may not be fully captured unless there’s a subsequent interaction or the session timeout is triggered. This is why session duration can sometimes underestimate actual time spent, particularly on the last page of a session.
Modern analytics platforms have refined this calculation to account for various scenarios. Google Analytics 4, for instance, introduced the concept of engaged sessions, which are sessions lasting at least 10 seconds with one or more conversion events or two or more page views. This distinction helps separate meaningful engagement from accidental clicks or bot traffic. Additionally, analytics systems now account for different types of interactions beyond page views, including video plays, form submissions, scroll depth, and custom events, providing a more comprehensive picture of user engagement than simple page view-based calculations.
Session duration has profound implications for business success across multiple dimensions. From a user experience perspective, longer session durations generally indicate that visitors find your website intuitive, visually appealing, and content-rich. This positive user experience translates into tangible business benefits: higher conversion rates, increased customer lifetime value, and improved brand perception. Research consistently shows that visitors who spend more time on a website are significantly more likely to make purchases, sign up for services, or engage with your brand in meaningful ways.
The relationship between session duration and search engine optimization (SEO) is particularly important in today’s digital landscape. Search engines like Google use user engagement signals, including session duration, as factors in their ranking algorithms. Websites that keep visitors engaged longer are seen as providing better user experiences, which search engines reward with higher rankings. This creates a virtuous cycle: better rankings lead to more traffic, and if that traffic results in longer session durations, rankings improve further. Conversely, websites with very short session durations may be penalized in search rankings, as search engines interpret this as a signal that the site doesn’t meet user needs.
From a marketing and analytics perspective, session duration serves as a diagnostic tool for identifying problems and opportunities. If your session duration is significantly lower than industry benchmarks, it signals that something may be wrong—perhaps your content isn’t meeting visitor expectations, your website is difficult to navigate, or your pages load too slowly. By analyzing session duration alongside other metrics like bounce rate, pages per session, and conversion rate, marketers can pinpoint specific areas for improvement. Additionally, session duration data can be segmented by traffic source, device type, geographic location, and user demographics, revealing which audience segments are most engaged and which may need targeted optimization efforts.
Different analytics platforms calculate and report session duration with slight variations, which is important to understand when comparing data across tools. Google Analytics 4 (GA4) represents the current standard for website analytics and calculates session duration as the total time from the first user interaction to the last user interaction in a session. GA4 also introduced engagement time, which specifically measures active interaction time, providing a more precise measure of genuine engagement than traditional session duration.
Adobe Analytics offers more granular time spent metrics, including total seconds spent, time spent per visit, and time spent per visitor. Adobe’s approach allows for more sophisticated analysis, particularly for complex websites with multiple conversion paths. The platform calculates time spent based on explicit values including link events and video views, providing detailed insights into how users interact with specific content elements.
For e-commerce platforms and mobile applications, session duration tracking requires additional considerations. Mobile apps often have different session definitions than websites, with sessions typically ending after 30 minutes of inactivity. E-commerce platforms need to track session duration in relation to product views, cart additions, and checkout progress to understand the customer journey. Platforms like Shopify and WooCommerce integrate with analytics tools to provide session duration data alongside conversion metrics, allowing store owners to correlate time spent with purchase behavior.
Improving session duration requires a multifaceted approach that addresses both technical and content-related factors. The first step is to establish realistic benchmarks by comparing your session duration against industry standards. Different industries have vastly different expectations—a news website might have an average session duration of 1-2 minutes, while an educational platform might see 10-15 minutes. Once you understand where you stand relative to your industry, you can set specific, measurable goals for improvement.
Website performance optimization is critical for improving session duration. Slow page load times are one of the primary reasons visitors leave websites prematurely. Implementing performance optimization techniques such as image compression, content delivery networks (CDNs), browser caching, and code minification can significantly reduce load times and encourage visitors to stay longer. Tools like Google PageSpeed Insights and Jetpack Boost provide specific recommendations for improving website speed, which directly impacts session duration.
Content quality and relevance are equally important. High-quality, well-researched content that addresses visitor needs encourages longer engagement. Content should be well-structured with clear headings, bullet points, and visual elements that make it easy to scan and digest. Incorporating multimedia elements like videos, infographics, and interactive tools can significantly increase session duration by making content more engaging and interactive. Internal linking strategies that guide visitors to related content also encourage exploration and longer sessions.
The definition and application of session duration is evolving as digital experiences become more complex and AI-driven. Traditional session duration metrics were designed for linear website browsing, but modern users interact with websites in increasingly non-linear ways. Single-page applications (SPAs), progressive web apps (PWAs), and dynamic content loading mean that traditional session boundaries are becoming blurred. Analytics platforms are adapting by introducing more sophisticated engagement metrics that account for these new interaction patterns.
The rise of AI and machine learning is also transforming how session duration is understood and utilized. AI-powered analytics tools can now predict which types of content and user experiences will drive longer session durations, allowing marketers to optimize proactively rather than reactively. Additionally, as AI systems like ChatGPT, Perplexity, and Google AI Overviews become more prevalent, new forms of “session duration” are emerging—measuring how long users engage with AI-generated responses that mention your brand. This represents a fundamental shift in how businesses need to think about user engagement in the AI era.
Privacy regulations like GDPR and CCPA are also influencing how session duration is tracked and reported. First-party data collection and consent-based tracking are becoming the norm, which may affect the accuracy and completeness of session duration data. Analytics platforms are developing new approaches to measure engagement while respecting user privacy, such as aggregated reporting and privacy-preserving analytics methods. Looking forward, session duration will likely become just one component of a more comprehensive engagement measurement framework that includes behavioral signals, intent indicators, and AI-driven insights.
The integration of session duration data with other business metrics is also advancing. Modern analytics platforms are increasingly connecting session duration with revenue data, customer lifetime value, and other business outcomes, allowing organizations to understand the true business impact of engagement improvements. This shift from vanity metrics to outcome-focused metrics represents a maturation of how businesses approach analytics and optimization. As the digital landscape continues to evolve, session duration will remain a fundamental metric, but its interpretation and application will become increasingly sophisticated and integrated with broader business intelligence systems.
Session duration measures the total time a user spends on a website during a single visit, while bounce rate measures the percentage of single-page sessions where users leave without any interaction. A high bounce rate coupled with low session duration typically indicates that content is not resonating with visitors, suggesting a need for optimization. Understanding both metrics together provides a more complete picture of user engagement and website effectiveness.
Session duration is calculated by measuring the time between a user's first interaction on the website and their final activity before leaving. The formula is: Total Duration of All Sessions ÷ Total Number of Sessions. Google Analytics 4 tracks this automatically by recording timestamps of user interactions, though the last page viewed in a session may not contribute to the duration if there's no subsequent interaction recorded.
A good average session duration typically ranges from 2 to 5 minutes, indicating that visitors find the website content engaging and valuable. However, this benchmark varies significantly by industry and website type. For example, news sites may have shorter durations (1-2 minutes), while e-commerce or educational sites often see longer sessions (5-10 minutes). It's important to compare your metrics against industry-specific benchmarks rather than universal standards.
Session duration is an important user engagement signal that search engines like Google consider when ranking websites. Longer session durations suggest that visitors find the content valuable and are spending time exploring the site, which signals quality to search algorithms. Websites with higher average session durations often receive better search rankings because search engines prioritize delivering users to sites that provide positive user experiences and keep visitors engaged.
To improve session duration, focus on optimizing website speed and performance, enhancing design and navigation, creating high-quality and relevant content, ensuring mobile-friendliness, and incorporating interactive elements like videos and quizzes. Additionally, implement clear calls-to-action (CTAs), improve internal linking to encourage exploration, and regularly conduct A/B testing to identify what resonates with your audience. Reducing bounce rates through better landing page optimization also contributes to longer sessions.
Session duration measures the total time a visitor spends on your entire website during a single visit, encompassing all pages they visit. Time on page, by contrast, measures how long a visitor spends on a specific individual page before moving to another page or leaving. Session duration provides a macro-level view of overall engagement, while time on page offers a micro-level view of engagement on specific content pieces.
Session duration and conversion rates are closely correlated. Longer session durations typically indicate higher likelihood of conversions because users are spending more time engaging with content, exploring products or services, and moving through the customer journey. Visitors who spend more time on a site are generally more interested and more likely to complete desired actions like purchases, sign-ups, or form submissions. Conversely, very short sessions often result in lower conversion rates.
Traditional session duration metrics are specific to individual websites and applications. However, AI monitoring platforms like AmICited track when and how brands appear in AI-generated responses across platforms like ChatGPT, Perplexity, Google AI Overviews, and Claude. While these platforms don't measure traditional session duration, understanding how long users engage with AI responses containing your brand mentions is increasingly important for monitoring brand visibility and AI-driven traffic attribution.
Start tracking how AI chatbots mention your brand across ChatGPT, Perplexity, and other platforms. Get actionable insights to improve your AI presence.
Pages Per Session measures average pages viewed per visit. Learn how this engagement metric impacts user behavior, conversion rates, and SEO performance with in...
Bounce rate measures the percentage of visitors leaving after viewing one page. Learn how GA4 calculates it, industry benchmarks, and strategies to reduce bounc...
Dwell time measures how long users stay on a page after clicking from search results. Learn what it is, why it matters for SEO, and how to improve engagement me...
Cookie Consent
We use cookies to enhance your browsing experience and analyze our traffic. See our privacy policy.