
Chart
Learn what charts are, their types, and how they transform raw data into actionable insights. Essential guide to data visualization formats for analytics and re...
8 min read
A table is a structured data organization method that arranges information into a two-dimensional grid format consisting of horizontal rows and vertical columns, enabling efficient data storage, retrieval, and analysis. Tables form the fundamental building block of relational databases, spreadsheets, and data presentation systems, allowing users to quickly locate and compare related information across multiple dimensions.
A table is a structured data organization method that arranges information into a two-dimensional grid format consisting of horizontal rows and vertical columns, enabling efficient data storage, retrieval, and analysis. Tables form the fundamental building block of relational databases, spreadsheets, and data presentation systems, allowing users to quickly locate and compare related information across multiple dimensions.
A table is a fundamental data structure that organizes information into a two-dimensional grid format consisting of horizontal rows and vertical columns. In its most basic form, a table represents a collection of related data arranged in a structured manner where each intersection of a row and column contains a single data item or cell. Tables serve as the cornerstone of relational databases, spreadsheets, data warehouses, and virtually every system that requires organized information storage and retrieval. The power of tables lies in their ability to enable quick visual scanning, logical comparison of data across multiple dimensions, and programmatic access to specific information through standardized query languages. Whether used in business analytics, scientific research, or AI monitoring platforms, tables provide a universally understood format for presenting structured data that can be easily interpreted by both humans and machines.
The concept of organizing information into rows and columns predates modern computing by centuries. Ancient civilizations used tabular formats to record inventory, financial transactions, and astronomical observations. However, the formalization of table structures in computing emerged with the development of relational database theory by Edgar F. Codd in 1970, which revolutionized how data could be stored and queried. The relational model established that data should be organized into tables with clearly defined relationships, fundamentally changing database design principles. Throughout the 1980s and 1990s, spreadsheet applications like Lotus 1-2-3 and Microsoft Excel democratized table usage, making tabular data organization accessible to non-technical users. Today, approximately 97% of organizations use spreadsheet applications for data management and analysis, demonstrating the enduring importance of table-based data organization. The evolution continues with modern developments in columnar databases, NoSQL systems, and data lakes, which challenge traditional row-oriented approaches while still maintaining fundamental table-like structures for organizing information.
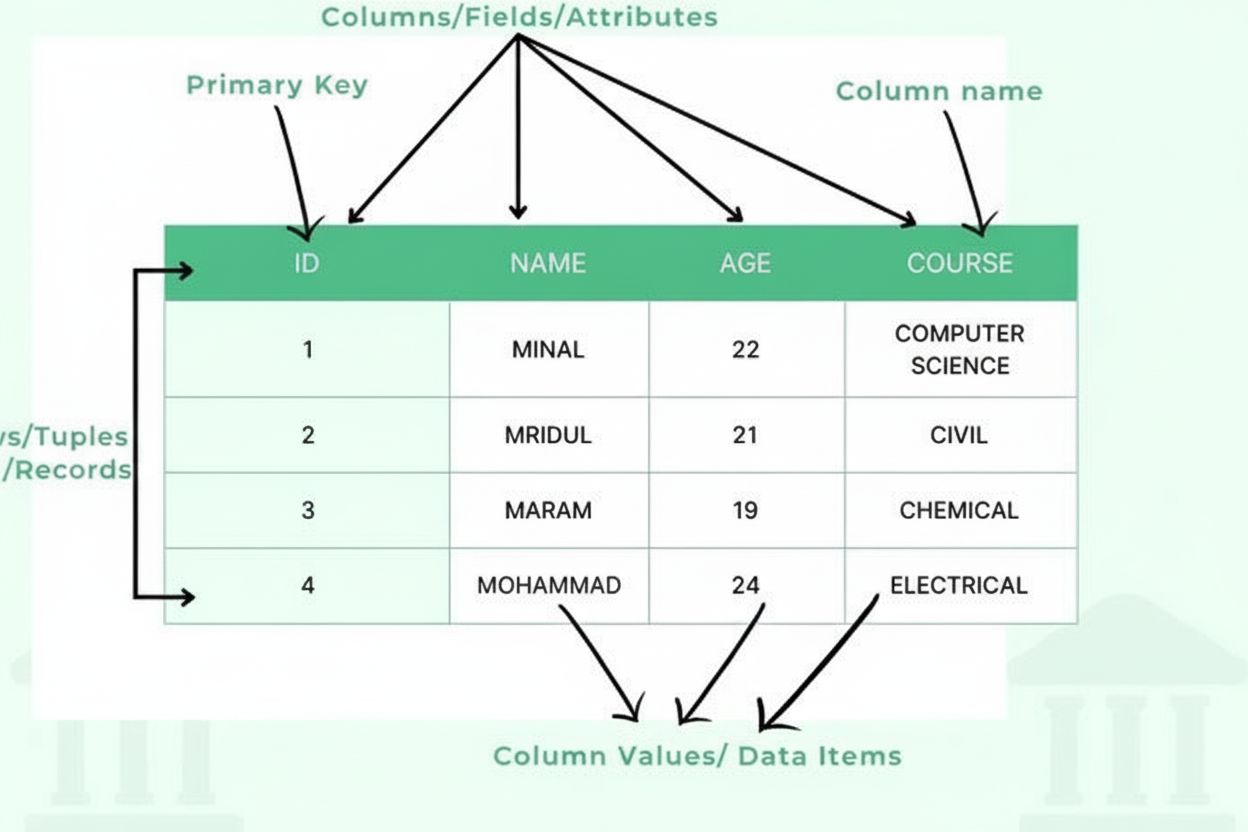
A table consists of several essential structural components that work together to create an organized data framework. Columns (also called fields or attributes) run vertically and represent categories of information, such as “Customer Name,” “Email Address,” or “Purchase Date.” Each column has a defined data type that specifies what kind of information it can contain—integers, text strings, dates, decimals, or more complex structures. Rows (also called records or tuples) run horizontally and represent individual data entries or entities, with each row containing one complete record. The intersection of a row and column creates a cell or data item, which holds a single piece of information. Column headers identify each column and appear at the top of the table, providing context for the data below. Primary keys are special columns that uniquely identify each row, ensuring no duplicate records exist. Foreign keys establish relationships between tables by referencing primary keys in other tables. This hierarchical organization enables databases to maintain data integrity, prevent redundancy, and support complex queries that retrieve information based on multiple criteria.
| Aspect | Row-Oriented Tables | Column-Oriented Tables | Hybrid Approaches |
|---|---|---|---|
| Storage Method | Data stored and accessed by complete records | Data stored and accessed by individual columns | Combines benefits of both approaches |
| Query Performance | Optimized for transactional queries retrieving full records | Optimized for analytical queries on specific columns | Balanced performance for mixed workloads |
| Use Cases | OLTP (Online Transaction Processing), business operations | OLAP (Online Analytical Processing), data warehousing | Real-time analytics, operational intelligence |
| Database Examples | MySQL, PostgreSQL, Oracle, SQL Server | Vertica, Cassandra, HBase, Parquet | Snowflake, BigQuery, Apache Iceberg |
| Compression Efficiency | Lower compression rates due to data diversity | Higher compression rates for similar column values | Optimized compression for specific patterns |
| Write Performance | Fast writes for complete records | Slower writes requiring column updates | Balanced write performance |
| Scalability | Scales well for transaction volume | Scales well for data volume and query complexity | Scales for both dimensions |
In relational database management systems (RDBMS), tables are implemented as structured collections of rows where each row conforms to a predefined schema. The schema defines the table’s structure, specifying column names, data types, constraints, and relationships. When data is inserted into a table, the database management system validates that each value matches its column’s data type and satisfies any defined constraints. For example, a column defined as INTEGER will reject text values, and a column marked as NOT NULL will reject empty entries. Indexes are created on frequently queried columns to accelerate data retrieval, functioning as organized references that allow the database to locate specific rows without scanning the entire table. Normalization is a design principle that organizes tables to minimize data redundancy and improve data integrity by breaking information into related tables connected through keys. Modern databases support transactions, which ensure that multiple operations on tables either all succeed or all fail together, maintaining consistency even during system failures. The query optimizer in database engines analyzes SQL queries and determines the most efficient way to access table data, considering available indexes and table statistics.
Tables serve as the primary mechanism for presenting structured data to users in both digital and print formats. In business intelligence and analytics applications, tables display aggregated metrics, performance indicators, and detailed transaction records that enable decision-makers to understand complex datasets at a glance. Research indicates that 83% of business professionals rely on data tables as their primary tool for analyzing information, as tables allow for precise value comparison and pattern recognition. HTML tables on websites use semantic markup with <table>, <tr> (table row), <td> (table data), and <th> (table header) elements to structure data for both visual display and programmatic interpretation. Spreadsheet applications like Microsoft Excel, Google Sheets, and LibreOffice Calc extend basic table functionality with formulas, conditional formatting, and pivot tables that enable users to perform calculations and reorganize data dynamically. Data visualization best practices recommend using tables when precise values matter more than visual patterns, when comparing multiple attributes of individual records, or when users need to perform lookups or calculations. The W3C Web Accessibility Initiative emphasizes that properly structured tables with clear headers and appropriate markup are essential for making data accessible to users with disabilities, particularly those using screen readers.
In the context of AI monitoring platforms like AmICited, tables play a critical role in organizing and presenting data about how content appears across different AI systems. Monitoring tables track metrics such as citation frequency, appearance dates, AI platform sources (ChatGPT, Perplexity, Google AI Overviews, Claude), and contextual information about how domains and URLs are referenced. These tables enable organizations to understand their brand visibility in AI-generated responses and identify trends in how different AI systems cite or reference their content. The structured nature of monitoring tables allows for filtering, sorting, and aggregation of citation data, making it possible to answer questions like “Which of our URLs appear most frequently in Perplexity responses?” or “How has our citation rate changed over the past month?” Data tables in monitoring systems also facilitate comparison across multiple dimensions—comparing citation patterns between different AI platforms, analyzing citation growth over time, or identifying which content types receive the most AI references. The ability to export monitoring data from tables into reports, dashboards, and further analysis tools makes tables indispensable for organizations seeking to understand and optimize their presence in AI-generated content.
Effective table design requires careful consideration of structure, naming conventions, and data organization principles. Column naming should use clear, descriptive identifiers that accurately reflect the data they contain, avoiding abbreviations that might confuse users or developers. Data type selection is critical—choosing appropriate types prevents invalid data entry and enables proper sorting and comparison operations. Primary key definition ensures each row can be uniquely identified, which is essential for data integrity and establishing relationships with other tables. Normalization reduces data redundancy by organizing information into related tables rather than storing duplicate data across multiple locations. Indexing strategy should balance query performance against the overhead of maintaining indexes during data modifications. Documentation of table structure, including column definitions, data types, constraints, and relationships, is essential for long-term maintainability. Access control should be implemented to ensure that sensitive data in tables is protected from unauthorized access. Performance optimization involves monitoring query execution times and adjusting table structures, indexes, or queries to improve efficiency. Backup and recovery procedures must be established to protect table data against loss or corruption.
The future of table-based data organization is evolving to meet increasingly complex data requirements while maintaining the fundamental principles that make tables effective. Columnar storage formats like Apache Parquet and ORC are becoming standard in big data environments, optimizing tables for analytical workloads while maintaining tabular structure. Semi-structured data in JSON and XML formats is increasingly stored within table columns, allowing tables to accommodate both structured and flexible data. Machine learning integration is enabling databases to automatically optimize table structures and query execution based on usage patterns. Real-time analytics platforms are extending tables to support streaming data and continuous updates, moving beyond traditional batch-oriented table operations. Cloud-native databases are redesigning table implementations to leverage distributed computing, enabling tables to scale across multiple servers and geographic regions. Data governance frameworks are placing greater emphasis on table metadata, lineage tracking, and quality metrics to ensure data reliability. The emergence of AI-powered data platforms is creating new opportunities for tables to serve as structured sources for training machine learning models, while also raising questions about how tables should be designed to provide high-quality training data. As organizations continue to generate exponentially more data, tables remain the foundational structure for organizing, querying, and analyzing information, with innovations focused on improving performance, scalability, and integration with modern data technologies.
A row is a horizontal arrangement of data that represents a single record or entity, while a column is a vertical arrangement that represents a specific attribute or field shared across all records. In a database table, each row contains complete information about one entity (such as a customer), and each column contains one type of information (such as customer name or email address). Together, rows and columns create the two-dimensional structure that defines a table.
Tables are the fundamental organizational structure in relational databases, enabling efficient data storage, retrieval, and manipulation. They allow databases to maintain data integrity through structured schemas, support complex queries across multiple dimensions, and facilitate relationships between different data entities through primary and foreign keys. Tables make it possible to organize millions of records in a way that is both computationally efficient and logically meaningful for business operations.
A table consists of several essential components: columns (fields/attributes) that define data types and categories, rows (records/tuples) that contain individual data entries, headers that identify each column, data items (cells) that store actual values, primary keys that uniquely identify each row, and potentially foreign keys that establish relationships with other tables. Each component plays a critical role in maintaining data organization and integrity.
In AI monitoring platforms like AmICited, tables are crucial for organizing and presenting data about AI model appearances, citations, and brand mentions across different AI systems. Tables allow monitoring systems to display structured data about when and where content appears in AI responses, making it easy to track metrics, compare performance across platforms, and identify trends in how AI systems cite or reference specific domains and URLs.
Row-oriented databases (like traditional relational databases) store and access data by complete records, making them efficient for transactions where you need all information about one entity. Column-oriented databases store data by column, making them faster for analytical queries that need specific attributes across many records. The choice between these approaches depends on whether your primary use case involves transactional operations or analytical queries.
Accessible tables require proper HTML markup using semantic elements like `
Table columns can store various data types including integers, floating-point numbers, strings/text, dates and times, booleans, and increasingly complex types like JSON or XML. Each column has a defined data type that constrains what values can be entered, ensuring data consistency and enabling proper sorting and comparison operations. Some databases also support specialized types like geographic data, arrays, or custom user-defined types.
Start tracking how AI chatbots mention your brand across ChatGPT, Perplexity, and other platforms. Get actionable insights to improve your AI presence.
Learn what charts are, their types, and how they transform raw data into actionable insights. Essential guide to data visualization formats for analytics and re...
Learn why tables are essential for AI search optimization. Discover how structured data in tables improves AI comprehension, increases citation chances, and enh...
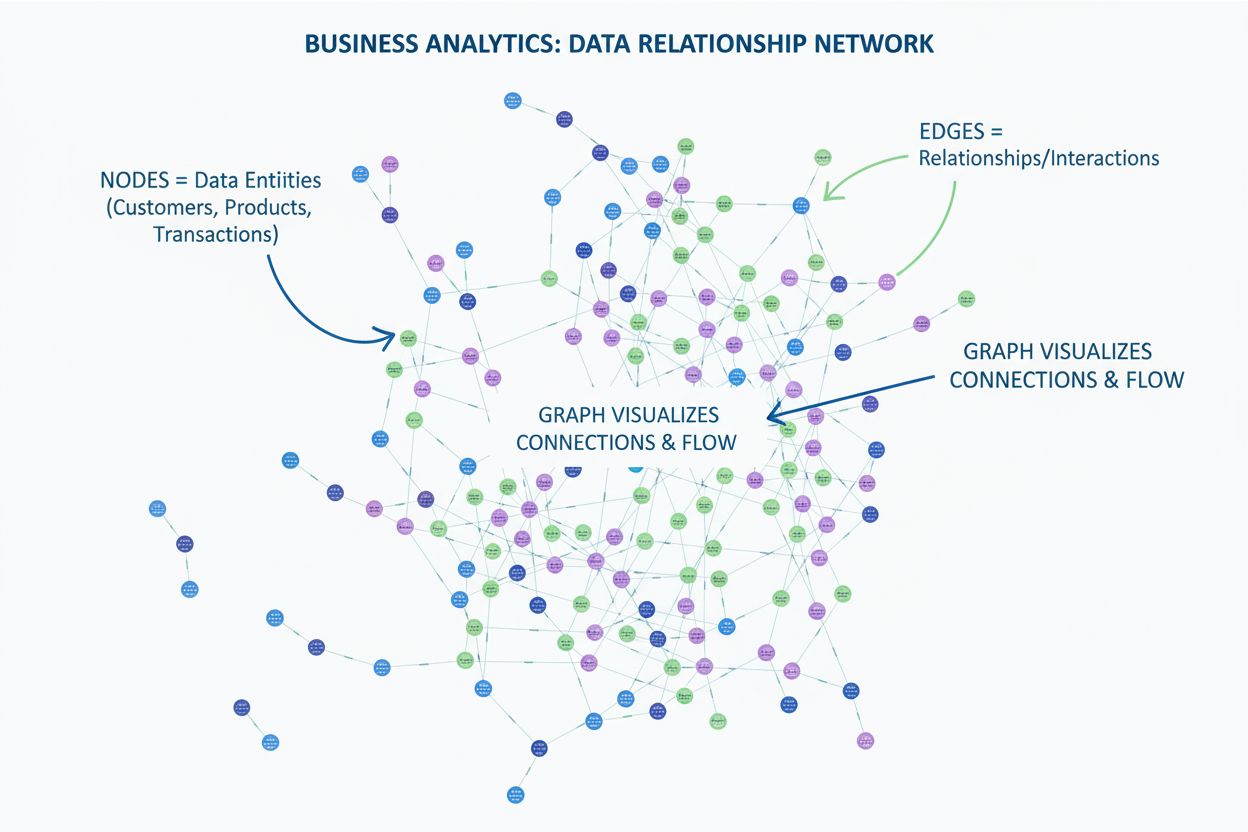
Learn what a graph is in data visualization. Discover how graphs display relationships between data using nodes and edges, and why they're essential for underst...
Cookie Consent
We use cookies to enhance your browsing experience and analyze our traffic. See our privacy policy.