
Reputation Score
Learn what a reputation score is, how it's calculated, and why it matters for brand monitoring. Understand the key factors that influence online reputation metr...
15 min read
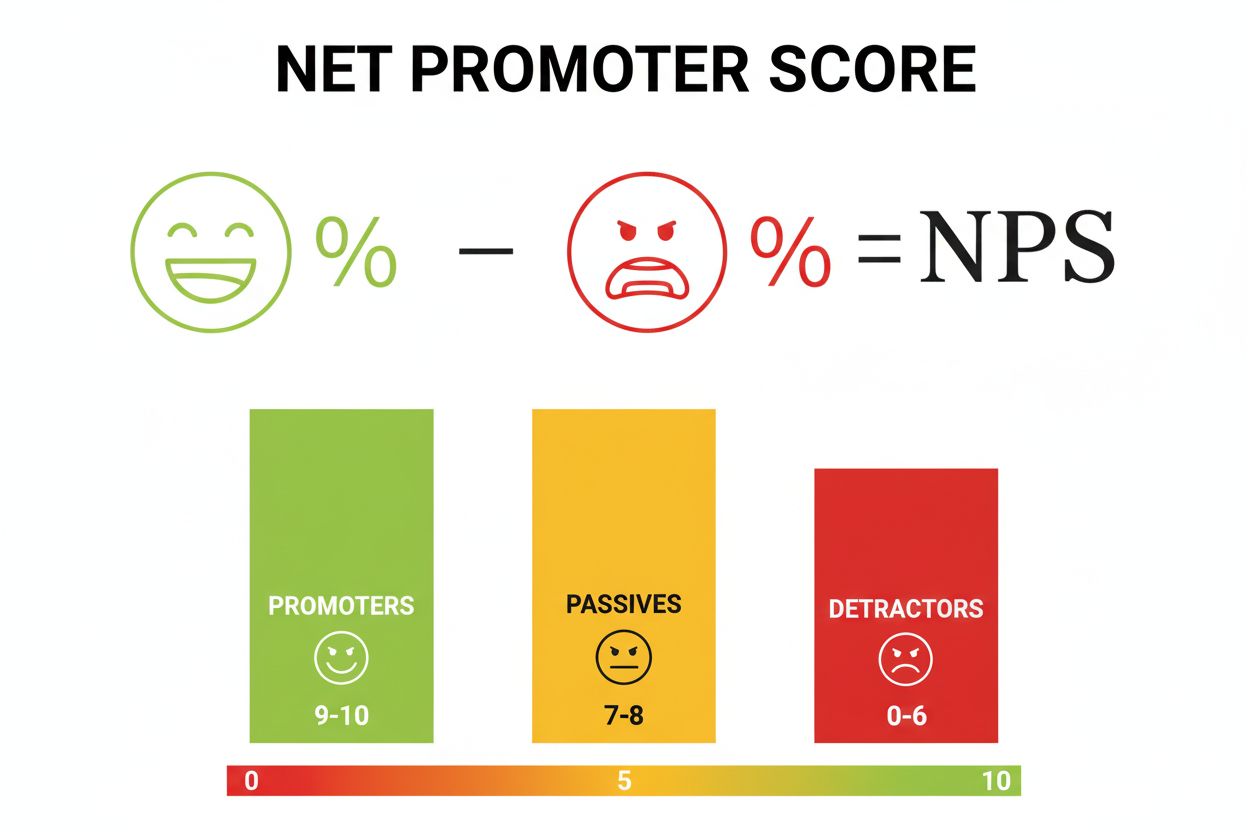
Net Promoter Score (NPS) is a customer satisfaction and loyalty metric that measures the likelihood of customers to recommend a company’s product or service to others on a scale of 0-10. Calculated by subtracting the percentage of detractors from the percentage of promoters, NPS ranges from -100 to +100 and serves as a key indicator of customer experience quality and business growth potential.
Net Promoter Score (NPS) is a customer satisfaction and loyalty metric that measures the likelihood of customers to recommend a company's product or service to others on a scale of 0-10. Calculated by subtracting the percentage of detractors from the percentage of promoters, NPS ranges from -100 to +100 and serves as a key indicator of customer experience quality and business growth potential.
Net Promoter Score (NPS) is a customer loyalty and satisfaction metric that measures the likelihood of customers to recommend a company’s product, service, or brand to friends, colleagues, or family members. Developed in 2003 by Fred Reichheld of Bain & Company in collaboration with Satmetrix and published in the Harvard Business Review article “The One Number You Need to Grow,” NPS has become the gold standard for assessing customer experience quality and predicting business growth. The metric is based on a single, straightforward survey question: “How likely is it that you would recommend [Organization/Product/Service] to a friend or colleague?” Respondents rate their likelihood on a 0-10 scale, where 0 represents “extremely unlikely” and 10 represents “extremely likely.” This simplicity makes NPS accessible to organizations of all sizes and industries, yet its predictive power for customer retention, revenue growth, and competitive advantage is substantial and well-documented across thousands of companies globally.
The concept of Net Promoter Score emerged from research conducted by Fred Reichheld at Bain & Company, who sought to identify the single most important metric for predicting business growth. Reichheld’s work was inspired by a case study shared by Andy Taylor, former CEO of Enterprise Car Rentals, who measured customer loyalty through two simple questions about experience quality and likelihood of repeat business. Building on this foundation, Reichheld developed NPS as a more universal metric applicable across industries and business models. The methodology was formally introduced in December 2003 through the Harvard Business Review, and since then, it has been adopted by over two-thirds of Fortune 500 companies and millions of organizations worldwide. The Net Promoter System, as evolved by Bain & Company, extends beyond the single metric to encompass a comprehensive approach to customer experience management, helping companies systematically improve customer relationships across all touchpoints. Today, NPS is recognized as a leading indicator of customer satisfaction, with strong correlations to customer retention rates, revenue growth, and market share expansion.
The NPS calculation is straightforward and transparent, making it easy for organizations to implement and track. Respondents to the core NPS question are categorized into three distinct groups based on their scores: Promoters (scores 9-10) represent loyal, enthusiastic customers who actively recommend the company and drive growth through positive word-of-mouth; Passives (scores 7-8) are satisfied but unenthusiastic customers who are vulnerable to competitive offers and unlikely to provide referrals; and Detractors (scores 0-6) are unhappy customers at risk of churn who may actively discourage others from doing business with the company. The NPS formula subtracts the percentage of detractors from the percentage of promoters, with passives excluded from the calculation: NPS = % Promoters − % Detractors. The resulting score ranges from -100 (all detractors) to +100 (all promoters), with scores above 0 indicating more promoters than detractors, above 30 considered favorable, above 50 considered excellent, and above 70 considered world-class. According to Bain & Company’s framework, companies achieving NPS scores above 80 demonstrate exceptional customer loyalty and are typically market leaders in their respective industries. Understanding this scoring structure is essential for organizations to contextualize their results and identify improvement opportunities.
| Metric | NPS (Net Promoter Score) | CSAT (Customer Satisfaction Score) | CES (Customer Effort Score) |
|---|---|---|---|
| Primary Focus | Overall loyalty and recommendation likelihood | Satisfaction with specific product/service | Ease of accomplishing customer goals |
| Survey Scale | 0-10 (likelihood to recommend) | 1-5 (satisfaction level) | 1-5 or 1-7 (effort required) |
| Time Horizon | Long-term relational metric | Transactional/immediate satisfaction | Transactional interaction-focused |
| Calculation | % Promoters − % Detractors | % Satisfied (4-5 ratings) | Average effort score |
| Customer Segments | Promoters, Passives, Detractors | Satisfied vs. Unsatisfied | High effort vs. Low effort |
| Predictive Value | Strong correlation with retention and growth | Moderate correlation with loyalty | Strong correlation with churn prevention |
| Best Use Case | Measuring overall customer loyalty and growth potential | Evaluating specific touchpoint satisfaction | Identifying friction in customer journey |
| Industry Adoption | Highest among B2B companies (most popular) | Widely used across all industries | Growing adoption in service industries |
| Actionability | Requires follow-up questions for insights | Directly identifies satisfaction gaps | Immediately highlights problem areas |
Understanding the three distinct customer segments revealed by NPS surveys is fundamental to leveraging the metric for business improvement. Promoters, scoring 9-10, represent the most valuable customer segment—they are enthusiastic brand advocates who actively recommend products and services to their networks, generate positive word-of-mouth, and demonstrate high customer lifetime value. These customers are less price-sensitive, more likely to make repeat purchases, and serve as a source of organic customer acquisition. Research indicates that promoters contribute disproportionately to revenue growth, with studies showing that companies with high proportions of promoters experience 25-50% higher customer retention rates compared to those with lower promoter percentages. Passives, scoring 7-8, represent a critical but often overlooked segment. While satisfied with the company, passives lack the enthusiasm and emotional connection necessary to become advocates. They are vulnerable to competitive offerings and may switch providers if presented with attractive alternatives. Organizations that focus exclusively on converting detractors to promoters often miss the opportunity to elevate passives into promoters—a potentially more efficient strategy since passives are already satisfied and require less intensive intervention. Detractors, scoring 0-6, are unhappy customers at significant risk of churn. Beyond the immediate threat of lost revenue, detractors actively damage brand reputation through negative word-of-mouth, online reviews, and social media commentary. Research from Qualtrics and Bain & Company demonstrates that detractors can reduce customer lifetime value by 25-50% and create negative network effects that impede new customer acquisition. Effective NPS programs prioritize closing the loop with detractors—following up to understand root causes, addressing concerns, and attempting to convert them into satisfied customers.
Successful NPS implementation requires careful consideration of survey methodology, timing, and follow-up processes to maximize response rates and actionable insights. Organizations can deploy NPS surveys through multiple channels including email surveys, onsite pop-ups, SMS and text messages, postcall surveys, and in-person interactions, with each channel offering distinct advantages and response rate profiles. Email surveys are cost-effective and allow for detailed follow-up questions but may suffer from lower response rates; onsite pop-ups capture feedback from engaged website visitors in real-time; SMS surveys reach mobile-first audiences and enable quick feedback collection; postcall surveys leverage the immediacy of customer service interactions; and in-person surveys in retail environments build personal connection but require significant resource investment. Research indicates that transactional NPS surveys—deployed immediately after specific customer interactions like purchases or support resolutions—generate higher response rates (often 30-50%) compared to relational surveys (typically 10-20%), though transactional surveys provide less comprehensive insights into overall customer relationships. Best practices for NPS survey design include keeping surveys concise (ideally 3-5 questions maximum), including open-ended follow-up questions asking “Why did you give this score?” and “How can we improve?”, personalizing surveys with company and product names, testing surveys internally before deployment, and establishing clear processes for closing the loop with detractors. According to Qualtrics research, organizations that combine NPS with sentiment analysis and text analytics can extract deeper insights from open-ended responses, identifying common themes and prioritizing improvement initiatives. The timing of survey deployment significantly impacts response quality—surveys sent too frequently may annoy customers and bias results toward negative scores, while infrequent surveys miss important trend shifts.
NPS benchmarking is essential for contextualizing organizational performance and identifying competitive positioning within specific industries. According to 2025 data from Survicate, which analyzed over 5.4 million survey responses from 599 companies, the median NPS across all industries is 42, with significant variation by sector. Manufacturing leads with a median NPS of 65, followed by Healthcare at 61 and Agency & Consulting at 59, indicating strong customer satisfaction in these sectors. Conversely, Software companies average 30, Digital Marketplaces 35, and Wholesale 36, reflecting the challenges of delivering consistent experiences in competitive, technology-driven markets. B2C companies significantly outperform B2B with a median NPS of 49 versus 38, a 11-point gap reflecting differences in customer expectations, relationship complexity, and switching barriers. Within specific industries, performance variation is substantial—Manufacturing companies range from 29 to 75 (a 46-point spread), demonstrating that execution and customer experience strategy matter more than industry classification. Retently’s 2025 benchmarks reveal that Insurance leads B2B with 80, Financial Services at 75, and Consulting in the high 60s, while Cloud & Hosting averages 37 and Construction has declined to 34. Importantly, year-over-year trends show concerning declines—10 of 11 industries analyzed experienced NPS decreases from 2024 to 2025, with Healthcare dropping 10 points despite starting from the highest baseline, suggesting that rising customer expectations and operational challenges are making it increasingly difficult to maintain satisfaction levels. Organizations should benchmark against industry peers, regional competitors, and their own historical performance to establish realistic improvement targets and identify specific areas requiring attention.
The relationship between NPS and business outcomes is well-established through extensive research and real-world case studies demonstrating strong correlations between high NPS scores and measurable financial performance. CustomerGauge research shows that businesses conducting annual NPS surveys experience approximately 44% increase in retention rates, directly translating to improved customer lifetime value and reduced churn costs. High NPS scores correlate with increased customer loyalty, as promoters demonstrate higher repeat purchase rates, longer customer tenure, and greater willingness to expand spending with the company. McKinsey research indicates that AI-powered customer experience improvements can enhance satisfaction by 15-20%, with corresponding NPS increases driving revenue growth. Companies with NPS above 70 typically experience 25-50% higher customer retention rates compared to those with NPS below 30, and this retention advantage compounds over time as loyal customers generate referrals and expand their purchasing. Promoters generate organic customer acquisition through word-of-mouth recommendations, reducing customer acquisition costs by an estimated 25-40% compared to paid marketing channels. Conversely, detractors create negative network effects—research indicates that each detractor can influence 3-5 potential customers to avoid the company, effectively multiplying the cost of poor customer experience. Organizations that actively manage NPS—closing the loop with detractors, converting passives to promoters, and systematically improving underlying customer experience drivers—demonstrate measurable revenue acceleration. Tesla’s NPS of 96 and Apple’s NPS of 61 correlate directly with their market leadership positions and premium pricing power, while companies with negative NPS scores typically face significant competitive pressure and market share erosion.
Improving Net Promoter Score requires systematic identification and management of the specific factors driving customer satisfaction and loyalty within an organization’s unique context. Key driver analysis—using statistical techniques like regression analysis or correlation studies—helps organizations identify which aspects of the customer experience most strongly influence NPS scores. Common NPS drivers include product quality and reliability, customer service responsiveness and effectiveness, ease of use and user experience, value for money and pricing fairness, brand trust and reputation, omnichannel support availability, and personalization and customer recognition. Organizations can improve NPS through multiple strategic approaches: improving omnichannel marketing and support by ensuring consistent experiences across website, mobile, social media, and in-person channels; enhancing customer care through faster issue resolution, proactive support, and empowered service representatives; providing superior customer experience by removing friction from the customer journey and exceeding expectations at key touchpoints; focusing on passives by identifying what would elevate them to promoter status rather than exclusively targeting detractors; and conducting root-cause analysis to understand why customers give low scores and addressing underlying systemic issues. Closed-loop processes—where organizations systematically follow up with detractors to understand concerns, take corrective action, and report back on improvements—have been shown to increase NPS by 5-15 points annually. Just Eat Takeaway.com achieved a remarkable 97% closed-loop rate on 98% of detractors within 48 hours, resulting in significant NPS improvements and customer retention gains. AB InBev’s transformation from an NPS of -13 to 56 demonstrates the power of systematic measurement and improvement, using NPS data to drive accountability across sales, product, and service teams.
The evolution of Net Promoter Score in the context of artificial intelligence and digital customer experience represents both an opportunity and a challenge for organizations seeking to maintain relevance in rapidly changing markets. AI-powered sentiment analysis can now automatically analyze open-ended NPS responses, identifying themes, emotions, and actionable insights at scale without manual coding. Natural language processing enables organizations to understand nuanced customer feedback, distinguishing between different types of complaints and identifying emerging issues before they impact large customer segments. Predictive analytics using NPS data combined with operational metrics can identify customers at risk of churn before they formally leave, enabling proactive retention interventions. However, traditional NPS metrics face limitations in capturing the complexity of AI-mediated customer experiences—as noted by NTT DATA, conventional NPS surveys may not adequately measure satisfaction with intelligent systems, chatbots, and algorithmic recommendations that increasingly mediate customer interactions. Organizations are adapting by supplementing NPS with additional metrics like effort scores for AI interactions, trust ratings for algorithmic decisions, and satisfaction with personalization accuracy. Gartner’s prediction that NPS would decline in 2025 has not materialized—instead, organizations continue to rely on NPS while enhancing it with complementary metrics and AI-driven analysis. The integration of customer feedback platforms with CRM systems, support ticketing systems, and product analytics enables organizations to correlate NPS scores with specific customer behaviors, product usage patterns, and support interactions, creating a more holistic understanding of what drives satisfaction. Survicate’s 2025 research shows that organizations using AI-powered feedback analysis and automated insights generation achieve 20-30% faster time-to-insight and more targeted improvement initiatives compared to manual analysis approaches.
The future of Net Promoter Score is characterized by increasing sophistication in measurement, analysis, and application, driven by technological advancement and evolving customer expectations. Continuous measurement is replacing annual or quarterly surveys, with organizations deploying always-on feedback collection through multiple channels to capture real-time customer sentiment. Segmentation and personalization of NPS surveys—tailoring questions and follow-ups based on customer segment, product, or journey stage—enables more granular insights and targeted improvement initiatives. Integration with operational data is becoming standard practice, with organizations linking NPS scores to specific customer behaviors, product features, support interactions, and business outcomes to identify causal relationships. Predictive NPS modeling using machine learning can forecast future NPS trends based on leading indicators, enabling proactive management rather than reactive response. Expanded metrics ecosystems are emerging, with organizations supplementing NPS with Customer Effort Score (CES) for transactional interactions, Customer Satisfaction (CSAT) for specific touchpoints, and Net Revenue Retention (NRR) for subscription businesses. Generational and cultural adaptation of NPS is gaining attention, with research showing that European respondents rate more conservatively than Americans, and Asian markets show different scoring patterns, leading some organizations to adjust scoring thresholds by region. Employee Net Promoter Score (eNPS) is gaining traction as organizations recognize that employee satisfaction correlates with customer satisfaction, though research suggests comprehensive employee engagement surveys may be more effective than single-question eNPS. The democratization of NPS tools through affordable software platforms means that even small and mid-market companies can now implement sophisticated NPS programs previously available only to large enterprises. Looking forward, NPS will likely remain the dominant customer loyalty metric while becoming increasingly integrated with broader customer experience management systems, AI-driven analytics, and real-time feedback loops that enable organizations to continuously improve customer relationships and drive sustainable business growth.
Net Promoter Score (NPS) has established itself as the preeminent metric for measuring customer loyalty and predicting business growth since its introduction in 2003. The metric’s enduring popularity stems from its elegant simplicity—a single question on a 0-10 scale—combined with powerful predictive validity for customer retention, revenue expansion, and competitive advantage. Organizations implementing NPS effectively recognize that the metric itself is merely a diagnostic tool; the real value lies in understanding the drivers behind scores, systematically closing the loop with detractors, and continuously improving the customer experience. As demonstrated by industry leaders like Tesla (NPS 96), Apple (NPS 61), and Costco (NPS 70-80), high NPS scores correlate directly with market leadership, premium pricing power, and sustainable competitive advantage. The evolution of NPS in the AI era—enhanced by sentiment analysis, predictive modeling, and integration with operational data—promises even greater insights into customer satisfaction and business performance. Organizations that treat NPS not as a vanity metric but as a strategic tool for understanding and improving customer relationships will continue to outperform competitors and achieve superior financial results. Whether measured quarterly, annually, or continuously, Net Promoter Score remains the gold standard for customer experience measurement and will likely maintain this position as the primary metric for assessing customer loyalty and predicting organizational success.
NPS measures overall customer loyalty and likelihood to recommend, focusing on long-term relationships. CSAT (Customer Satisfaction Score) measures satisfaction with specific products or services on a 1-5 scale. CES (Customer Effort Score) evaluates how easy it is for customers to accomplish their goals. While all three assess customer experience, NPS is relational, CSAT is transactional, and CES focuses on effort reduction. Organizations typically use all three metrics together for comprehensive customer insights.
NPS is calculated using the formula: % of Promoters (scores 9-10) minus % of Detractors (scores 0-6). Passives (scores 7-8) are not included in the calculation. For example, if 70% are promoters, 20% are detractors, and 10% are passives, your NPS would be 70 - 20 = 50. The resulting score ranges from -100 (all detractors) to +100 (all promoters), with scores above 0 considered positive and above 50 considered excellent.
A good NPS depends on industry context. Generally, any score above 0 is positive, above 30 is favorable, and above 50 is excellent. World-class companies typically achieve NPS scores above 70. However, benchmarking against industry peers is crucial—manufacturing averages 65, healthcare 61, while software averages 30. The most important metric is your own historical performance; consistent improvement over time indicates successful customer experience management regardless of absolute score.
Promoters (scores 9-10) are loyal, enthusiastic customers who actively recommend your business and drive growth through positive word-of-mouth. Passives (scores 7-8) are satisfied but unenthusiastic customers vulnerable to competitive offers. Detractors (scores 0-6) are unhappy customers likely to leave and damage your reputation through negative feedback. Understanding these three segments helps organizations prioritize improvement efforts, converting detractors into promoters and passives into advocates.
Most organizations conduct relational NPS surveys quarterly or annually to track long-term customer sentiment and relationship health. Transactional NPS surveys can be sent after specific customer interactions like purchases or support resolutions, though this approach is less common. The frequency depends on business model and goals—B2B companies often survey quarterly during business reviews, while B2C companies may survey after key touchpoints. Continuous measurement provides better trend visibility than annual snapshots.
Research demonstrates strong correlation between high NPS and improved customer retention rates. Companies conducting annual NPS surveys experience approximately 44% increase in retention rates. High NPS indicates customers are satisfied and likely to continue purchasing, while low NPS signals churn risk. Organizations that actively close the loop with detractors—addressing their concerns and converting them to promoters—see measurable improvements in retention and lifetime customer value.
B2C companies typically achieve higher median NPS scores (49) compared to B2B companies (38), a 11-point difference in 2025 data. B2C focuses on transactional satisfaction and emotional brand connection, while B2B emphasizes reliability, integration capabilities, and operational value. B2B relationships involve longer sales cycles and multiple stakeholders, making satisfaction harder to achieve consistently. However, B2B companies benefit from higher switching barriers and established vendor relationships that provide stability.
High NPS directly correlates with revenue growth and customer acquisition. Promoters generate referrals that convert to new customers at lower acquisition costs. Research shows businesses with NPS above 70 experience significantly higher customer lifetime value and organic growth through word-of-mouth. Conversely, detractors create negative word-of-mouth that impedes growth. Companies that improve NPS by 5-10 points typically see measurable increases in retention rates and revenue expansion from existing customer bases.
Start tracking how AI chatbots mention your brand across ChatGPT, Perplexity, and other platforms. Get actionable insights to improve your AI presence.
Learn what a reputation score is, how it's calculated, and why it matters for brand monitoring. Understand the key factors that influence online reputation metr...
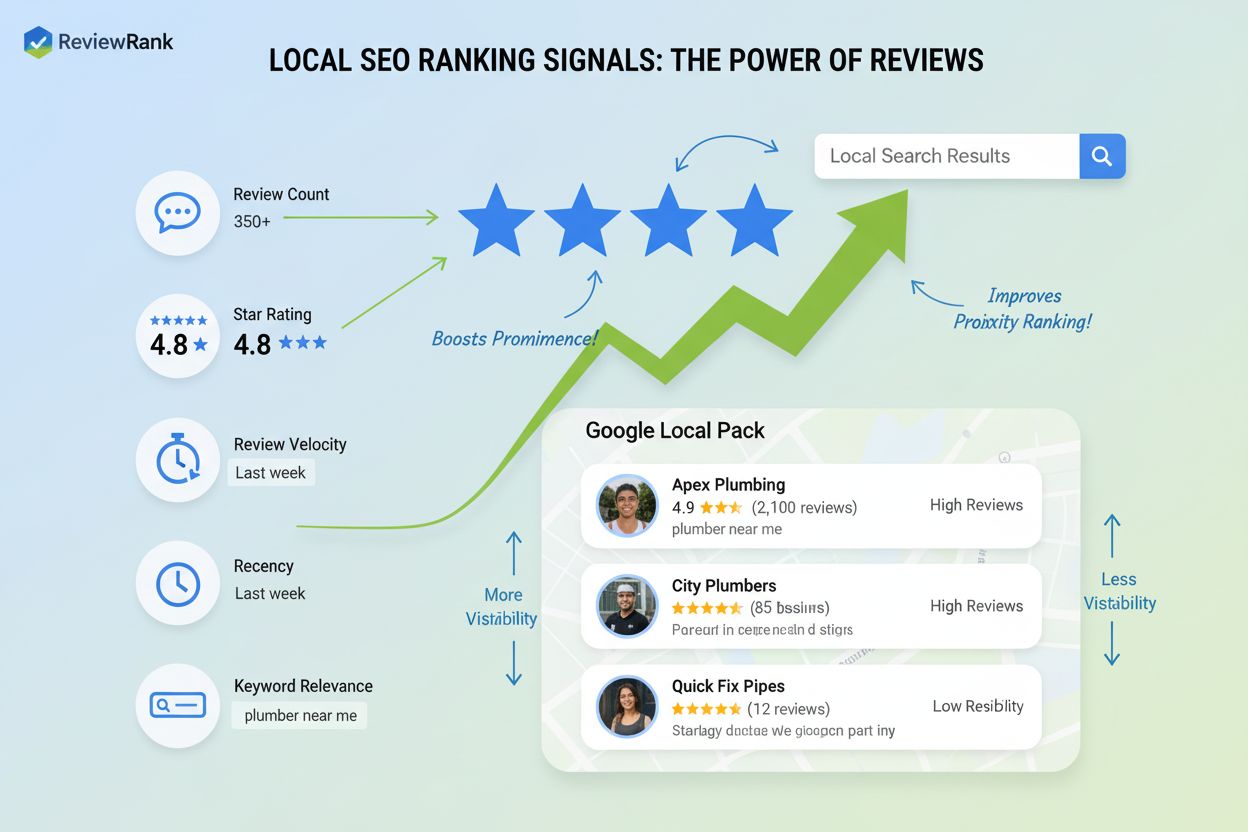
Review signals are key local SEO ranking factors including review count, ratings, velocity, and recency. Learn how reviews impact local search visibility and bu...
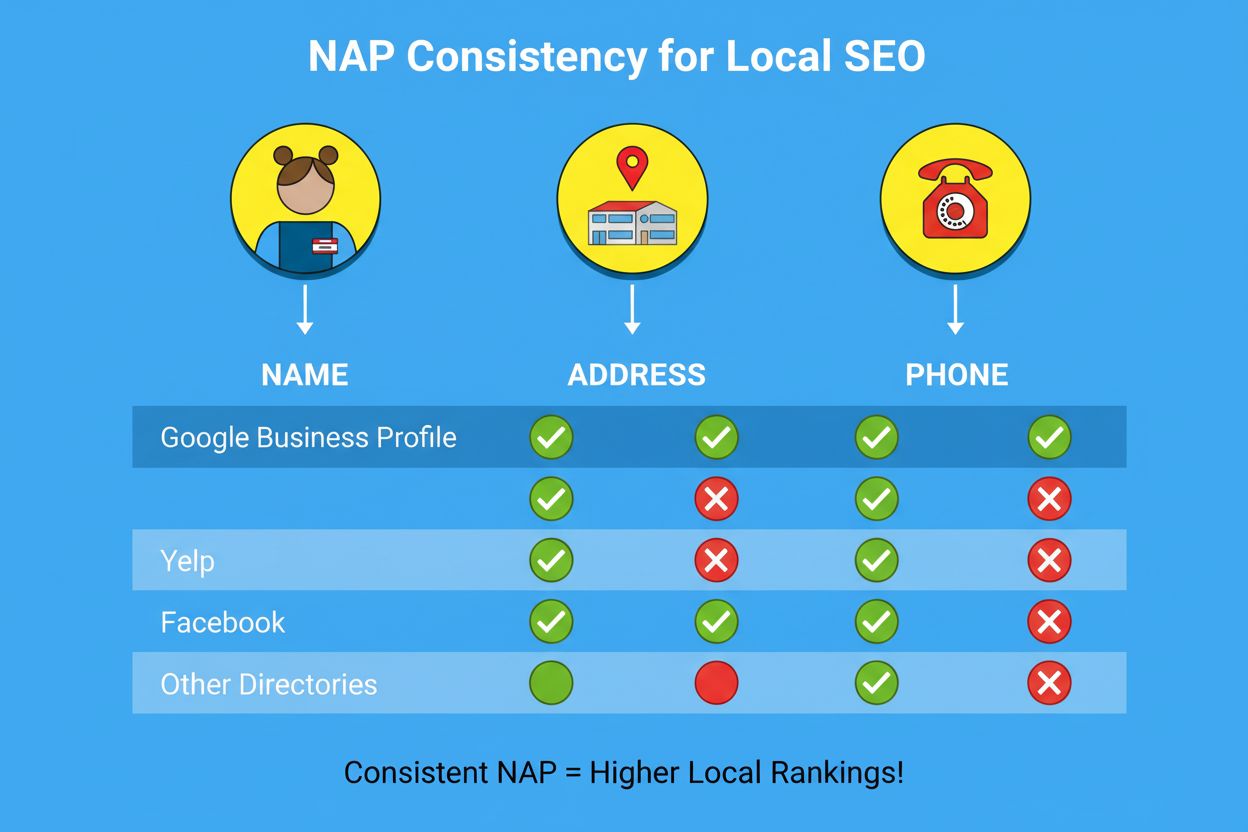
NAP Consistency is the uniformity of business Name, Address, and Phone across all online platforms. Learn why it's essential for local SEO rankings, consumer tr...
Cookie Consent
We use cookies to enhance your browsing experience and analyze our traffic. See our privacy policy.