


Creating AI Visibility Dashboards: Best Practices
Learn how to build effective AI visibility dashboards to monitor your brand across ChatGPT, Perplexity, and Google AI Overviews. Best practices for GEO reportin...
13 min read

A blueprint for building a KPI dashboard for AI search performance: the metrics to include across four layers, how to structure daily/weekly/monthly/executive views, data sources, and reporting cadence.
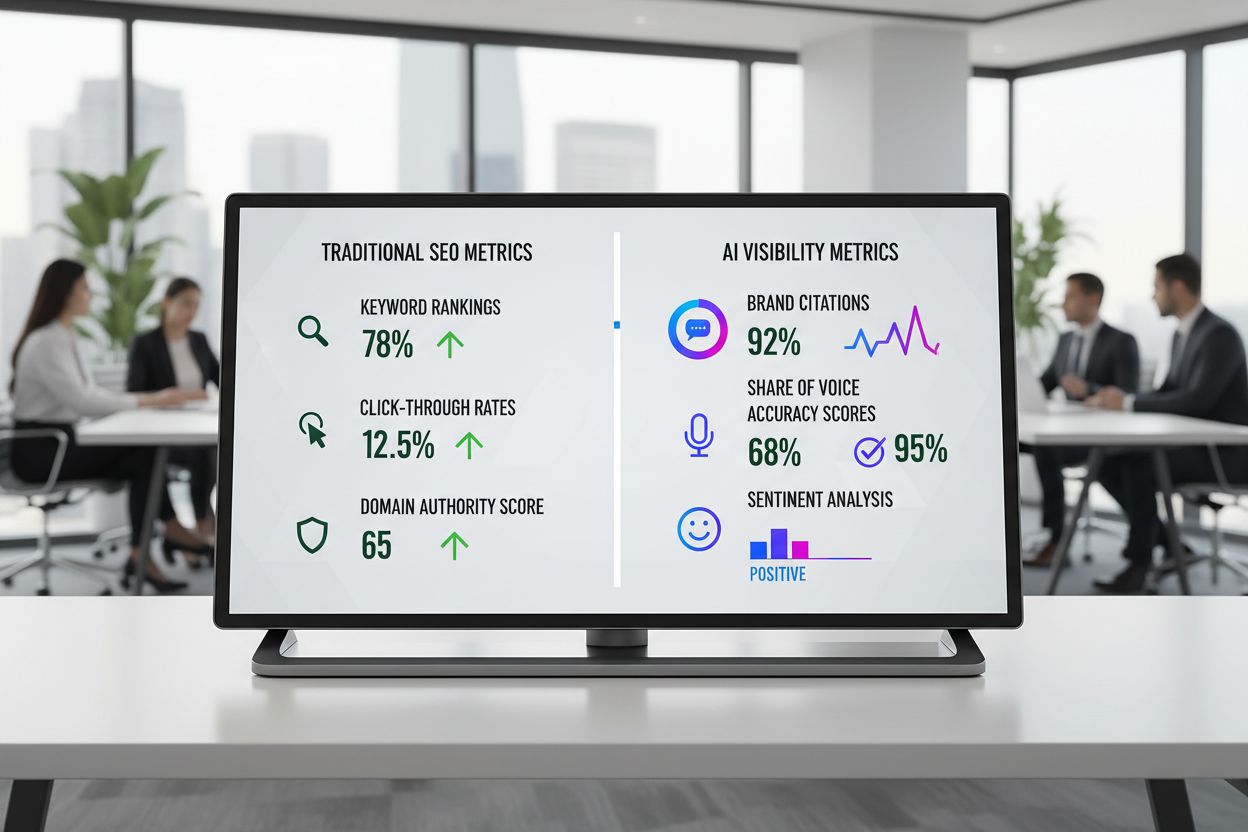
The search landscape has split in two. On one side, traditional Google rankings still drive organic traffic. On the other, ChatGPT, Perplexity, Gemini, Claude, and Google AI Overviews generate answers that never send a click to your site, yet shape brand perception, influence purchase decisions, and quietly redirect market share. Your existing SEO dashboards are blind to all of it.
This is not a future problem. AI platforms are producing an estimated 10 billion responses monthly, and BrightEdge research shows AI search visits growing at double-digit monthly rates throughout 2025. The brands that build measurement systems for this new reality now will own the data advantage that compounds over time. Those that wait will optimize in the dark.
This blueprint walks you through every layer of building a KPI dashboard for AI search performance: the metrics that actually matter, the formulas to calculate them, the data pipeline that feeds them, the BI tool that visualizes them, and the dashboard layout that makes them actionable for both operators and executives.
For two decades, the SEO measurement model was straightforward: rank higher, earn more clicks, track sessions, measure conversions. That model assumed visibility required a click. It no longer does.
When a user asks ChatGPT “what’s the best CRM for mid-market SaaS companies” and the response describes your product, compares it favorably against competitors, and recommends it, your session count stays at zero. The brand influence happened entirely inside the AI interface. Your analytics never registered it.
Google AI Overviews compound this problem. When Google synthesizes an answer from multiple sources at the top of the SERP, users often get what they need without clicking any link. According to Semrush research, AI Overviews citations draw 76% of their sources from the top 10 organic results, meaning your content can be the foundation of an AI answer without generating a single session.
This makes traffic an incomplete KPI. It measures outcomes, not total visibility. Brands that optimize exclusively for sessions will systematically underinvest in the content that AI engines cite most.
AI search transforms discovery into a two-phase process: brand evaluation happens inside the AI interface, and website visits happen only when the user decides to go deeper. This means your content strategy must now serve two masters: the AI engine that synthesizes your expertise into answers, and the human who may or may not click through.
Traditional SEO dashboards report on the second phase exclusively. They tell you what happened after the click. They cannot tell you how often your brand appeared in AI answers, whether competitors were cited instead, or whether the AI described your product accurately.
AI referral traffic often arrives in GA4 disguised as direct traffic. Links from ChatGPT, Perplexity, and Gemini don’t always carry clean referrer data. Without deliberate UTM tagging and custom channel grouping, you may be receiving AI-driven visitors without knowing it. The result is a measurement gap where AI visibility grows but your dashboards show no corresponding traffic source, making the channel appear to produce zero ROI, even when it’s quietly driving pipeline.

Track how AI chatbots mention your brand across ChatGPT, Perplexity, and other platforms.
A robust AI search performance dashboard organizes metrics into four tiers that move from leading indicators (what you can influence today) to lagging indicators (the business outcomes that follow). Reporting them together tells the full story.
Visibility KPIs measure whether AI engines know your brand exists for the topics that matter to your business. These are the top-of-funnel metrics that predict everything downstream.
AI Mention Rate is the percentage of tracked prompts where your brand name appears in the AI response. If you run 100 prompts across your target topic cluster and your brand is mentioned in 54 of them, your mention rate is 54%. This is the broadest measure of AI presence: it captures every time the AI acknowledges your brand, whether or not it links to your site.
Citation Rate is stricter. It measures the percentage of prompts where your website or content is explicitly cited as a source, typically with a clickable link, a footnote, or an inline attribution. A mention without a citation means the AI knows your brand but doesn’t treat your content as the evidence. A citation signals the AI considers your content authoritative enough to reference directly.
AI Share of Voice puts both metrics in competitive context. It measures your brand’s percentage of total mentions across all tracked brands in your category. If your brand appears in 54 answers and your three competitors appear in 74, 48, and 29 answers respectively, your AI Share of Voice is 54 / (54 + 74 + 48 + 29) = 26.3%. This is the metric executives gravitate toward because it translates visibility into a single competitive score.
Prompt Coverage tracks the percentage of your target prompt set that triggers any AI response containing your brand. It’s especially useful for identifying content gaps: the prompt categories where you have zero presence.
Visibility alone is insufficient. If AI engines mention your brand but describe your product incorrectly, recommend a competitor over you, or frame your offering negatively, visibility becomes a liability.
Recommendation Rank captures where you appear in the AI’s answer hierarchy. First mention carries more weight than third mention. If the AI lists three options and you’re listed third, your recommendation rank is 3. Track the percentage of prompts where you appear in the first position versus being mentioned later.
Sentiment Score classifies AI answers as positive, neutral, or negative toward your brand. This is particularly important for comparison prompts (e.g., “Brand X vs. Brand Y”). If the AI consistently frames your competitor as the better choice, you need to understand why, and fix the underlying content that’s shaping that perception.
Citation Quality assesses which pages the AI is citing and whether they’re the right pages. If the AI cites your 2018 blog post instead of your current product page, you have a freshness problem. If it cites a third-party review site rather than your own content, you have an authority gap. Source quality tracking helps you prioritize which pages to optimize for AI ingestion.
When AI visibility does generate clicks, you need to measure what those visitors do.
AI Referral Sessions is the total traffic arriving from identifiable AI platforms. Set up custom channel groupings in GA4 to isolate traffic from chat.openai.com, perplexity.ai, gemini.google.com, claude.ai, and any other AI referrer sending meaningful volume. Track this monthly and by platform.
AI Conversion Rate measures the percentage of AI-referred visitors who complete a key event: trial signup, demo request, purchase, or form submission. This is the bridge metric between visibility and revenue. It answers the question: “When AI engines send us traffic, does it convert at a competitive rate?”
AI Engagement Rate (or engaged sessions in GA4) compares dwell time, pages per session, and bounce rate for AI-referred visitors versus organic search visitors. This helps you assess whether AI-driven traffic is high-intent or casual browsing.
Business impact metrics connect AI visibility to the outcomes your CFO cares about.
AI-Attributed Revenue is the hardest metric to get right and the most valuable. It requires CRM integration that maps AI-referred leads through the pipeline to closed-won deals. If full attribution isn’t available, use estimated value based on conversion rates and average deal size, clearly labeled as directional.
Brand Search Lift measures the increase in branded search queries following periods of high AI visibility. When users discover your brand through AI and then search for you directly, that lift is measurable in Google Search Console and serves as a proxy for AI-driven brand awareness.
AI Pipeline tracks the total value of opportunities where AI referral was part of the touch chain. Even if AI wasn’t the last click, its role in the discovery phase should be acknowledged.
Here is the complete KPI matrix with recommended formulas and review cadence:
| Tier | KPI | Formula | Frequency | Data Source |
|---|---|---|---|---|
| Visibility | AI Mention Rate | (Prompts with brand mention ÷ Total prompts) × 100 | Weekly | AI tracking tool (Profound, Otterly, Semrush) |
| Visibility | Citation Rate | (Prompts with URL citation ÷ Total prompts) × 100 | Weekly | AI tracking tool |
| Visibility | AI Share of Voice | (Your mentions ÷ Total brand mentions in category) × 100 | Weekly | AI tracking tool + competitor list |
| Visibility | Prompt Coverage | (Prompts with any brand presence ÷ Target prompt set) × 100 | Monthly | AI tracking tool |
| Quality | Recommendation Rank | Average position of brand mention (1 = first) | Weekly | Manual review or NLP tool |
| Quality | Sentiment Score | (Positive - Negative) ÷ Total mentions × 100 | Monthly | NLP or manual review |
| Quality | Citation Quality | % of citations linking to target/desired URLs | Monthly | AI tracking tool |
| Traffic | AI Referral Sessions | Sum of sessions from AI platforms | Daily | GA4 custom channel group |
| Traffic | AI Conversion Rate | AI conversions ÷ AI sessions × 100 | Weekly | GA4 + goals |
| Business | AI-Attributed Revenue | Sum of closed-won revenue from AI-touch deals | Monthly | CRM + UTM parameters |
| Business | Brand Search Lift | Current branded impressions ÷ Baseline branded impressions | Monthly | Google Search Console |
Accurate measurement requires standardized formulas. Here is how to compute the core metrics.
AI Mention Rate = (Number of prompts where your brand name appears ÷ Total number of prompts run) × 100
Run the same set of prompts consistently: at least 50 per topic cluster for statistical reliability. Include brand name variations, product names, and common misspellings in your mention detection. Run each prompt more than once (minimum 3 times) to account for response variability. Average the results.
Example: You run 150 prompts across your product category. Your brand appears in 81 responses. Mention Rate = 81 ÷ 150 × 100 = 54%.
Citation Rate = (Number of prompts where your URL is cited as a source ÷ Total number of prompts run) × 100
Calculate this separately for each AI platform. ChatGPT, Perplexity, and Google AI Overviews cite differently, combining them into a single number obscures platform-specific trends.
Example: Out of 150 prompts, your URL is cited in 57 ChatGPT responses. ChatGPT Citation Rate = 57 ÷ 150 × 100 = 38%.
AI Share of Voice = (Your brand mentions ÷ Sum of all tracked brand mentions for the same prompt set) × 100
Define a competitor set of 3-5 brands before calculation. Run the same prompt set for every competitor. Track consistently.
Example: Across 150 prompts, your brand has 81 mentions, Competitor A has 74, Competitor B has 48, Competitor C has 29. Your Share of Voice = 81 ÷ (81 + 74 + 48 + 29) × 100 = 34.9%.
A more nuanced version weights mentions by their position in the answer. A first-position mention gets 10 points, second gets 5, third gets 3, and any later mention gets 1. This prevents a brand that’s always mentioned last from appearing equal to a brand that’s always recommended first.
Weighted Score = Σ (position points for each mention ÷ total possible points)
| Formula Component | Description |
|---|---|
| Numerator | Sum of your brand’s position-weighted points across all prompts |
| Denominator | Sum of all brands’ position-weighted points across all prompts |
| Frequency | Weekly, with rolling 4-week average for trend detection |
Get the latest insights on AI mentions, brand monitoring, and optimization strategies.
The dashboard is only as good as the data feeding it. AI search measurement requires stitching together data from four fundamentally different source types.
Google Analytics 4 captures AI referral traffic when it arrives with identifiable referrer data. Create a custom channel group that isolates AI platforms as their own channel. Tag any links you control (in custom GPTs, directory listings, or partnership content) with UTM parameters (utm_source=perplexity, utm_medium=ai-search).
Google Search Console now provides generative AI performance reports that show impressions and clicks from AI Overviews and AI Mode. Monitor these separately from traditional organic search metrics.
AI Tracking APIs from tools like Profound, Otterly, Semrush AI Visibility Toolkit, Ahrefs Brand Radar, or Peec AI provide the visibility layer: mention rates, citation rates, share of voice, and sentiment data across ChatGPT, Perplexity, Gemini, Claude, and Google AI Overviews.
CRM systems (Salesforce, HubSpot) close the attribution loop. Create a custom field for AI-touch attribution and map it through your opportunity stages. This is the only way to connect AI visibility to pipeline and revenue.
The data pipeline follows a three-stage pattern: ingestion, transformation, storage.
Ingestion layer: Use n8n workflows to automate prompt execution against LLM APIs on a scheduled basis. Set up a workflow that fires your prompt set daily or weekly, parses the JSON responses using structured output parsers, extracts brand mentions, citations, and sentiment, and pushes the results to your data warehouse.
n8n’s visual workflow builder makes this accessible without deep engineering resources. Connect nodes for HTTP requests (to call LLM APIs), AI agents (for structured output parsing), and database connectors (for writing to BigQuery, Snowflake, or PostgreSQL).
Transformation layer: Fivetran handles the ELT pipeline for your traditional data sources: GA4, Google Search Console, and CRM data. It automates schema management and incremental loading, so your warehouse always has fresh data without manual intervention.
Storage layer: BigQuery, Snowflake, or even Google Sheets (for smaller implementations) serves as the single source of truth. The BI tool connects here. Keeping all your AI visibility data in one place makes cross-source analysis possible, correlating mention rate increases with branded search lift, for example.
| Data Source | Ingestion Method | Tool | Frequency |
|---|---|---|---|
| AI prompt responses | LLM API calls | n8n + custom scripts | Daily or weekly |
| GA4 referral traffic | API connector | Fivetran / n8n | Daily |
| Google Search Console | API connector | Fivetran / n8n | Daily |
| CRM pipeline data | API connector | Fivetran | Daily |
| Competitor AI visibility | AI tracking tool API | Profound / Otterly / Semrush | Weekly |
The core automation challenge is running the same prompts consistently and extracting structured data from free-form AI responses. Here is the approach:
Critical: Run prompts against the real UI of each platform whenever possible, not just the API. API responses can differ from what end users see. Tools like Profound and Otterly handle this distinction; if you’re building your own pipeline, account for it.
The BI tool you choose shapes what’s possible. Here is how the three leading platforms compare for AI search dashboards specifically.
Best for teams already embedded in the Google ecosystem. The free tier is genuinely capable, and the recently launched Otterly Looker Studio Connector pipes AI visibility data directly into your reports. Looker Studio works well for agencies sharing dashboards with clients and for in-house teams that need fast, shareable reports without heavy IT involvement.
Strengths: Free, fast setup, native GA4 and GSC connectors, strong sharing and embedding, growing AI visibility connector ecosystem.
Limitations: Less powerful for complex data modeling, limited to 1M rows per data source, fewer advanced visualization options than Power BI or Tableau.
Best for enterprise teams in Microsoft ecosystems. Power BI handles large-scale data modeling, complex DAX calculations, and role-based access control. If your AI search data lives in Azure or your organization standardizes on Microsoft tools, Power BI is the natural choice.
Strengths: Enterprise-grade data modeling, DAX for complex KPI calculations, deep Azure integration, robust access controls, handles large datasets.
Limitations: Steeper learning curve, licensing costs at scale, less intuitive sharing for external stakeholders.
Best for data storytelling and advanced visualization. Tableau excels at making complex trends readable, useful when you’re presenting AI search performance to executives who need to understand the narrative, not just the numbers.
Strengths: Superior visualization quality, strong data storytelling, handles complex data blends, excellent for executive presentations.
Limitations: Highest cost, requires more training, overkill for simple dashboards.
| Feature | Looker Studio | Power BI | Tableau |
|---|---|---|---|
| Cost (entry) | Free | Free (Desktop) | $70/user/month |
| Setup time | Hours | Days | Days |
| GA4/GSC native connectors | Yes | Via connector | Via connector |
| AI visibility tool connectors | Growing (Otterly, LLM Pulse) | Limited | Limited |
| Data modeling depth | Basic | Advanced | Advanced |
| Best for | Agencies, SMBs, Google-native teams | Enterprise, Microsoft shops | Data storytelling, executive reporting |
| Sharing | Link-based, embeddable | Power BI Service | Tableau Server/Cloud |
A well-structured dashboard tells a story. Each tab answers a specific question for a specific audience. Here is the layout that balances operator utility with executive clarity.
Place four to five headline KPI cards at the top: AI Visibility Score, Share of AI Voice, Citation Rate, AI Referral Traffic, and AI-Attributed Revenue. Each card shows the current value, the month-over-month change, and a sparkline trend. Below the cards, include a platform comparison bar chart showing mention rate and citation rate by AI engine, and a competitive share of voice horizontal bar chart. This tab answers the question: “How are we performing in AI search, at a glance?”
A stacked time-series chart shows brand mentions over time, split by platform (ChatGPT, Google AI Overviews, Perplexity, Gemini, Claude). Below it, a table breaks down prompt coverage, mention rate, and citation rate for each platform. This tab answers the question: “Which AI engines are surfacing our brand, and is that trending up or down?”
A horizontal bar chart ranks your brand and competitors by share of voice. A trend line shows how the competitive landscape has shifted over the last 6 months. A secondary table compares sentiment scores across competitors: are they being described more positively than you? This tab answers the question: “Are we winning or losing the AI visibility battle against our competitors?”
A table lists the top 20 URLs by citation count, with columns for AI traffic, conversion rate, and the AI platform citing each URL. This reveals which content assets AI engines trust most, and whether they’re the right assets. A secondary heatmap shows prompt category coverage, highlighting content gaps where you have no AI presence. This tab answers the question: “Which content is driving AI citations, and where are the gaps?”
A funnel visualization shows the progression from AI mentions to citations to clicks to conversions to revenue. Time-series charts track AI referral traffic by platform alongside AI conversion rate. A table connects AI-touched leads to pipeline stage and revenue. This tab answers the question: “Is AI visibility translating into business outcomes?”
A table of tracked prompts grouped by category, showing mention rate, citation rate, and trend direction for each. Color-coded conditional formatting highlights prompts where you’ve gained or lost visibility since the last period. This tab answers the question: “Which specific prompts and topics need attention?”
A dashboard that doesn’t drive action is just expensive wallpaper. Here is how to translate AI search KPIs into optimization priorities.
When your mention rate is low in a specific prompt category, investigate the content you have published for that topic. AI engines cite content that is structured, authoritative, and semantically comprehensive. A low mention rate in “best CRM for startups” suggests your content either doesn’t exist, isn’t structured for AI ingestion, or isn’t authoritative enough relative to competitors who are being cited.
Use the Content Performance tab to identify your highest-cited pages and your highest-value pages that have zero citations. The gap between these two lists is your optimization queue. Pages that already rank well in traditional search but aren’t cited by AI engines often need better structured data markup, more direct question-answer formatting, or fresher publication dates.
When a competitor’s share of voice is growing, run their cited URLs through the same visibility tools. What content formats are they using? How are they structuring their pages? Are they publishing comparison content that positions them favorably? Reverse-engineering competitor AI visibility reveals the content types and structural patterns that AI engines reward in your category.
Operational tip: Track the number of new AI citations gained and lost each week. This “citation churn” metric is a leading indicator of momentum. A net-positive churn rate means your content is increasingly being referenced; a net-negative rate signals that competitors are displacing you.
The AI visibility tool market has matured rapidly. Here is how the leading platforms compare:
| Tool | Platforms Tracked | Key Metrics | Pricing (Approx.) | Best For |
|---|---|---|---|---|
| Semrush AI Visibility | ChatGPT, Google AIO, Perplexity, Gemini | Mentions, citations, share of voice, sentiment | From $139.95/mo (add-on to Semrush) | Teams already using Semrush for SEO |
| Ahrefs Brand Radar | ChatGPT, Perplexity, Google AIO | Brand mentions, citation tracking | From $129/mo (add-on) | Teams already using Ahrefs |
| Profound | ChatGPT, Perplexity, Google AIO, Gemini, Claude | Citation rate, share of voice, sentiment, competitive | From $99/mo | Dedicated AI visibility, best UX |
| Otterly AI | ChatGPT, Google AIO, Perplexity, Gemini | Mentions, citations, Looker Studio connector | From $49/mo | Looker Studio integration, value |
| Peec AI | ChatGPT, Perplexity, Google AIO, Gemini | Citations, visibility score, content optimization | From $79/mo | GEO-focused teams |
| LLM Pulse | ChatGPT, Perplexity, Google AIO, Gemini, Claude | Mention rate, citation rate, sentiment, free Looker Studio template | Free tier available | Budget-conscious, quick setup |
| Bertology | ChatGPT, Perplexity, Gemini | Brand mentions, citation frequency | Custom pricing | Enterprise AI monitoring |
| GA4 (custom setup) | All AI referrers | Referral traffic, conversions, engagement | Free | Traffic measurement only, no visibility data |
Most teams will layer two tools: one dedicated AI visibility platform (Profound or Otterly for most use cases) and GA4 custom channels for traffic measurement. The visibility platform handles the “are we being cited?” question; GA4 handles the “are people clicking through?” question.
Several platforms now offer pre-built templates that accelerate dashboard creation:
Looker Studio: LLM Pulse offers a free Looker Studio template that connects to AI visibility data through their connector. It includes mention rate, citation rate, share of voice, sentiment monitoring, and competitor comparison tabs. Otterly’s Looker Studio connector similarly enables drag-and-drop dashboard creation with AI search data.
Power BI: Microsoft’s AI Performance Dashboard (available through Microsoft Advertising) provides a view into how your content is cited across generative AI platforms. For custom builds, the pipeline architecture described above (n8n → BigQuery → Power BI) gives you full control.
Notion/Google Sheets: For teams just starting, a simple Google Sheets tracker with 10-20 prompts, manually refreshed weekly, provides directional visibility without any tool investment. This is the right starting point for validating that AI search matters to your business before investing in dedicated tools.
A mention without a citation is brand awareness. A citation is authority. Treating them as equivalent inflates your perceived AI performance. Report them separately and prioritize improving citation rate: it’s the metric that correlates most directly with downstream traffic.
ChatGPT, Perplexity, Gemini, and Google AI Overviews serve different audiences, cite differently, and respond to different optimization signals. A single “AI visibility score” that averages across platforms hides the fact that you might be dominant on Perplexity but invisible on ChatGPT. Report per-platform data.
A 60% mention rate is meaningless if 40% of those mentions are negative or inaccurate. Sentiment analysis and source quality tracking are not optional: they are the difference between visibility that helps your brand and visibility that hurts it.
The fastest way to lose executive buy-in for AI search investment is to report visibility metrics in isolation. Always connect the visibility story to the revenue story. Even if the connection is directional rather than precise, showing the funnel (mentions to citations to traffic to pipeline to revenue) makes the business case.
If you change which prompts you track, you break your trend lines. Your measurement becomes unreliable. Version your prompt library. When you add prompts, run them alongside the existing set for at least one full cycle before retiring old prompts. This maintains data continuity.
Building a KPI dashboard for AI search performance is not a one-time project. It’s a living measurement system that evolves as AI platforms change, new tools emerge, and your competitive landscape shifts. But the foundation (the four-tier KPI framework, the standardized formulas, the automated data pipeline, and the six-tab dashboard layout) provides a stable architecture that adapts to change.
Start small. Pick 20 prompts that represent your highest-value customer questions. Track them manually for two weeks. Validate that AI visibility matters to your business. Then invest in the tools and pipeline that make measurement systematic. The brands that build this capability now will have years of trend data when their competitors are just starting to ask the right questions.
The search landscape has split. Your measurement system needs to cover both sides.
Arshia is an AI Workflow Engineer at FlowHunt. With a background in computer science and a passion for AI, he specializes in creating efficient workflows that integrate AI tools into everyday tasks, enhancing productivity and creativity.

Am I Cited supplies the citation rate, share of voice, and sentiment metrics your AI performance dashboard needs, tracked across ChatGPT, Perplexity, and Google AI Overview and exportable to your BI tool.
Learn how to build effective AI visibility dashboards to monitor your brand across ChatGPT, Perplexity, and Google AI Overviews. Best practices for GEO reportin...

Learn how to build effective AI visibility KPI dashboards to track brand mentions, citations, and performance across ChatGPT, Google AI Overviews, Perplexity, a...
Measure AI search visibility with citation rate, visibility score, share of voice and AI referral traffic in GA4.
Cookie Consent
We use cookies to enhance your browsing experience and analyze our traffic. See our privacy policy.