



Share of Voice Calculation for AI Search
Learn how to calculate Share of Voice for AI search platforms. Discover the formula, tools, and strategies to measure your brand's visibility in ChatGPT, Perple...
11 min read

What AI share of voice means, the three formulas for calculating it, and a step-by-step framework for tracking it across ChatGPT, Perplexity, and Google AI Overviews.
If a buyer asks ChatGPT “what’s the best CRM for small teams” and your brand isn’t mentioned, you don’t exist to that buyer. It doesn’t matter if you rank first on Google for the same query. The decision happens inside the AI’s answer, and if you’re not there, you lost.
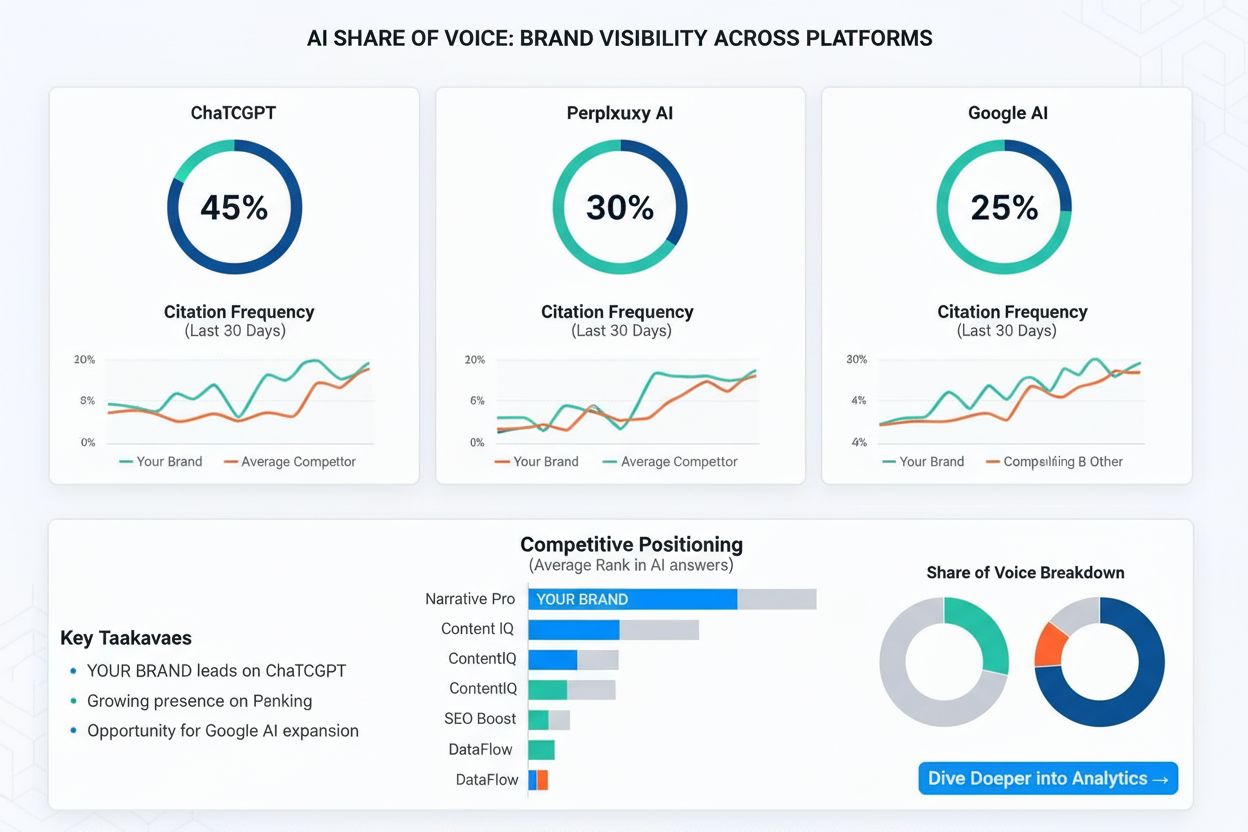
That’s the fundamental shift driving AI share of voice (AI SOV), a metric that measures how often your brand appears in AI-generated answers compared to competitors, across platforms like ChatGPT, Perplexity, Gemini, and Google AI Overviews.
Traditional SEO metrics like keyword rankings and organic click-through rates capture what happens on search engine results pages. They don’t tell you whether an AI model named your brand when a buyer asked for a recommendation. AI SOV fills that gap.
This guide is a measurement deep-dive: what AI share of voice actually is, the exact formulas for calculating it, and a step-by-step framework for tracking it reliably over time. If you’ve already got a handle on the definition and you’re looking for the tactics to actually move the number against named competitors, see our competitive playbook for growing your AI share of voice instead.
Bottom line: AI SOV is a trackable metric, and tools like Am I Cited make it easy to monitor your share against competitors across ChatGPT, Perplexity, and Google AI Overviews so you can measure the trend instead of guessing at it.
AI share of voice is the percentage of AI-generated responses, across a defined set of category-relevant prompts and platforms, where your brand is mentioned, cited, or recommended, relative to all brand mentions in those same responses.
The metric answers a straightforward question: when people ask AI assistants about your category, how often does your brand become part of the answer?
This distinction matters. Many tools report a presence rate (the percentage of prompts where your brand appeared) and call it share of voice. That’s misleading.
Presence rate tells you whether you showed up. Share of voice tells you how much of the total conversation you owned.
Consider this scenario: you track 100 prompts and your brand appears in 30 of them. A presence rate would report 30%. But if four competitors also appeared in every one of those same responses, your real share of voice is closer to 6%, because the denominator must include all brands the AI mentioned, not just your own appearances.
The correct formula:
AI SOV = (Your brand mentions ÷ Total brand mentions across all responses) × 100
Every brand the AI names in any response contributes to the denominator, whether you expected them there or not. This open-denominator approach is what separates accurate measurement from inflated vanity numbers.
Three structural changes in how people find information make AI share of voice urgent:
Zero-click decisions. When users ask AI assistants for recommendations, they receive a synthesized answer with a short list of options. If your brand is on that list, you’re in the consideration set. If not, the user moves on without ever visiting your website. Research from Digital Applied found that AI search visits grew 42.8% year-over-year between Q1 2025 and Q1 2026, from 15.6 billion to 27.4 billion visits. That traffic goes to the brands inside the answers.
The funnel collapsed. Traditional SOV measured awareness across a long, multi-touch journey. AI SOV measures presence at the moment of decision. A single AI response can replace an entire research phase. The awareness-to-conversion path that traditional SOV tracked across weeks can now collapse to one prompt and one answer.
Volatility rewards monitoring. AI models update their training data, retrieval sources, and response generation logic continuously. A brand that dominates citations in ChatGPT this month can drop out of answers entirely next month if a competitor publishes stronger content or earns better third-party coverage. Unlike traditional SEO rankings, which typically move over weeks or months, AI citation patterns can shift within days.

Track how AI chatbots mention your brand across ChatGPT, Perplexity, and other platforms.
Not all AI visibility is equal. Leading measurement frameworks distinguish three layers of brand presence in AI-generated answers, each with different implications for what you should track.
What it measures: How often the AI explicitly types your brand name as a recommendation or example.
Mention share is the broadest layer. It captures whether your brand is part of the conversation at all. A brand with high mention share but low citation share is visible but not driving referral traffic: the AI is aware of the brand from training data or third-party sources but isn’t linking to its website.
What it measures: How often the AI provides a clickable hyperlink back to your domain in footnotes or inline text.
Citation share is the layer that drives measurable traffic. When Perplexity or ChatGPT cites your URL as a source, users can click through to your site. According to TrustRadius’s 2025 B2B buying disconnect study, 90% of buyers who saw Google AI Overviews clicked at least one cited source. Citation share is the metric most directly connected to referral traffic and, ultimately, revenue.
Citation share is also the hardest to influence. Earning a citation requires the AI to treat your content as authoritative enough to reference explicitly, not just to recall your brand name from its training data.
What it measures: How your brand is described: as a positive recommendation, a neutral benchmark, or a negative example.
Sentiment adds qualitative depth that raw mention counts miss. Being mentioned as “the best option for enterprise teams” versus “an expensive alternative to consider” are materially different outcomes, even if both count as a mention. Some tools now track sentiment classification alongside mention counts, and for competitive intelligence, this layer is often the most actionable.
A practical framework for weighting these layers:
| Layer | What It Captures | Strategic Value | Difficulty to Influence |
|---|---|---|---|
| Mention share | Brand name appears in AI answers | Broadest visibility signal | Moderate |
| Citation share | Your URL is linked as a source | Drives referral traffic and authority | High |
| Sentiment & context | How the AI describes your brand | Reveals positioning vs. competitors | Highest |
For most teams, the right approach is to track all three layers but prioritize the ones that align with your goals. If you’re building awareness, mention share is your primary metric. If you’re driving traffic and conversions, citation share matters more. If you’re refining positioning, sentiment analysis is essential.
The shift from traditional SEO metrics to AI SOV isn’t incremental, it’s structural. The underlying mechanics of how visibility is earned and measured are fundamentally different.
| Dimension | Traditional SEO Share of Voice | AI Share of Voice |
|---|---|---|
| What it measures | Keyword rankings, SERP impressions, estimated traffic share | Brand mentions, citations, and recommendations in AI-generated answers |
| Where it’s measured | Google and Bing search results pages | ChatGPT, Perplexity, Gemini, Claude, Google AI Overviews, Copilot |
| Unit of analysis | Individual keywords | Complete user prompts and conversations |
| Outcome | One ranking position per query | Multiple brands can appear in a single answer |
| Success signal | Ranking in position 1–3 | Being included and prominently cited |
| Measurement cadence | Daily ranking checks | Weekly or monthly prompt runs (responses vary between sessions) |
| Primary data source | Rank tracking tools, Search Console | Prompt-based audits, specialized AI SOV platforms |
The most important difference is the relationship between effort and visibility. In traditional SEO, improving your ranking for a keyword typically requires months of content development, link building, and technical optimization. In AI search, a single well-structured piece of content published on a high-authority domain can earn citations across multiple AI platforms within weeks, and a competitor doing the same can displace you just as quickly.
Get the latest insights on AI mentions, brand monitoring, and optimization strategies.
There are three formulas, each measuring a different dimension of AI visibility. Using the right one, and understanding what it does and doesn’t capture, is the difference between actionable data and misleading numbers.
AI SOV (Mentions) = (Your brand mentions ÷ Total brand mentions across all tracked responses) × 100
This is the most widely used formula. It treats every brand mention equally, regardless of position or sentiment.
Example: You track 50 prompts across ChatGPT, Perplexity, and Gemini. Across all responses, the AI mentions brands 300 times. Your brand appears 45 times. Your mention-based AI SOV is 15%.
Use this formula when you need a broad, comparable metric that works across platforms and prompt sets. It’s the best starting point for most teams.
AI SOV (Citations) = (Your domain citations ÷ Total domain citations across all tracked responses) × 100
This formula counts only responses where the AI provides a clickable link to your domain. It’s the metric most directly tied to referral traffic.
Example: Across the same 50 prompts, the AI cites domains 180 times in footnotes or inline links. Your domain is cited 27 times. Your citation-based AI SOV is 15%.
Citation-based SOV is almost always lower than mention-based SOV, because AIs mention more brands than they cite. This is the metric to prioritize if your goal is driving traffic from AI platforms.
Position-Weighted AI SOV = Σ (Brand mention × Position weight) ÷ Total weighted mentions across all responses
This formula assigns higher weights to brands mentioned earlier in an AI response. Being the first brand recommended in a “best tools for X” list carries more influence than being the fifth.
A common weighting scheme: first mention = 1.0, second = 0.8, third = 0.6, fourth and beyond = 0.4. The specific weights are less important than the consistency with which you apply them.
Example: Your brand is mentioned first in 10 responses (10 × 1.0 = 10), second in 15 responses (15 × 0.8 = 12), and third in 20 responses (20 × 0.6 = 12). Your weighted score is 34. If the total weighted mentions across all brands is 200, your position-weighted AI SOV is 17%.
Position-weighted SOV is the most sophisticated metric but also the most complex to calculate manually. Automated tools handle this best.
Start with mention-based AI SOV. It’s the simplest to calculate, the easiest to explain to stakeholders, and the most comparable across tools and platforms. Add citation-based SOV when you’re ready to connect AI visibility to traffic data. Add position-weighted SOV when you need to differentiate between surface-level mentions and influential recommendations.
A common mistake is reporting presence rate as share of voice. The formula for presence rate is (Prompts where your brand appeared ÷ Total prompts tracked) × 100. This tells you about reach, not share. If your brand appears in 30 of 100 prompts but four other brands appear in every one of those same prompts, your presence rate is 30% but your true share of voice is approximately 6%. Always confirm which metric you’re looking at.
Tracking AI SOV requires a systematic approach. AI responses are non-deterministic: the same prompt can produce different answers across sessions, platforms, and time. Without a consistent methodology, your data won’t be comparable month over month.
Your prompt set is the foundation of your entire measurement program. If it doesn’t reflect how your actual customers search, your SOV data won’t reflect your actual competitive position.
Size: Aim for 50–200 prompts. Fewer than 50 and your data won’t be statistically meaningful. More than 200 and manual tracking becomes unsustainable. Start with 50 and expand as you automate.
Structure by buyer journey stage:
Structure by prompt type:
Include prompts where your brand should logically appear, prompts where competitors currently dominate, and prompts that represent emerging topics in your category. The goal is a representative sample of your market’s AI search behavior, not a curated list designed to flatter your numbers.
Track across at least three platforms to capture the diversity of AI search behavior. Each platform has different retrieval sources, ranking algorithms, and response patterns.
| Platform | Key Characteristics | Source Behavior |
|---|---|---|
| ChatGPT | Largest user base; draws from Bing/Google index via SerpAPI | Weights consistent cross-web mentions; responses vary between sessions |
| Perplexity | Strong citation transparency; popular for research queries | 3-layer reranking model; weights recency heavily; citation patterns shift faster |
| Gemini | Integrated with Google’s index and YouTube | Favors brands with strong Google authority and video content |
| Claude | Strong reasoning; growing enterprise adoption | Source attribution varies by model version |
| Google AI Overviews | Appears above traditional search results | Draws from Google’s index; favors authoritative, structured content |
For manual tracking (bootstrapped approach):
For automated tracking (recommended for scale):
Dedicated AI SOV platforms run your prompt set across multiple LLMs on a schedule, log results, and provide dashboards with competitor benchmarking. They eliminate the manual effort and, critically, reduce the inconsistency that comes from ad-hoc prompt execution.
AI responses change over time. Measuring once and calling it done is meaningless. A consistent cadence reveals trends:
AI SOV tells you what’s happening inside AI answers. Referral traffic data tells you whether it’s driving results. In Google Analytics 4, monitor referral traffic from domains like chatgpt.com, perplexity.ai, claude.ai, and copilot.microsoft.com. If your citation share is increasing but referral traffic is flat, investigate whether your citations are visible enough to drive clicks.
The market for AI share of voice tools has matured rapidly. Here’s how the major options compare across key dimensions.
| Tool | Best For | Platforms Tracked | Key Feature | Starting Price |
|---|---|---|---|---|
| Semrush AI Visibility Toolkit | SEO teams already using Semrush | ChatGPT, Google AI Mode, Perplexity | Brand Performance report with competitor benchmarking | Included in Semrush plans ($139.95+/mo) |
| HubSpot AEO | Inbound marketing teams | ChatGPT, Perplexity, Gemini | Free AI Search Grader; prompt suggestions based on industry | Free tier available; premium on HubSpot plans |
| OptimizeGEO | GEO-focused teams | ChatGPT, Gemini, Claude, Perplexity, Copilot, DeepSeek | Position-weighted SOV across 7+ models | Paid (custom pricing) |
| Slate | B2B SaaS teams | ChatGPT, Perplexity, Gemini, Google AI Overviews | Combines measurement with content action layer | Paid (custom pricing) |
| Nightwatch | SEO agencies | ChatGPT, Perplexity, Google AI Mode, AI Overviews | Automated sentiment and position tracking | Paid (from ~$39/mo) |
| Waikay | Enterprise brand teams | ChatGPT, Perplexity, Gemini | Open-denominator SOV; rigorous methodology | Paid (custom pricing) |
| Foglift | Mid-market teams | ChatGPT, Perplexity, Gemini, Claude | Step-by-step framework; benchmarks by industry | Paid (from ~$29/mo) |
| Profound | Enterprise visibility tracking | Multiple LLMs | Overall visibility score, SOV, and average position | Custom enterprise pricing |
Manual tracking works if:
Automated tracking is necessary if:
The manual approach is a valid starting point. But as your prompt set grows and tracking cadence increases, the time cost of manual measurement quickly exceeds the financial cost of a tool.
Even experienced teams make these errors. Avoiding them will save you from building a measurement program on unreliable data.
As covered earlier, presence rate (prompts where you appeared ÷ total prompts) and share of voice (your mentions ÷ total mentions) are different metrics. Most free tools report presence rate. Confirm which metric you’re looking at before presenting numbers to stakeholders.
If your tool asks you to pre-select competitors, your SOV is measured inside a pool you built, not the one the AI actually produces. The AI may mention brands you didn’t think to track, and those brands legitimately own part of the total share. An open denominator captures reality.
A 10-prompt panel is not statistically meaningful. A single prompt where your brand happens to appear or not appear can swing your SOV by 10 percentage points. Start with at least 50 prompts. Statistical reliability improves with sample size.
AI responses are non-deterministic. A single run of your prompt set is a snapshot with a margin of error. The value of AI SOV emerges from trends over time: is your share increasing, decreasing, or flat? Run your prompt set at least twice per measurement period and average the results.
Your aggregate AI SOV across all platforms can mask significant variation. A brand might have 30% SOV on ChatGPT and 5% on Perplexity. The aggregate (say, 18%) hides the fact that you’re invisible on a platform that drives substantial traffic for your category. Always track per-platform SOV alongside the aggregate.
There is no universal “good” AI SOV score. It depends on your category, the number of competitors, and the maturity of your GEO program. That said, a few benchmarks provide context:
The most useful benchmark is your own historical data. Track your AI SOV monthly, compare against your top 3–5 competitors, and focus on the trend. A SOV that’s increasing month over month, even if the absolute number is modest, signals that whatever you’re doing is working, and how you actually grow it is a separate question from how you measure it.
Everything above tells you how to arrive at a trustworthy number. It doesn’t tell you what to do when that number is lower than a competitor’s. Growing your share is a distinct discipline: it means earning more third-party mentions, publishing content that AI models choose to cite over a rival’s, and deliberately targeting the prompts where named competitors currently win. That’s the subject of our companion piece, a competitive playbook for increasing your AI share of voice , which walks through tactics for each type of competitor you’re likely facing.
AI share of voice is not a replacement for traditional SEO metrics. It’s a complement, one that captures visibility in the channels where an increasing share of buyer research happens. The brands that measure it correctly now, while the frameworks are still maturing, will have a structural advantage over those that wait until it’s standard practice.
The practical next steps:
AI SOV answers a question that didn’t exist five years ago but is now one of the most important in marketing: when people ask AI about your category, how often does your brand become part of the answer?
Arshia is an AI Workflow Engineer at FlowHunt. With a background in computer science and a passion for AI, he specializes in creating efficient workflows that integrate AI tools into everyday tasks, enhancing productivity and creativity.

Am I Cited measures your AI share of voice against competitors across ChatGPT, Perplexity, and Google AI Overview, so you can see who's winning the answer, and whether you're gaining ground.
Learn how to calculate Share of Voice for AI search platforms. Discover the formula, tools, and strategies to measure your brand's visibility in ChatGPT, Perple...
AI Share of Voice measures brand visibility in AI-generated responses. Learn how to track, calculate, and improve your presence across ChatGPT, Perplexity, and ...

Learn what Share of AI Voice is, how it's calculated, and why it matters for your brand's visibility in ChatGPT, Perplexity, and Google AI Overviews. Discover s...
Cookie Consent
We use cookies to enhance your browsing experience and analyze our traffic. See our privacy policy.