


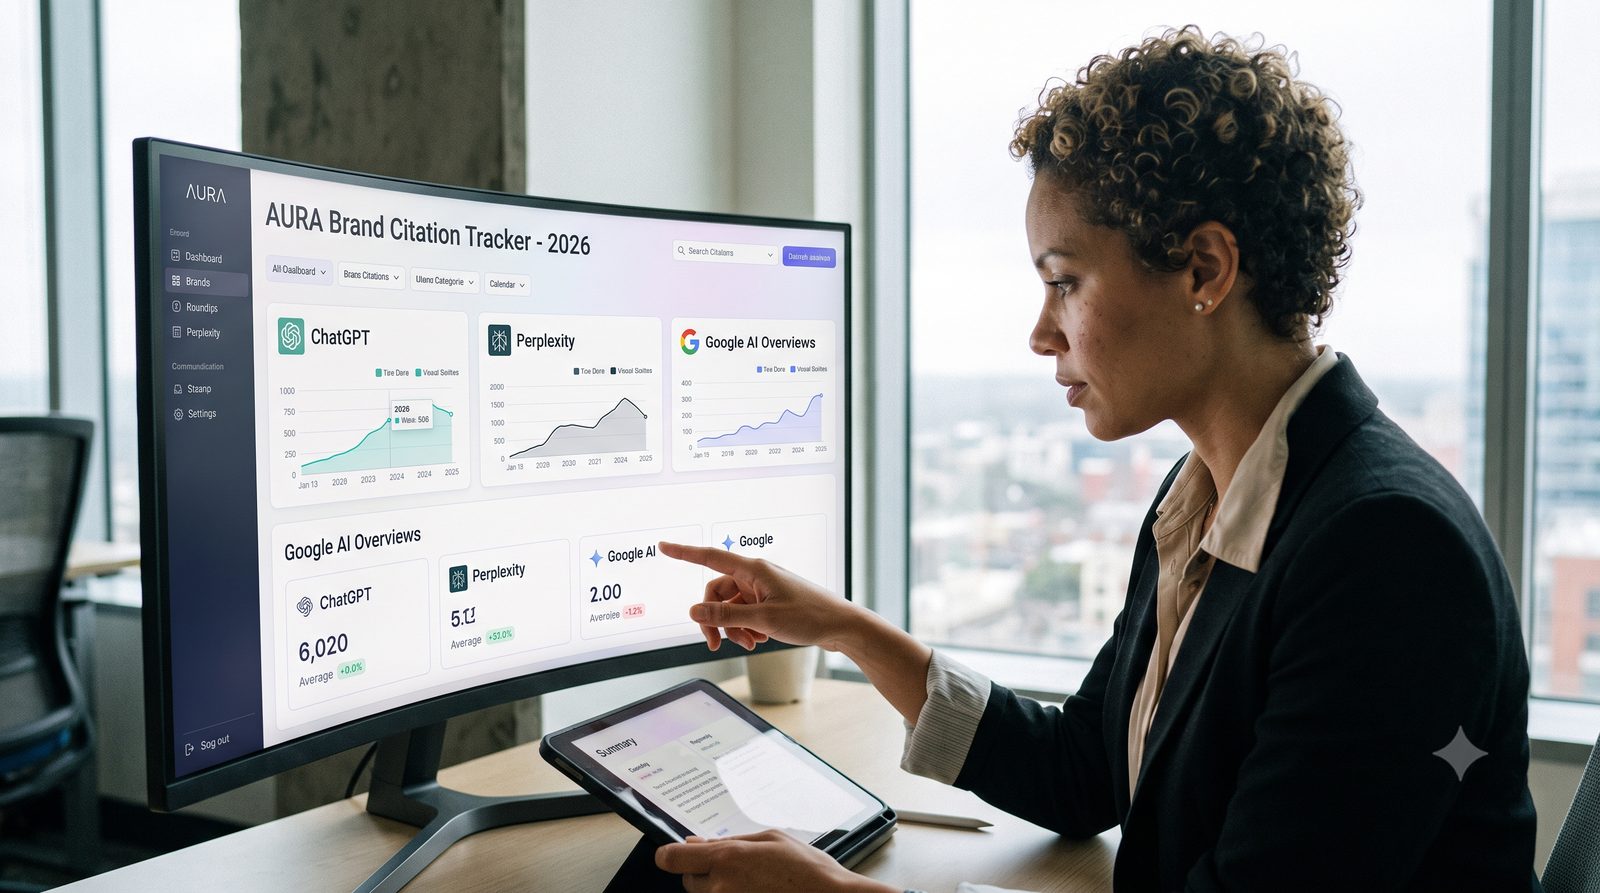
AI Citation Tracking Tools: A 2026 Guide
Complete comparison of the best AI citation tracking tools for 2026. Learn how to monitor your brand across ChatGPT, Perplexity, and Google AI Overviews, choose...
16 min read

A repeatable framework to measure AI search visibility across ChatGPT, Perplexity, and Google AI Overviews. Track citations, share of voice, and ROI with concrete metrics, dashboards, and a cadence for turning data into action.
Bottom line: Build a repeatable weekly-monthly-quarterly cadence around a stable prompt library, using a dedicated tracking tool such as AmICited or a spreadsheet-based DIY system, so AI visibility data consistently turns into content and authority-building action.
Your brand ranks #1 on Google for target keywords. Traffic is solid. Then you discover ChatGPT, Gemini, and Perplexity never mention your brand when answering questions you’ve dominated in traditional search for years. Welcome to the invisible gap.
This is the new reality of search in 2026. While traditional SEO dashboards show rankings and clicks, they’re blind to something far more valuable: whether your content is cited, mentioned, and recommended inside AI-generated answers. Users increasingly bypass the blue-link ranking page entirely, getting answers directly from AI systems. If your brand isn’t visible there, you’re invisible, even if you rank #1.
The problem isn’t that AI search visibility is unmeasurable. The problem is that most teams lack a repeatable, structured framework to track it over time, understand what’s working, and optimize systematically.
This guide provides exactly that: a complete system for measuring AI search visibility across all major platforms, establishing baselines, setting up dashboards, and closing the loop between measurement and action. Whether you’re starting from scratch or refining an existing approach, this framework will help you turn opaque AI answers into measurable, actionable visibility data.

Track how AI chatbots mention your brand across ChatGPT, Perplexity, and other platforms.
In traditional SEO, visibility is straightforward: your site ranks at position 3 for a keyword, users click your result, and you see the traffic in Google Analytics. The ranking position directly correlates to visibility and clicks.
AI search breaks this model entirely.
When a user asks ChatGPT, “What’s the best project management tool?” the system generates a single synthesized answer, often citing 3–5 sources without a visible ranking order. Your content might be the primary source of that answer (influencing every word), yet users see no ranking, no clickable link, and no obvious attribution. In Google’s case, AI Overviews appear at the top of search results but rarely show a clear ranking list; instead, they pull from multiple sources and blend them into a summary.
This is the visibility gap: your content shapes the answer, but traditional dashboards report zero visibility because there’s no ranking position to track.
The mechanics are fundamentally different:
Traditional Search:
AI Search:
In traditional search, you measure success by ranking position. In AI search, you measure success by whether your content is included, cited, and how prominently it influences the answer.
AI search visibility requires different metrics because the user journey is different. A user finding you through an AI citation may never click your site, yet that citation is valuable for brand awareness, authority, and future discovery. Conversely, a user might click through from an AI answer, but GA4 will attribute that traffic to a referrer (ChatGPT, Perplexity, etc.), not to the specific query or prompt.
Traditional SEO tools don’t capture:
You need a framework that tracks these AI-specific signals separately, then connects them back to business outcomes (traffic, conversions, brand awareness).
| Metric | Traditional SEO | AI Search Visibility |
|---|---|---|
| Primary Signal | Ranking position (1–100) | Citation frequency, mention rate |
| User Journey | Click-through from SERP | Direct answer consumption, optional click-through |
| Visibility Definition | Position in ranked list | Inclusion in synthesized answer |
| Competitive View | Your rank vs. others | Your mentions vs. competitors in same answer |
| Attribution | Clear: user clicked your result | Complex: citation + optional click-through |
| Dashboard Focus | Rank, impressions, CTR | Citations, share of voice, sentiment |
To build a measurement system, you need to understand the metrics that matter. These fall into five categories: visibility, citations, authority, traffic & conversions, and sentiment.
Brand Mention Rate: the percentage of AI responses (across your tracked prompts) that mention your brand by name or reference your product.
(Responses mentioning your brand / Total responses evaluated) × 100Presence Coverage: how many of your target prompts trigger a response that includes your brand.
(Prompts where you appear / Total prompts in your library) × 100Citation Rate: the percentage of AI responses that explicitly cite your domain as a source (not just mention your brand).
(Responses citing your domain / Total responses evaluated) × 100Share of Voice (SoV): your citations divided by total citations from all sources in the same set of prompts.
(Your citations / Total citations from all sources) × 100Citation Quality Score: a weighted measure of citation prominence and source credibility.
Authority Score: a composite of domain authority, content freshness, and coverage depth.
Content Coverage Depth: how thoroughly your content covers the topics that AI systems ask about.
AI-Driven Sessions: visits to your site from AI search referrers (ChatGPT, Perplexity, Google, Gemini, etc.).
AI Conversion Rate: conversions from AI-driven traffic divided by AI sessions.
(Conversions from AI traffic / AI sessions) × 100Downstream Impact: longer-term effects like email signups, content engagement, or brand awareness from AI-driven visitors.
Mention Sentiment: the tone of your brand mentions: positive, neutral, or negative.
Get the latest insights on AI mentions, brand monitoring, and optimization strategies.
Effective AI search visibility measurement rests on five pillars. Understanding each helps you build a comprehensive framework.
Citations are the foundation of AI visibility. When an AI system cites your domain, it signals that your content is authoritative and valuable enough to be a primary source.
What to track:
Why it matters: Citations drive authority, potential traffic, and brand credibility. They’re the most measurable signal of visibility.
Target benchmarks:
Not every mention is a citation. Sometimes AI systems reference your brand by name without linking to your site. These mentions still build brand awareness and signal visibility.
What to track:
Why it matters: Brand mentions build awareness even without a clickable link. Over time, they influence brand recall and search behavior.
Target benchmarks:
AI systems prioritize authoritative sources. The more your domain is recognized as an expert, the more likely you’ll be cited.
What to track:
Why it matters: Authority is the foundation for citations. Improving it creates a flywheel: more citations → more visibility → more authority.
Target benchmarks:
Visibility is only valuable if it drives business outcomes. Track how AI-driven visitors engage with your site.
What to track:
Why it matters: Links visibility to revenue. Shows ROI of AI search optimization.
Target benchmarks:
Share of voice shows how you stack up against competitors in the same prompts.
What to track:
Why it matters: Shows competitive position and identifies opportunities to gain ground.
Target benchmarks:
| Pillar | Metric | Formula | Benchmark |
|---|---|---|---|
| Citations | Citation Rate | (Responses citing you / Total responses) × 100 | 40%+ |
| Citations | Share of Voice | (Your citations / Total citations) × 100 | 25%+ |
| Mentions | Brand Mention Rate | (Responses mentioning you / Total responses) × 100 | 50%+ |
| Authority | Domain Authority | Tool-based score | 30+ (healthy), 40+ (competitive) |
| Traffic | AI Sessions | Sessions from AI referrers | 5–10% of organic |
| Voice | Competitive SoV | Your SoV vs. top 3 competitors | 25%+ |
Before you can measure, you need a solid foundation: a stable set of prompts, consistent data collection, and a way to normalize data across different AI engines.
Your prompt library is the backbone of your measurement system. It’s a curated set of 40–60 high-value queries that you’ll run consistently (weekly or monthly) against each AI engine.
Types of prompts to include:
Branded Prompts (10–15):
Product Category Prompts (10–15):
Problem Statement Prompts (10–15):
Comparison Prompts (5–10):
Why this matters: Consistency is critical. If you change prompts mid-month, you can’t compare trends. Lock in your library and only update quarterly.
| Prompt Type | Examples | Count | Purpose |
|---|---|---|---|
| Branded | “What is [Brand]?”, “[Brand] vs. competitors” | 12 | Direct brand visibility |
| Category | “Best [category] tools”, “[Category] best practices” | 15 | Organic discovery |
| Problem | “How to solve [problem]”, “Tools for [use case]” | 15 | Intent-based discovery |
| Comparison | “[Brand] vs. [Competitor]”, “Alternatives to X” | 8 | Competitive positioning |
| Total | N/A | 50 | N/A |
Before you can measure progress, you need a baseline: a snapshot of where you stand today.
Baseline period: Run your entire prompt library against all target AI engines for 4–8 weeks. Record:
Why 4–8 weeks? AI engines update their training data and rankings regularly. A single week might be anomalous. Four weeks gives you enough data to smooth out noise.
Baseline outputs:
This baseline becomes your reference point. Every future measurement is compared to it.
You need a systematic way to capture AI responses and extract the data you need.
Manual approach (for small teams):
Structured logging template:
|Prompt ID | Engine | Date | Response | Citations Found | Citation URLs | Mentions | Sentiment | Notes|
|P001 | ChatGPT | 2026-01-07 | [full response] | 2 | domain1.com, domain2.com | [Brand] mentioned 1x | Positive | [notes]|
Automated approach (for larger teams):
Why this matters: Consistent data collection is non-negotiable. If your process changes, your trends become incomparable.
Each AI engine has different citation formats, response styles, and update frequencies. You need a way to compare them fairly.
Normalization approach:
Define what “citation” means for each engine:
Standardize your metrics:
Account for engine differences:
The final step is linking AI visibility to business outcomes. You need to know which AI-driven visitors convert and take action.
GA4 setup:
Tag AI referrers:
https://yoursite.com/product?utm_source=ai&utm_medium=citation&utm_campaign=chatgptTrack AI sessions:
Connect to CRM:
Example GA4 dashboard:
| Dimension | Sessions | Conversion Rate | Avg. Session Duration | Bounced |
|---|---|---|---|---|
| ChatGPT | 145 | 8.3% | 2:34 | 32% |
| Perplexity | 89 | 11.2% | 3:12 | 28% |
| Google AI | 234 | 6.1% | 1:58 | 41% |
| Gemini | 67 | 9.0% | 2:45 | 35% |
| Total AI | 535 | 8.1% | 2:32 | 34% |
Measurement without action is useless. You need a cadence (a repeating rhythm of data collection, analysis, and decision-making) and governance (clear ownership and accountability).
Tasks (1–2 hours/week):
Owner: AI Visibility Analyst or Marketing Operations
Output: Weekly snapshot showing:
Escalation threshold: If citation rate drops >20% WoW or share of voice drops >5% WoW, escalate to the strategy owner.
Tasks (4–6 hours/month):
Owner: SEO/Content Strategy Lead
Output: Monthly report showing:
Key questions to answer:
Tasks (8–10 hours/quarter):
Owner: VP Marketing / Head of SEO / Content Director
Output: Quarterly strategy document showing:
Key decisions to make:
For this system to work, someone needs to be accountable.
Role definitions:
| Role | Responsibility | SLA |
|---|---|---|
| AI Visibility Analyst | Weekly prompt runs, data logging, dashboard updates | Weekly report by Friday EOD |
| Content Strategy Lead | Monthly analysis, gap identification, content planning | Monthly report by 5th of month |
| SEO/Link Lead | Authority building, link strategy | Quarterly strategy update |
| Analytics Owner | GA4 setup, AI traffic attribution, conversion tracking | Monthly GA4 report by 5th |
| Executive Sponsor | Quarterly review, goal setting, budget decisions | Quarterly strategy review |
Escalation thresholds:
Meeting cadence:
Data is worthless if it’s not visible. A good dashboard makes trends obvious and prompts action.
Your primary dashboard should answer: Are we visible in AI? How do we compare to competitors?
Metrics to display:
Citation Rate (primary metric)
Brand Mention Rate
Share of Voice (vs. top 3 competitors)
AI Traffic (sessions/week)
Sentiment Breakdown
View 2: Citation Quality & Position
View 3: Content Performance
View 4: Competitive Analysis
View 5: Prompt Performance
Set up alerts to catch problems early:
| Alert | Threshold | Action |
|---|---|---|
| Citation rate drop | >20% WoW | Investigate immediately; check if AI engines updated |
| Share of voice drop | >5% WoW | Analyze competitor movement; check for content gaps |
| New competitor entry | Competitor enters top 3 | Competitive analysis; content refresh |
| Negative sentiment spike | >10% of mentions negative | Review and address misconceptions |
| AI traffic decline | >15% WoW | Check GA4 referrer data; verify tool accuracy |
For C-Suite (monthly):
For Content Team (monthly):
For Product Team (quarterly):
Measurement is only valuable if it drives action. The closed-loop system connects data to decisions to outcomes.
Step 1: Measure
Step 2: Analyze
Step 3: Act
Step 4: Re-Measure
Step 5: Iterate
Scenario 1: Citation Rate Drops
Situation: Citation rate was 45%; now 32%. Share of voice down 8%.
Analysis:
Action:
Re-Measure: Check citation rate in 4 weeks
Scenario 2: Share of Voice Increases
Situation: SoV was 22%; now 31%. Competitor A dropped from 38% to 29%.
Analysis:
Action:
Re-Measure: Continue tracking; monitor if competitor recovers
Scenario 3: AI Traffic Increases But Conversion Rate Drops
Situation: AI sessions up 40%, but conversion rate down from 9% to 6%.
Analysis:
Action:
Re-Measure: Track conversion rate weekly; target return to 8%+ in 4 weeks
Scenario 4: Negative Sentiment Spike
Situation: Negative mentions up from 4% to 12% of all mentions.
Analysis:
Action:
Re-Measure: Track sentiment weekly; target return to <5% negative in 8 weeks
You have three options: specialized AI visibility platforms, general SEO tools with AI features, or a DIY approach.
These tools automate prompt running and citation extraction.
| Platform | Best For | Cost | Pros | Cons |
|---|---|---|---|---|
| Otterly | Comprehensive AI tracking | $29–489/mo | Full-stack, citation extraction, sentiment | Newer platform, limited integrations |
| Peec AI | Citation tracking + insights | €85–425/mo | Citation quality scoring, competitor tracking | Smaller team, less historical data |
| Nightwatch | AI + traditional SEO | €79–399/mo | Unified platform, SERP features | Less AI-specific depth |
| Conductor | Enterprise tracking | Custom | Scalable, mentions + citations, workflow | Expensive, complex setup |
| SE Ranking | Budget-friendly tracking | $99–399/mo | Affordable, basic AI tracking, GA4 integration | Limited AI-specific features |
Recommendation for different team sizes:
Established SEO platforms are adding AI visibility features.
| Tool | AI Features | Cost |
|---|---|---|
| Semrush | AI visibility tracking, AIO detection | $139–549/mo |
| Ahrefs | AI overview tracking, competitor analysis | $129–999/mo |
| Brainlabs | AI visibility dashboards, prompt management | Custom |
| SEO Clarity | AIO detection, AI search framework | Custom |
Advantage: If you already use these tools, adding AI tracking is seamless.
Disadvantage: AI features are often bolt-ons, not core to the platform.
For teams with limited budget or willing to invest time:
Tools needed:
Process:
Cost: $0 (if you use free GA4 and Sheets)
Time: 2–3 hours/week for data collection and analysis
Pros: Full control, no vendor lock-in, low cost
Cons: Manual, time-consuming, prone to errors, hard to scale
Recommendation: DIY works for 1–2 people or as a starting point. Once you have 10+ prompts or need daily tracking, invest in a tool.
Ready to start? Here’s how to launch in 4 weeks.
Questions to answer:
Which AI engines matter most?
Which regions/languages?
What’s your business goal?
What’s your baseline traffic/revenue impact?
Output: 1-page scope document defining engines, regions, goals, and success metrics.
Create 40–60 prompts across four categories:
Branded (12–15):
Category (12–15):
Problem (12–15):
Comparison (8–10):
Output: Spreadsheet with all prompts, organized by type.
Option A: DIY + Spreadsheets
Option B: Specialized Tool
Option C: GA4 + Custom Events
Output: Working tracking system (manual or automated).
Baseline period (4 weeks):
Dashboard creation:
Output: Baseline metrics + working dashboard.
Create a runbook:
| Task | Owner | Frequency | Time | Deliverable |
|---|---|---|---|---|
| Run prompts & log data | AI Analyst | Weekly | 1.5 hrs | Weekly snapshot |
| Update dashboard | AI Analyst | Weekly | 0.5 hrs | Dashboard refresh |
| Monthly analysis | Content Lead | Monthly | 3 hrs | Monthly report |
| Quarterly strategy | Strategy Lead | Quarterly | 4 hrs | Quarterly plan |
Schedule:
Output: Documented runbook, assigned owners, scheduled meetings.
Learn from others’ mistakes.
The problem: You change prompts mid-month, making data incomparable.
Why it happens: Temptation to optimize prompts or add new ones as you learn.
How to avoid:
The problem: You start tracking but have nothing to compare to, making trends meaningless.
Why it happens: Impatience, wanting to see results immediately.
How to avoid:
The problem: You try to track 10 engines, spreading effort too thin, and get incomplete data.
Why it happens: FOMO, fear of missing out on emerging platforms.
How to avoid:
The problem: You track citations but can’t tie them to traffic or conversions.
Why it happens: Technical complexity, GA4 setup is hard.
How to avoid:
The problem: Data rots; no one takes action on findings; measurement becomes a checkbox exercise.
Why it happens: Unclear ownership; no accountability; findings don’t lead to decisions.
How to avoid:
Let’s walk through a real example to show how this all comes together.
Setup:
Weekly runs:
Baseline metrics:
Analysis:
Plan for Month 3:
Execution:
Measurement (end of month 3):
Analysis:
Month 4 plan:
Arshia is an AI Workflow Engineer at FlowHunt. With a background in computer science and a passion for AI, he specializes in creating efficient workflows that integrate AI tools into everyday tasks, enhancing productivity and creativity.

Am I Cited runs your prompt library on a schedule and tracks citation rate, mention rate, sentiment, and share of voice across ChatGPT, Perplexity, and Google AI Overview automatically.
Complete comparison of the best AI citation tracking tools for 2026. Learn how to monitor your brand across ChatGPT, Perplexity, and Google AI Overviews, choose...
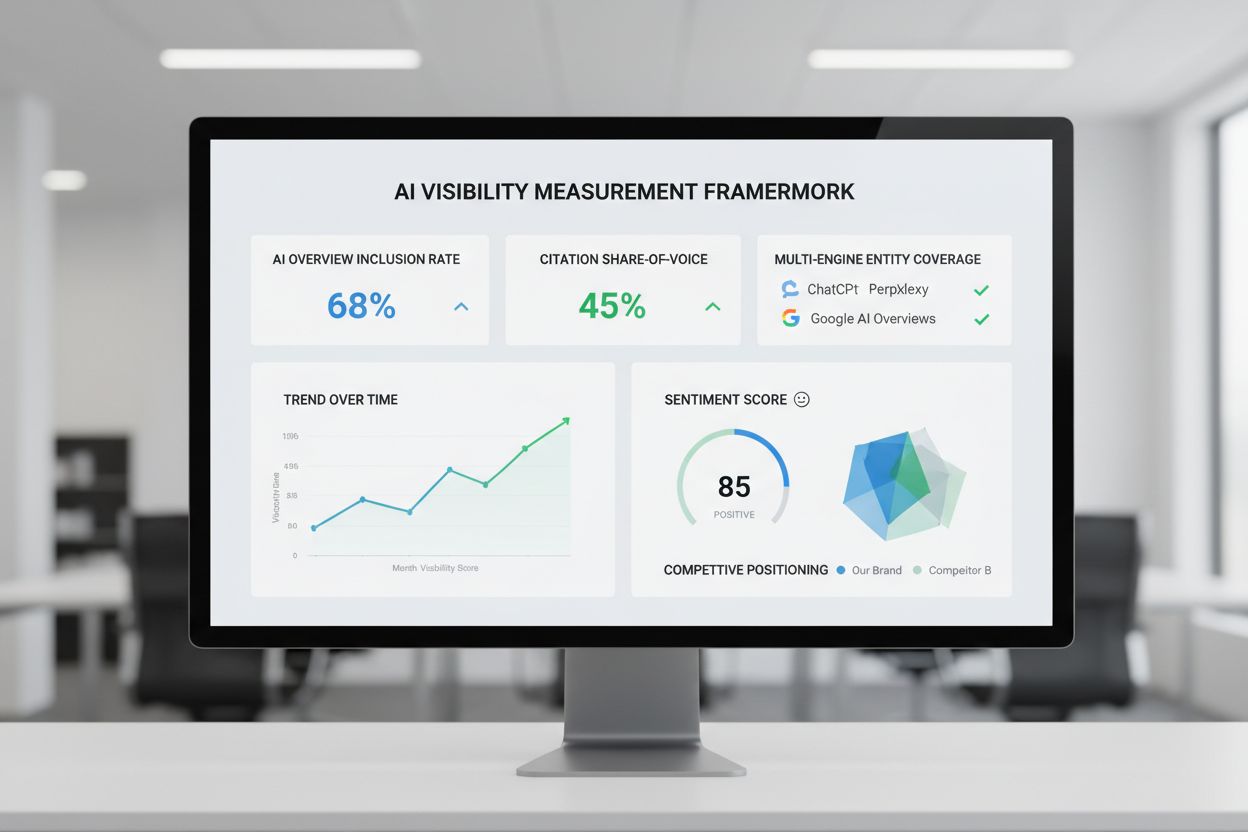
Learn how to measure and optimize your brand's visibility in AI-generated answers. Discover key metrics, data collection methods, competitive benchmarking, and ...

Follow a step-by-step AI visibility audit to measure brand mentions and citations across ChatGPT, Perplexity and other platforms.
Cookie Consent
We use cookies to enhance your browsing experience and analyze our traffic. See our privacy policy.