



What is an AI Visibility Score and How Does It Measure Brand Presence?
Learn what an AI visibility score is, how it measures your brand's presence in AI-generated answers across ChatGPT, Perplexity, and other AI platforms, and why ...
11 min read
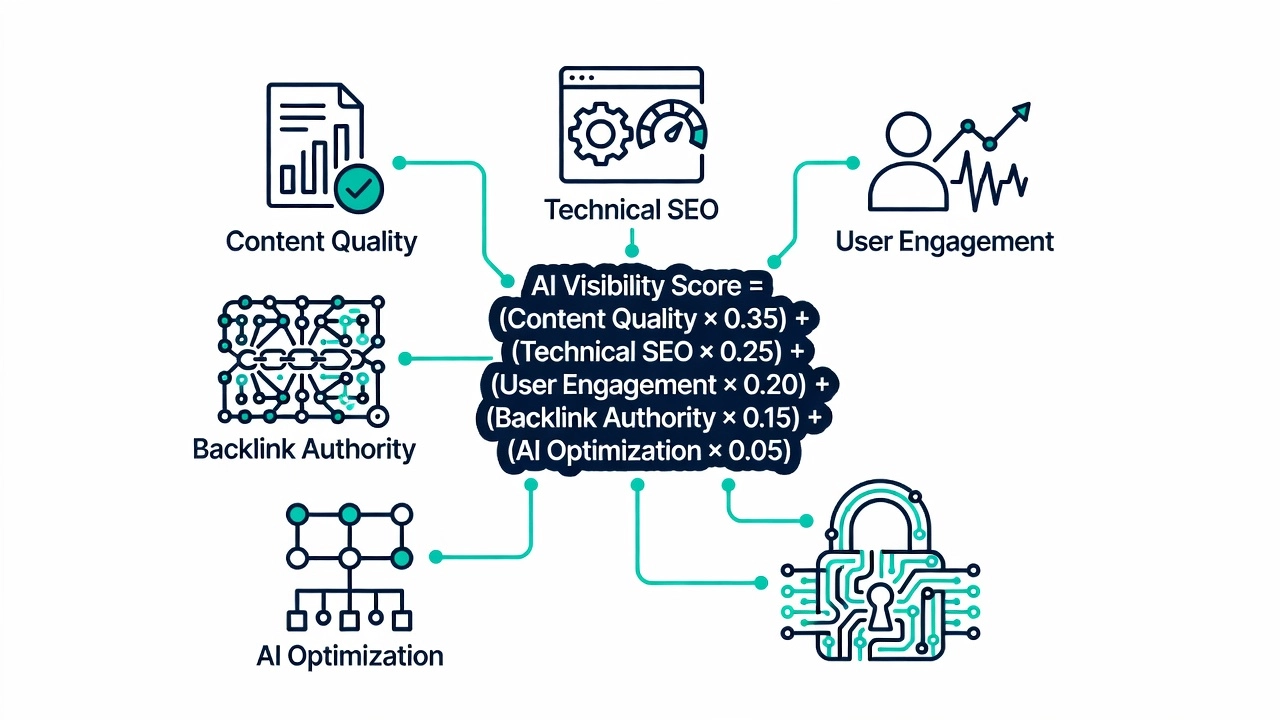
AI visibility scores vary wildly between vendors for the same brand, and it’s not a bug. Here’s the actual math behind the five components that typically feed a composite score, and why the number itself matters less than the trend.
Check your AI visibility score on two different platforms and there’s a good chance they won’t match, sometimes by a wide margin. That’s not necessarily a bug in either tool. It’s a predictable consequence of there being no industry-standard formula for what “AI visibility” actually means numerically.
This guide is a methodology deep-dive on the math behind the number. It assumes you already know what an AI visibility score is and why it matters — if you’re looking for the underlying brand-building tactics that actually raise these components, that’s where they’re covered; this piece stays focused on how the components combine into the score itself.
An AI visibility score is a composite metric, typically normalized to a 0-100 scale, that combines how often, how prominently, and how favorably a brand appears across AI-generated answers. Unlike a search ranking, which tracks position for a keyword, this measures something closer to whether the AI actually used you in its answer at all, a binary-ish outcome per query rather than a smooth position.

Track how AI chatbots mention your brand across ChatGPT, Perplexity, and other platforms.
Most vendors build their score from some version of the same five ingredients, even when they weight and label them differently.
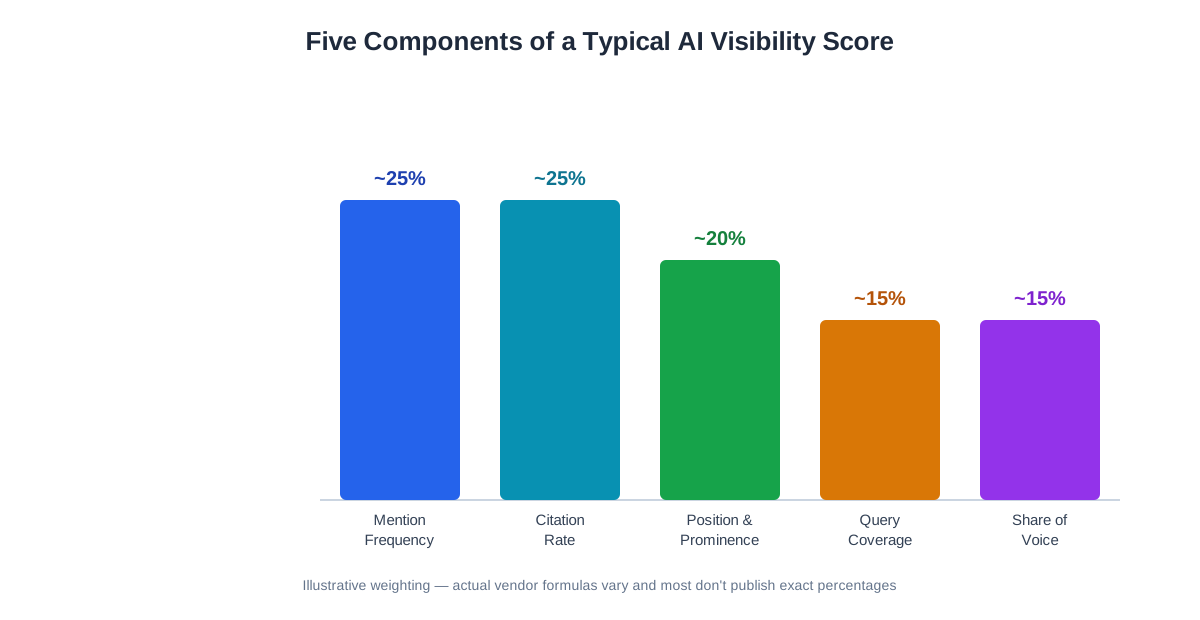
Mention frequency: the share of tracked prompts where your brand appears at all.
Mention Frequency = (Prompts where brand appears / Total prompts tested) × 100
If your brand shows up in 62 of 100 tracked prompts, that’s a 62% mention frequency. This is the most basic component and also the noisiest, since AI responses are probabilistic and the same prompt can produce different results run to run. Responsible measurement repeats each prompt several times and averages the outcome rather than trusting a single run.
Citation rate: the share of prompts where your content is explicitly used as a source, distinct from simply being named.
Citation Rate = (Prompts where brand is cited / Total prompts tested) × 100
A mention might read “Salesforce is a popular CRM.” A citation reads “According to Salesforce’s documentation, their platform integrates with over 1,000 apps,” and typically comes with a link. Citation rates run lower than mention rates in practice, being named is easier to earn than being quoted directly.
Position and prominence: where you appear relative to other brands within the same answer. A common approach weights this with an inverse-position formula, first mention scores highest, with each subsequent position worth progressively less. Being the first name in a “top options” list carries meaningfully more weight than being buried at the bottom of a comparison table.
Query coverage: breadth across different query types, informational, comparative, procedural, transactional, rather than just one narrow use case. A brand appearing across the full range of question types a buyer might ask signals broader relevance than one that only shows up for a single query shape.
Share of voice: your mentions as a percentage of all brand mentions in the category.
Share of Voice = (Your mentions / Total mentions across all brands) × 100
This normalizes your score against the competitive landscape. A 60% mention frequency sounds strong until you learn your closest competitor averages 75%.
A typical weighted formula looks something like:
Visibility Score = (Mention Freq. × ~25%) + (Citation Rate × ~25%) + (Position × ~20%) + (Query Coverage × ~15%) + (Share of Voice × ~15%)
Walking through an example: a brand with 58% mention frequency, 42% citation rate, a normalized position score of 72, 80% query coverage, and 28% share of voice would compute to roughly 55-56 on a 0-100 scale, a middling but reasonably competitive result, with the clearest room for improvement in citation rate and share of voice specifically.
Get the latest insights on AI mentions, brand monitoring, and optimization strategies.
Different weights on the same components. One vendor might weight mention frequency at 30% and citation rate at 20%; another might do the reverse. Neither choice is wrong, they just optimize for slightly different definitions of “visibility.”
Different prompt sets. Vendors vary widely in how many prompts they test and whether those prompts are purely non-branded, mixed, or tailored to your specific customer journey. A brand can score well on one platform because the tested prompts happen to align with its strengths, and worse on another testing a different mix.
Different platform coverage. A tool tracking only ChatGPT and Perplexity will produce a different number than one that also includes Gemini and Claude, even for the exact same underlying brand.
Different refresh cadence. Weekly, biweekly, and real-time measurement all smooth out (or fail to smooth out) natural week-to-week variance differently.
None of these differences means one tool is right and another is wrong. It means cross-vendor score comparisons are close to meaningless, while tracking your own trend on a single platform over time is genuinely useful.
The absolute score matters less than its direction. A brand moving from 45 to 55 over a quarter is making real progress regardless of what a competing tool’s scale would call that same movement. Track your own baseline on a rolling 30-day average to smooth out normal week-to-week noise, and look at the sub-metrics rather than only the headline number, since a 65 built mostly from mentions with weak citations tells a different story, and points to different fixes, than a 65 built the other way around.
Once you know which component is dragging your score down, the next question is what to actually do about it — content quality, original data, topical authority, and the other levers that move mention rate and citation rate are covered in AI visibility score: what it is and how to improve it .
Arshia is an AI Workflow Engineer at FlowHunt. With a background in computer science and a passion for AI, he specializes in creating efficient workflows that integrate AI tools into everyday tasks, enhancing productivity and creativity.

Am I Cited breaks down your visibility by mention rate, citation rate, and share of voice across ChatGPT, Perplexity, and Google AI Overview.
Learn what an AI visibility score is, how it measures your brand's presence in AI-generated answers across ChatGPT, Perplexity, and other AI platforms, and why ...
What an AI visibility score actually represents, why it matters more every quarter, and the concrete tactics that move it — content, technical, and monitoring....
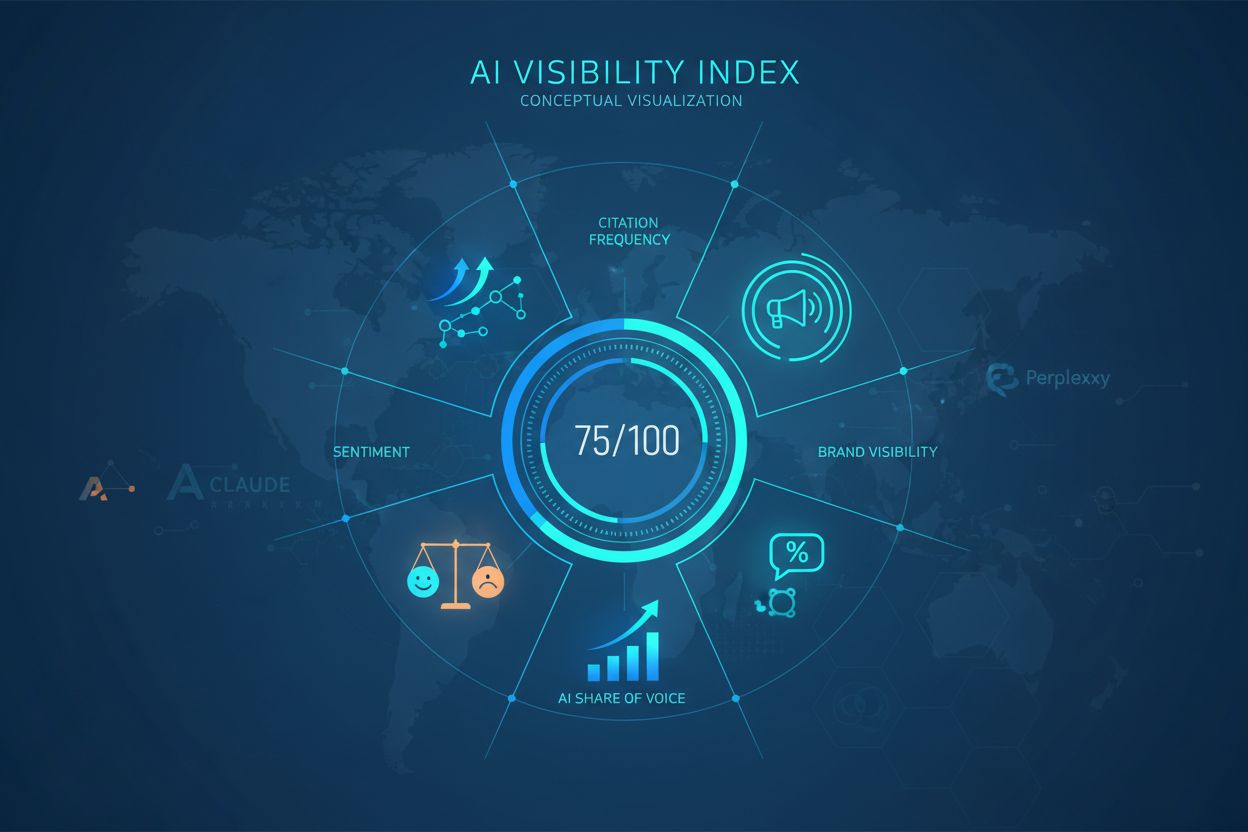
Learn what an AI Visibility Index is, how it combines citation rate, position, sentiment, and reach metrics, and why it matters for brand visibility in ChatGPT,...
Cookie Consent
We use cookies to enhance your browsing experience and analyze our traffic. See our privacy policy.